Advances in Bioscience and Biotechnology
Vol.5 No.1(2014), Article ID:41633,8 pages DOI:10.4236/abb.2014.51002
Effect of vitamin A and E on carbohydrate and lipid metabolism in diet-induced obese wistar rats
1Medical Laboratory Department, College of Applied Medical Sciences, Taif University, Turabah, Saudi Arabia
2Department of Biochemistry, College of Veterinary Medicine, Benha University, Banha, Egypt
3Department of Biotechnology, College of Science, Taif University, Taif, Saudi Arabia
4Department of Biochemistry, College of Veterinary Medicine, University of Sadat City, Sadat City, Egypt
5Department of Biochemistry, College of Veterinary Medicine, Kaferelsheikh University, Kafer El-Sheikh, Egypt
6Department of Physiology, College of Veterinary Medicine, Zagazig University, Zagazig, Egypt
7Department of Histology, College of Veterinary Medicine, Benha University, Banha, Egypt
8Department of Biomedical Sciences, Shaqraa University, College of Pharmacy, Shaqraa, Saudi Arabia
Email: *mohamedsoliman8896@yahoo.com, *mohamed.soliman@fvtm.bu.edu.eg
Copyright © 2014 Mohamed Mohamed Soliman et al. This is an open access article distributed under the Creative Commons Attribution License, which permits unrestricted use, distribution, and reproduction in any medium, provided the original work is properly cited. In accordance of the Creative Commons Attribution License all Copyrights © 2014 are reserved for SCIRP and the owner of the intellectual property Mohamed Mohamed Soliman et al. All Copyright © 2014 are guarded by law and by SCIRP as a guardian.
Received 15 November 2013; revised 16 December 2013; accepted 17 December 2013
KEYWORDS
Vitamin A and E; Lipid Metabolism; Carbohydrate Metabolism; Gene Regulation; Wistar Rats
ABSTRACT
In the present study, we investigated the biochemical alterations and gene expression of carbohydrate and lipid metabolism after oral administration of vitamin A and E for 2 months in diet-induced obese Wistar rats. Vitamin A and E administration reduced significantly the increase in body weight and food intake and normalized the alterations in lipid profiles in obese rats compared to normal rats. Moreover, both vitamins decreased the fat accumulation in liver tissues of obese rats. Finally, they up-regulated mRNA expression of Pyruvate Kinase (PK) and Glucose Transporter-2 (GLUT-2), and increased lipolysis and cholesterol metabolism through up-regulation of lipoprotein lipase (LPL), Sterol Responsible Element Binding Protein-1a (STREBP-1a) and STREBP-1c mRNA expression. In conclusion, vitamin A and E regulate gene expression of carbohydrate and lipid metabolism, and also ameliorate changes associated with obesity induced by high fat diet in Wistar rats.
1. INTRODUCTION
Vitamins have peliotropic effects on the stability of human health. Among fat soluble vitamins, vitamin A and E are the most common. The active form of vitamin A is Retinoic Acid (RA), the carboxylic acid form of vitamin A, which is a nutrient derivative with many remarkable effects on adipocytes biology and whole body adiposity [1,2]. A previous study on mice showed that treatment with RA reduces body weight and adipose depot mass independent of the changes in food intake [3], and improves glucose tolerance and insulin sensitivity probably through adipokines expression [4]. Chronic dietary vitamin A supplementation (retinyl ester form) increases thermogenic potential in brown adipose tissue and muscle. It reduces body fat content, and partly opposes the development of obesity in dietary and genetic models of mice and rats [5-7]. Vitamin E is the major fat-soluble dietary antioxidant. Vitamin E has eight isoforms and α-tocopherol is the most common isoform [8]. It has a beneficial effect on insulin sensitivity [9,10]. Moreover, an inverse relationship between plasma α-tocopherol concentration and the incidence of type 2 diabetes has been reported [11,12]. These effects of vitamin A and E occur without modulation of insulin secretion in insulin resistance.
Obesity is associated with oxidative stress in humans and mice [13]. Oxidative stress is an important pathogenic mechanism of obesity-associated metabolic syndrome [14]. Moreover, obesity is associated with disorders in carbohydrate and lipid metabolism [5]. Adipose tissue is known to produce and secrete a variety of bioactive substances known as adipocytokines, among which adiponectin and leptin are the predominant [15-17]. Leptin levels correlate with adiposity, while adiponectin levels decrease in obesity [16] and are associated with improving insulin sensitivity [18].
The relationship between vitamins and obesity with regard to carbohydrate and lipid metabolism is not fully examined. Thus, this study was conducted to test the hypothesis that obesity induces systemic alteration in antioxidant activity and lipid profiles may be ameliorated by vitamin A and E administration through modulating expression of genes responsible for carbohydrate and lipid metabolism.
2. MATERIALS AND METHODS
2.1. Materials
Streptozotocin (STZ), ethidium bromide, vitamin A (retinyl form) and vitamin E were purchased from Sigma Aldrich Co., MO, USA. The Wistar albino rats were purchased from Egyptian Co for Experimental Animals Import, Helwan, Cairo, Egypt. Solvents such as dimethylsulphoxide (DMSO) and related materials were from ADWIA pharmaceutical company, Egypt. Kits for lipids profiles, MDA, Catalase, NO and peroxidase activities were from Clini Lab, Cairo, Egypt.
2.2. Induction of Obesity and Experimental Design
Forty male Wistar rats, 3 week old, weighting 75 - 85 g, were used for this present study. All procedures were approved by the Animal Care committee of Taif University for project #2175/1434/1. Rats were acclimated to single housing for a week and maintained on a 12:12 h light dark cycle at 25˚C; and they were provided with free access to water and a standard rodent chow. The control negative group (n = 10) gained free access to water and normal chow without any treatment, while the remaining thirty rats were given High Fat Diet (HFD) for 3 months. The HFD is composed of 15.5% protein, 38.8% fat and 45.7% carbohydrates. High fat diet components are shown in Table 1. Obesity was confirmed by the increase in lipid parameters and body weight. High fat-fed rats were subdivided into the following 4 groups. Control positive group (obese, non treated group, n = 10) gained free access to water and HFD. Vitamin A obese group, (n = 10) was orally given vitamin A, retinyl form (129 mg/kg/day) as reported by Jeyakumar et al., [7] for 2 months. Vitamin E obese group (n = 10) was orally given vitamin E (340 mg/kg/day) as reported by Shen et al., [19] for 2 months. Both vitamin A and E were dissolved in DMSO; thus, both control negative and control positive rats were daily administered with same volume of DMSO. At the end of the study, the rats were anesthetized with halothane, sacrificed by decapitation after

Table 1. Components of diet induced obesity.
overnight fasting and blood was collected for serum separation. Liver samples were preserved in Bouin’s solution for histopathological examination and in Qiazol reagent for RNA extraction. During experimental procedures, changes in body weight and food intake were recorded at indicated time points as shown in Table 2.
2.3. Assay of Biochemical Parameters
Serum triacylglycerol (TAG), total cholesterol (TC), very low density lipoproteins (VLDL), low density lipoproteins (LDL) and high density lipoproteins (HDL) were measured spectrophotometrically using commercial kits, malondialdehyde (MDA), nitrous oxide (NO), peroxidase and catalase were measured using ELISA kits based on the manufacturer’s instruction manual.
2.4. Liver Histopathology
The liver samples were fixed in Bouin’s solution, then dehydrated in ascending grades of alcohols, and finally cleared in xylene and embedded in paraffin. The samples were seeded in blocks, then sliced into 5 µm in thickness and placed on top of glass slides. The slides were stained with Mayer’s haematoxylin and eosin (H and E) and examined by a light microscope.
2.5. RNA Extraction AND cDNA Synthesis
For preparation of total RNA, liver tissue samples (approximately 100 mg per sample) were collected from rats, flash frozen in liquid nitrogen and subsequently stored at −70˚C in 1 ml Qiazol (QIAGEN Inc., Valencia, CA). Frozen samples were homogenized using a Polytron 300 D homogenizer (Brinkman Instruments, Westbury, NY). Then, 0.3 ml chloroform was added to the homogenate. The mixtures were shaken for 30 seconds followed by centrifugation at 4˚C and 12,500 rpm for 20 min. The supernatant layer was transferred to a new set of tubes, and an equal volume of isopropanol was added to the

Table 2. Changes in body weight (A) and food intake (B) in obese Wistar rats after oral administration of vitamin A and E for 2 months.
samples, shacked for 15 seconds and centrifuged at 4˚C and 12,500 rpm for 15 min. The RNA pellets were washed with 70% ethanol, briefly dries up, and then dissolved in Diethylpyrocarbonate (DEPC) water. The prepared RNA integrity was checked by electrophoresis. RNA concentration and purity were determined spectrophotometrically at 260 nm. The ratio of the 260/280 optical density of all RNA samples was 1.7 - 1.9.
For synthesis of cDNA, mixture of 2 µg total RNA and 0.5 ng oligo dT primer in a total volume of 11 µl sterilized DEPC water was incubated in the PeX 0.5 thermal Cycler (Thermo Electronic Corporation, Milford, Ma) at 65˚C for 10 min for denaturation. Then, 4 µl of 5X RT-buffer, 2 µl of 10 mM dNTPs and 100 U Moloney Murine Leukemia Virus (M-MuLV) Reverse Transcriptase (SibEnzyme Ltd. Ak, Novosibirsk, Russia) were added and the total volume was completed up to 20 µl by DEPC water. The mixture was then re-incubated in the thermal Cycler at 37˚C for 1 h, then at 90˚C for 10 min to inactivate the enzyme.
2.6. Semi-Quantitative PCR Analysis
Specific primers for tested genes (Table 3) were designed using Oligo-4 computer program and synthesized by Macrogen (Macrogen Company, GAsa-dong, Geumcheon-gu. Korea). PCR was conducted in a final volume of 25 µl consisting of 1 µl cDNA, 1 µl of 10 picomolar (pM) of each primer (forward and reverse), and 12.5 µl PCR master mix (Promega Corporation, Madison, WI), the volume was brought up to 25 using sterilized, deionized water. PCR was carried out using a PeX 0.5 thermal Cycler with the cycle sequence at 94˚C for 5 minutes one cycle, followed by 25 cycles each of which consists of denaturation at 94˚C for one minute, annealing at the specific temperature corresponding to each primer (Table 3) and extension at 72˚C for one minute with additional final extension at 72˚C for 5 minutes. As a reference, expression of glyceraldehyde-3-phosphate dehydrogenase (G3PDH) mRNA was detected using specific primers (Table 3). PCR products were electrophorized on 1% agarose (Bio Basic INC. Konrad Cres, Markham Ontario) gel stained with ethidium bromide in TBE (TrisBorate-EDTA) buffer. PCR products were visualized under UV light and photographed using gel documentation system. The intensities of the bands were quantified densitometrically using NIH image program (http://rsb.info.nih.gov/nih-image/).
2.7. Statistical Analysis
Results are expressed as means ± S.E. of 10 independent rats per each group. Statistical analysis was done using ANOVA and Fischer’s post hoc test, with p < 0.05 being considered to be statistically significant.
3. RESULTS
3.1. Effect of Vitamin A and E Administration on Changes in Body Weight and Food intake
Administration of vitamin A and E to obese rats for 2 months decreased the increase in body weight compared to obese and control fed rats. The decrease in body weight and food intake was time dependent. It was significant from second week and continued to the end of the experiment (Table 2).
3.2. Effect of Vitamin A and E Administration on Changes in Lipid Profiles, Antioxidants and Nitrous Oxide (NO) levels
Induction of obesity in Wistar rats increased serum levels of TAG, cholesterol, VLD and VLDL and decreased HDL levels. Administration of Vitamin A and E normalized the increase in TAG, cholesterol, VLD and VLDL compared to control and obese rats (Table 4). Regarding the changes in HDL levels, obesity decreased HDL levels while both vitamin A and E administration normalized it relative to control and obese levels confirming their hypolipidemic action (Table 4). Vitamin A and E administration to obese rats normalized changes in MDA levels. Moreover, catalase activity was decreased in obese rats and normalized in vitamin A and E administered rats (Table 4). Of note, obesity had no effect on peroxidase activity and the administration of either vitamin A or E does not affect peroxidase activity. Moreover, obesity

Table 3. PCR conditions for genes of carbohydrate and lipid metabolism.

Table 4. Changes in lipid profiles, antioxidants and nitous oxide (NO) after administration of vitamin A and E for 2 months in normal and obese Wistar rats.
induced endothelial dysfunction through alteration in NO levels, as obesity decreased NO levels and administration of vitamin A and E normalized NO levels (Table 4).
3.3. Hepatic Histopathological Findings after Administration of Vitamin A and E
As seen in Figure 1, liver of control group showed polygonal hepatocytes with basophilic nuclei and shiny eosinophilic cytoplasm. It is arranged in the form of hepatic cords around the central vein (Figure 1(a)). The liver of obese group showed hydropic and vacuolar degeneration in the contour of the hepatocytes. Prominent fatty changes were observed in the form of signet ring cells especially in the central core of the liver (Figure 1(b)). Activation in the von kupffer cells were noticed in the hepatocytes. The liver of Vit. E group (obese group,
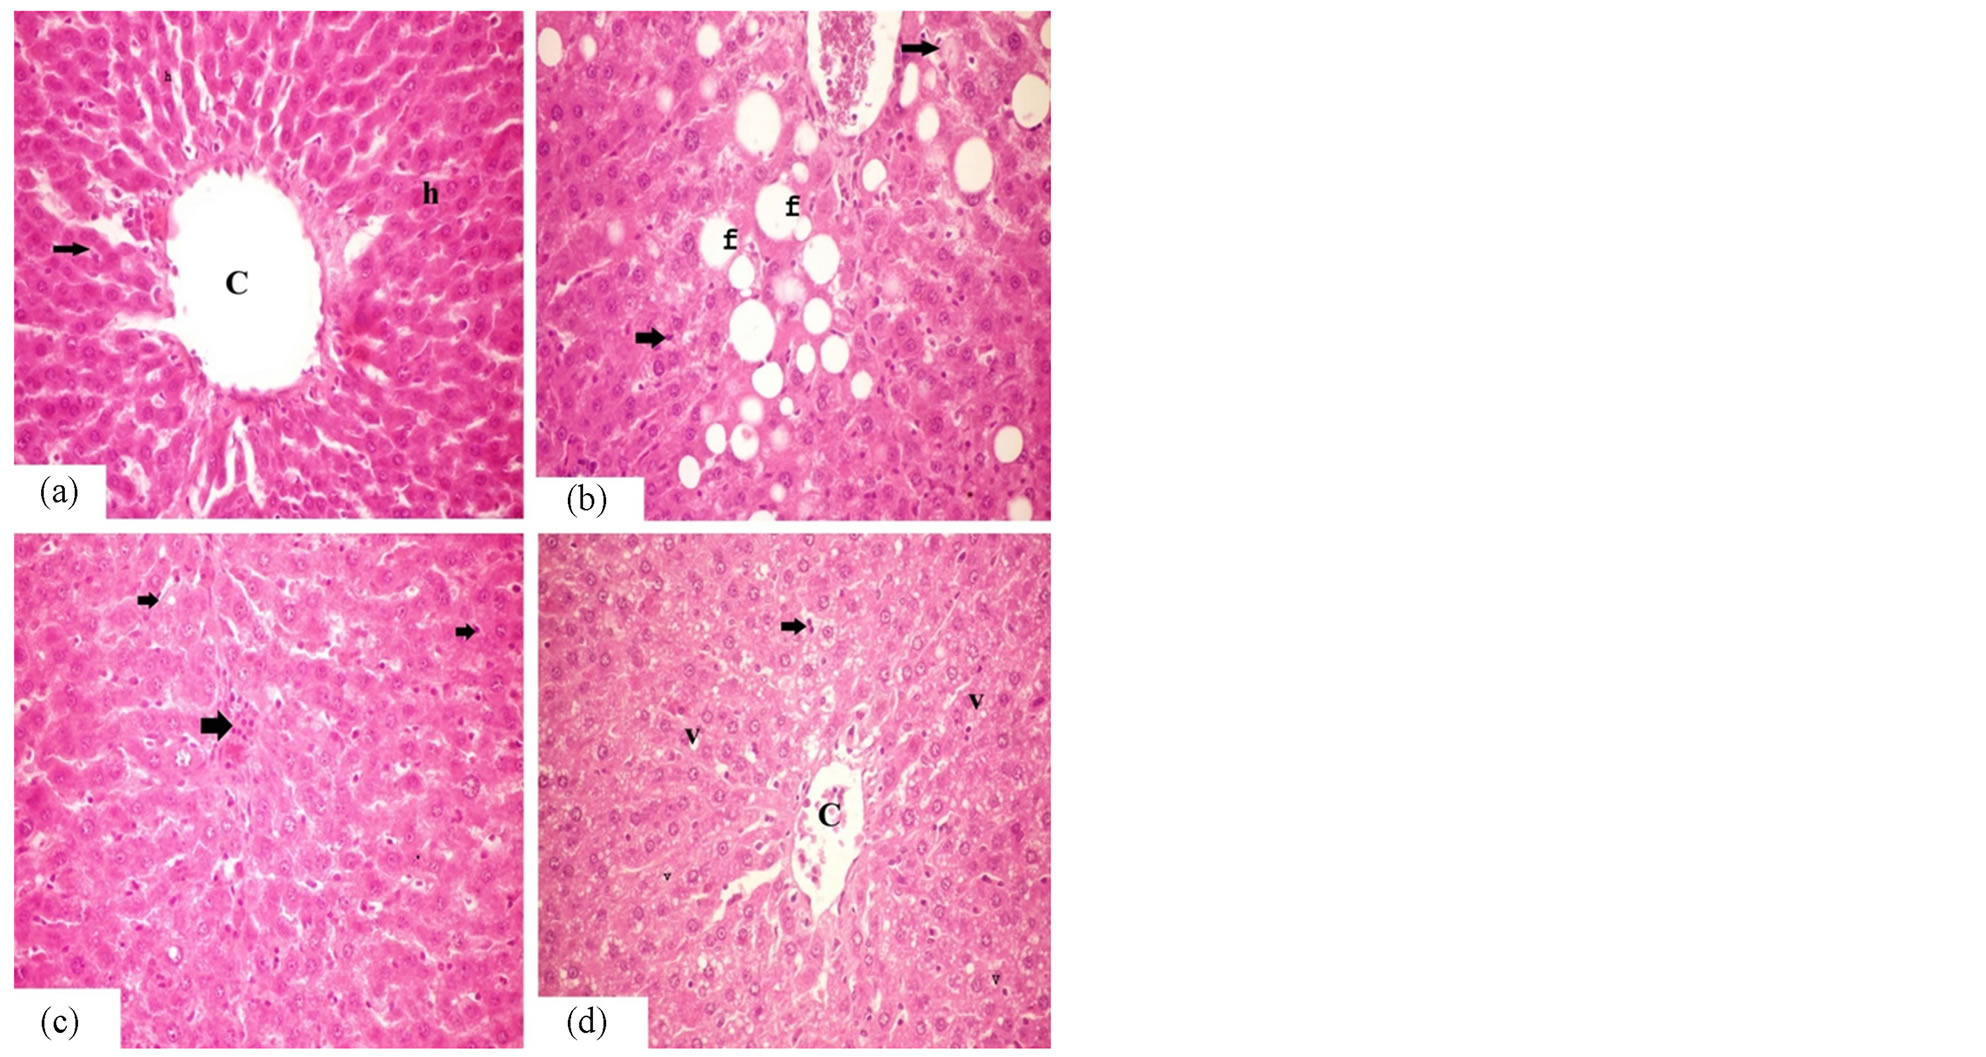
Figure 1. Liver histopathology after oral administration of Vitamin A and E. (a) is control liver shows normal central vein, hepatocytes (h) and hepatic cords (arrows). (b) is obese liver showing fatty changes (F) and activation in von kupffer cells (arrows). (c) Liver of Vitamin E administered obese rats shows decrease in number of activated von kupffer cells (arrows). (d) Liver of vitamin A administered obese rats shows vacuolar degeneration (V) and decrease in number of activated von kupffer cells (arrows). ×40.
treated with vitamin E) showed regeneration in the hepatocytes. The number of the activated von kupffer cells was noticed in the hepatocytes, but less than that of the obese group (Figure 1(c)). The liver of Vit. A group (obese group, treated with vitamin A) showed, a decrease in the number of cells with fatty changes, while the vacuolar degeneration is still prominent in the hepatocytes (Figure 1(d)).
3.4. Effect of Vitamin A and E on Gene Expression of Carbohydrate and Lipid Metabolism
The expression of carbohydrate metabolism-related genes such as pyruvate kinase (PK), phosphoenol pyruvate carboxykinase (PEPCK) and GLUT-2 were tested in liver tissue of obese and vitamin A and E-supplemented obese rats. As seen in Figure 2(a), both vitamin A and E up-regulated PK mRNA expression indicating an increase in glycolysis without any significant changes in mRNA expression of PEPCK (Figure 2(b)), and an increase in GLUT-2 mRNA expression (Figure 2(c)) was recorded. Moreover, vitamin A and E modulated lipid metabolism (Figure 3) as they increased lipolysis by upregulation of LPL mRNA expression (Figure 3(a)). Regarding their effects on FAS, the results showed that vitamin A is less effective on FAS mRNA expression than vitamin E (Figure 3(b)). Finally, vitamin A and E induced up-regulation in mRNA expression of STREBP-1a and STREBP-1c, genes that are essential for hepatic cholesterol metabolism (Figures 3(c) and (d)).
4. DISCUSION
Retinoic acid, the carboxylic acid form of vitamin A, is a nutrient derivative with many remarkable effects on adipose tissue biology and energy balance control system. Previous studies on mice showed that treatment with alltrans retinoic acid reduces body weight and adiposity independent of the changes in food intake [20-22] and also improves glucose tolerance [3]. Vitamin A induces body fat loss that correlates with activation of brown adipose tissue [23], reduces adipogenic/lipogenic capabilities [22] and increases capabilities for oxidative metabolism and thermogenesis in white adipose tissue depots [5]. In the meantime, vitamin E is the best fat soluble antioxidant known for its protective effects on lipid membranes and unsaturated fatty acids [9]. Vitamin E is well documented to prevent atherosclerosis and may also help in the prevention of Alzheimer’s disease [24]. Its protective effects include the heart, brain, skin, eyes, liver, breasts, and prostate. It stabilizes blood fats so the blood vessels and heart are protected from free radicalinduced injury. Those already established data coincided with ours, as vitamin A and E act as hypolipidemic molecules which normalize the changes in lipid profiles of obese rats but vitamin E effect is more prominent probably through its action on reactive oxygen species ROS [9].
Vitamins and minerals supplementation has been promoted as a strategy to prevent atherosclerosis. In vitro studies, antioxidants such as vitamin E and C, carotene, and selenium reduce lipid peroxidation and free radical damage, which are important intermediaries in the pa-

Figure 2. RT-PCR analysis of PK, PRPCK and GLUT-2 expression after oral administration of Vitamin A and E to obese Wistar rats. Vitamin A and E were administered for 2 months as described in materials and methods. RNA was extracted and reverse transcribed (1 µg) and RT-PCR analysis was carried out for PK, PRPCK and GLUT-2 genes. Densitometric analysis was carried for 3 different rats. *p < 0.05 vs. control while #p < 0.05 vs. obese group.
thogenesis of atherosclerosis and other metabolic disorders [25,26] and that are in agreement with our findings. Obesity is associated with oxidative stress in humans and mice [13] which leads to obesity-associated metabolic syndrome [14] and disorders in carbohydrate and lipid metabolism [5]. In this study, MDA as a biomarker for oxidative stress is increased in obese rats and normalized by the administration of vitamin A and E. They may improve insulin sensitivity through other mediators such as leptin and/or adiponectin [27,28]. Leptin levels often correlate with adiposity, while adiponectin concentration is paradoxically decreased in obesity [17] and is associated with improving insulin sensitivity [18]. Thus, vitamins may act as local factors that affect incidence of obesity through their alteration on oxidative stress. Obesity is the main cause of metabolic related disorders such as insulin resistance, atherosclerosis and type II diabetes [15,16]. NO is a blood parameter that reflects the cardiovascular state of body. As known, obesity is associated with endothelial dysfunction that resulted from hypercholesterolemia and high fat diet and consequently atherosclerosis. NO is a vasodilator factor, its levels are low in obese and hypertensive patients [29]. Our findings showed that feeding rats with high fat diet to rats decreases NO levels and vitamin A and E normalized it.

Figure 3. RT-PCR analysis of LPL, FAS, STREBP-1a and STREBP-1c expression after oral administration of Vitamin A and E to obese Wistar rats. Vitamin A and E were administered for 2 months as described in materials and methods. RNA was extracted and reverse transcribed (1 µg) and RT-PCR analysis was carried out for LPL, FAS, STREBP-1a and STREBP-1c genes. Densitometric analysis was carried for 3 different rats. *p < 0.05 vs. control while #p < 0.05 vs. obese group.
It could be predicted that glycogen levels in tissues (muscle and liver) decreased as the influx of glucose in liver, thus, inhibited in the absence of insulin and recovered on insulin treatment [30]. Our findings showed that the administration of vitamin A and E to obese rats induced significant increase in PK mRNA expression without changes in PEPCK mRNA expression. The PK activity decreases as the result of diabetes and increases by the administration of insulin to diabetic rats in the liver tissues [31]. The increase in activity of PK in the liver tissue of rats is the cause of the increase in glycolysis and the decrease in gluconeogenesis as indicated by PEPCK mRNA expression [32]. Moreover, GLUT2 expression increased after vitamin A and E administration. As known, GLUT2 is a trans-membrane carrier protein, which enables passive glucose movement across cell membranes. GLUT-2 is the principal transporter for the transfer of glucose between liver and blood, and for renal glucose reabsorption [33]. Thus, our findings showed that vitamin A and E ameliorated obesity through the increase in glycolysis and hepatic glucose uptake (PK and GLUT-2 mRNA expression) respectively.
Obesity is associated with type II diabetes and insulin resistance. Obesity is frequently associated with abnormal lipid metabolism. Elevated TG, cholesterol and LDL levels, and reduced HDL are the key abnormalities that constitute dyslipidemia [34]. Here, our results show that vitamin A and E supplementation normalized the changes induced in lipid profiles suggesting an improvement in insulin sensitivity through up-regulation in LPL STREBP-1a and STREBP-1c expression, while FAS expression was down regulated. All together shows the importance of vitamin A and E as nutrient molecules which help in preventing the body from biohazards related to obesity through their regulation of gene expression of carbohydrates and lipids together with their antioxidant activities. In conclusion, vitamin A and E administration ameliorated the biohazard changes recorded in diet-induced obese Wistar rats. Vitamin A and E normalized the changes in lipid profiles and regulated the gene expression of carbohydrate and lipid metabolism in obese Wistar rats.
ACKNOWLEDGEMENTS
We greatly appreciate the contributions of all authors to finish this study. This study was supported in part by a Grant-in-Aid of the Dean of Scientific Research (No.2175-1434-1), College of Applied Medical Sciences, Taif University, Saudi Arabia.
REFERENCES
- Bonet, M.L., Ribot, J., Felipe, F. and Palou, A. (2003) Vitamin A and the regulation of fat reserves. Cellular and Molecular Life Sciences, 60, 1311-1321. http://dx.doi.org/10.1007/s00018-003-2290-x
- Villarroya, F., Iglesias, R. and Giralt, M. (2004) Retinoids and retinoid receptors in the control of energy balance: Novel pharmacological strategies in obesity and diabetes. Current Medicinal Chemistry, 11, 795-805. http://dx.doi.org/10.2174/0929867043455747
- Berry, D.C. and Noy, N. (2009) All-trans-retinoic acid represses obesity and insulin resistance by activating both peroxisome proliferation-activated receptor beta/delta and retinoic acid receptor. Molecular and Cellular Biology, 29, 3286-3296. http://dx.doi.org/10.1128/MCB.01742-08
- Mercader, J., Granados, N., Bonet, M.L. and Palou, A. (2008) All-trans retinoic acid decreases murine adipose retinol binding protein 4 production. Cellular Physiology and Biochemistry, 22, 363-372. http://dx.doi.org/10.1159/000149815
- Kumar, M.V. Sunvold, G.D. and Scarpace, P.J. (1999) Dietary vitamin A supplementation in rats: Suppression of leptin and induction of UCP1 mRNA. Journal of Lipid Research, 40, 824-829.
- Felipe, F., Bonet, M.L., Ribot, J. and Palou, A. (2003) Up-regulation of muscle uncoupling protein 3 gene expression in mice following high fat diet, dietary vitamin A supplementation and acute retinoic acid treatment. International Journal of Obesity and Related Metabolic Disorders, 27, 60-69. http://dx.doi.org/10.1038/sj.ijo.0802188
- Jeyakumar, S.M. Vajreswari, A. and Giridharan, N.V. (2006) Chronic dietary vitamin A supplementation regulates obesity in an obese mutant WNIN/Ob rat model. Obesity (Silver Spring), 14, 52-59. http://dx.doi.org/10.1038/oby.2006.7
- Traber, M.G. (2007) Vitamin E regulatory mechanisms. Annual Review of Nutrition, 27, 347-362. http://dx.doi.org/10.1146/annurev.nutr.27.061406.093819
- Manning, P.J., Sutherland, W.H., Walker, R.J., Williams, S.M., De Jong, S.A., Ryalls, A.R. and Berry, E.A. (2004) Effect of high-dose vitamin E on insulin resistance and associated parameters in overweight subjects. Diabetes Care, 27, 2166-2171. http://dx.doi.org/10.2337/diacare.27.9.2166
- Montonen, J, Knekt, P., Javrvinen, R. and Reunanen, A. (2004) Dietary antioxidant intake and risk of type 2 diabetes. Diabetes Care, 27, 362-366. http://dx.doi.org/10.2337/diacare.27.2.362
- Mayer-Davis, E.J., Costacou, T., King, I., Zaccaro, D.J. and Bell, R.A. (2002) Plasma and dietary vitamin E in relation to incidence of type 2 diabetes: The insulin resistance and atherosclerosis study (IRAS). Diabetes Care, 25, 2172-2177. http://dx.doi.org/10.2337/diacare.25.12.2172
- Laight, D.W., Desai, K.M., Gopaul, N.K., Anggård, E.E. and Carrier, M.J. (1999) F2-isoprostane evidence of oxidant stress in the insulin resistant, obese Zucker rat: effects of vitamin E. European Journal of Pharmacology, 377, 89-92. http://dx.doi.org/10.1016/S0014-2999(99)00407-0
- Soltys, K. Dikdan, G. and Koneru, B. (2001) Oxidative stress in fatty livers of obese Zucker rats: Rapid amelioration and improved tolerance to warm ischemia with tocopherol. Hepatology, 34, 13-18. http://dx.doi.org/10.1053/jhep.2001.25452
- Furukawa, S., Fujita, T., Shimabukuro, M., Iwaki, M., Yamada, Y., Nakajima, Y., Nakayama, O., Makishima, M., Matsuda, M. and Shimomura, I. (2004) Increased oxidative stress in obesity and its impact on metabolic syndrome. Journal of Clinical Investigation, 114, 1752-1761.
- Trayhurn, P.J. and Beattie, H. (2001) Physiological role of adipose tissue: White adipose tissue as an endocrine and secretory organ. The Proceeding of the Nutrition Society, 60, 329-339. http://dx.doi.org/10.1079/PNS200194
- Mohamed-Ali, V., Pinkney, J. H. and Coppack, S.W. (1998) Adipose tissue as an endocrine and paracrine organ. International Journal of Obesity and related metabolic disorders, 22, 1145-1158. http://dx.doi.org/10.1038/sj.ijo.0800770
- Rossi, A.R., Lombardo, Y.B., Lacorte, J., Chicco, A.G., Rouault, C., Slama, G. and Rizkalla, S.W. (2005) Dietary fish oil positively regulates plasma leptin and adiponectin levels in sucrose-fed, insulin-resistant rats. American Journal of Physiology. Regulatory, Integrative and Comparative Physiology, 289, 486-494. http://dx.doi.org/10.1152/ajpregu.00846.2004
- Lara-Castro, C., Fu, Y., Chung, B.H. and Garvey, W.T. (2007). Adiponectin and the metabolic syndrome: Mechanisms mediating risk for metabolic and cardiovascular disease. Current Opinion in Lipidology, 18, 263-270. http://dx.doi.org/10.1097/MOL.0b013e32814a645f
- Shen, X., Tang, Q., Huang, J. and Cai, W. (2010) Vitamin E regulates adipocytokine expression in a rat model of dietary-induced obesity. Experimental Biology and Medicine, (Maywood), 235, 47-51. http://dx.doi.org/10.1258/ebm.2009.009122
- Felipe, F., Bonet, M.L., Ribot, J. and Palou, A. (2004) Modulation of resistin expression by retinoic acid and vitamin A status. Diabetes, 53, 882-889. http://dx.doi.org/10.2337/diabetes.53.4.882
- Mercader, J., Ribot, J., Murano, I., Felipe, F., Cinti, S., Bonet, M.L. and Palou, A. (2006) Remodeling of white adipose tissue after retinoic acid administration in mice. Endocrinology, 147, 5325-5332. http://dx.doi.org/10.1210/en.2006-0760
- Ribot, J., Felipe, F., Bonet, M.L. and Palou, A. (2001) Changes of adiposity in response to vitamin A status correlate with changes of PPAR gamma 2 expression. Obesity Research, 9, 500-509. http://dx.doi.org/10.1038/oby.2001.65
- Bonet, M.L., Oliver, J., Picó, C., Felipe, F., Ribot, J., Cinti, S. and Palou, A. (2000) Opposite effects of vitamin A deficient diet-feeding and retinoic acid treatment on brown adipose tissue UCP1, UCP2 and leptin expression. Journal of Endocrinology, 166, 511-517. http://dx.doi.org/10.1677/joe.0.1660511
- Griffith, J.W. and Lang, C.M. (1987) Vitamin E and selenium status of guinea pigs with myocardial necrosis. Laboratory Animal Science, 37, 776-779.
- Bleys, J., Miller, E.R., Pastor-Barriuso, R., Appel, L.J. and Guallar, E. (2006) Vitamin-mineral supplementation and the progression of atherosclerosis: a meta-analysis of randomized controlled trials. American journal of Clinical Nutrition, 84, 880-887.
- Steinberg, D. and Witztum, J.L. (2002) Is the oxidative modification hypothesis relevant to human atherosclerosis? Do the antioxidant trials conducted to date refute the hypothesis? Circulation, 105, 2107-2111. http://dx.doi.org/10.1161/01.CIR.0000014762.06201.06
- Krskova-Tybitanclova, K., Macejova, D., Brtko, J., Baculikova, M., Krizanova, O. and Zorad, S. (2008) Short term 13-cis-retinoic acid treatment at therapeutic doses elevates expression of leptin, GLUT4, PPAR gamma and aP2 in rat adipose tissue. Journal of Physiology and Pharmacology, 59, 731-743.
- Landrier, J.F., Gouranton, E., Yazidi, E.L., Malezet, C., Balaguer, P., Borel, P. and Amiot, M.J. (2009) Adiponectin expression is induced by vitamin E via a peroxisome proliferator activated receptor gamma-dependent mechanism. Endocrinology, 150, 5318-5325. http://dx.doi.org/10.1210/en.2009-0506
- Williams, I.L., Wheatcroft, S.B., Shah, A.M. and Kearney, M.T. (2002) Obesity, atherosclerosis and the vascular endothelium: Mechanisms of reduced nitric oxide bioavailability in obese humans. International Journal of Obesity and Related Metabolic Disorders, 26, 754-764.
- Vats, V., Yadav, S.P. and Grover, J.K. (2004). Ethanolic extract of Ocimum sanctum leaves partially attenuates streptozotocin-induced alterations in glycogen content and carbohydrate metabolism in rats. Journal of Ethnopharmacolology, 90, 155-160. http://dx.doi.org/10.1016/j.jep.2003.09.034
- Yamada, K. and Noguchi, T. (1999) Nutrient and hormonal regulation of pyruvate kinase gene expression. Biochemical Journal, 337, 1-11. http://dx.doi.org/10.1042/0264-6021:3370001
- Taylor, R. and Agius, L. (1988) The biochemistry of diabetes. Biochemical Journal, 250, 625-640.
- Freitas, H.S., Schaan, B.D., Seraphim, P.M., Nunes, M.T. and Machado, U.F. (2005) Acute and short-term insulin-induced molecular adaptations of GLUT2 gene expression in the renal cortex of diabetic rats. Endocrinology, 237, 49-57.
- Csont, T., Balogh, G., Csonka, C., Boros, I., Horva, I., Vigh, L. and Ferdinandy, P. (2002) Hyperlipidemia induced by high cholesterol diet inhibits heat shock response in rat hearts. Biochemical ad Biophysical Research Communicatios, 290, 1535-1538. http://dx.doi.org/10.1006/bbrc.2002.6377
LIST OF ABBREVIATIONS
PK: Pyruvate Kinase PEPCK: Phosphoenol pyruvate carboxykinase GLUT-2: Glucose transporter-2 LPL: Lipoprotein lipase STREBP: Sterol responsible element binding protein RA: Retinoic acid DMSO: Dimethyl sulphoxide HFD : High fat diet MDA: Malondialdehyde NO: Nitrous oxide TAG : Triacylglycerol TC: Total cholesterol VLDL: Very low density lipoproteins LDL : Low density lipoproteins HDL : High density lipoproteins DEPC: Diethylpyrocarbonate ROS : Reactive oxygen species FAS: Fatty acids synthase RT-PCR: Reverse transcription polymerase chain reaction
NOTES
*Corresponding author.