International Journal of Geosciences
Vol.3 No.6A(2012), Article ID:25122,8 pages DOI:10.4236/ijg.2012.326118
Ambient Vibration Recording for Single-Station, Array and Building Studies Made Simple: CityShark II
1Institut de Recherche pour le Développement, Grenoble, France
2Institut Français des Sciences et Technologies des Transports de l’Aménagement et des Réseaux, Grenoble, France
3École et Observatoire des Sciences de la Terre, Strasbourg, France
4Laboratoire d’Électronique Angelidis Sarrault, Saint Ismier, France
Email: jean-luc.chatelain@ird.fr
Received September 6, 2012; revised October 2, 2012; accepted November 1, 2012
Keywords: CityShark; Ambient Vibrations; H/V; Building; Array; Earthquakes; Portable Recorder; Earthquakes
ABSTRACT
This article describes an improved data acquisition system from a previous system dedicated to one-sensor site studies, aimed at recording ambient vibrations (microtremors). A multi-channel and/or remote triggering system is proposed. The system was conceived by IRD-Leas, France, and used at ISTerre, France, for research activities. The size, weight of this high quality system and its autonomy (no need to be connected to a laptop) make it a real portable device. The system acquires data with 24-bit delta-sigma ADCs in the 10 - 1000 sps range at 10 - 20 bit resolution on up to 18 channels in the multi-channel version. The input stage dynamics is available at ±2.5 V or ±5 V. The dynamic range varies, for example, from 108 dB at 100 sps to 90 dB at 250 sps. Gain is selectable from 1 (0 dB) to 8192 (78 dB) by powers of two (6 dB). Its very low level of internal noise allows recording of very low tension signals without missing code. Continuous recording and GPS may also be implemented in the system. While primarily dedicated to ambient vibration recordings, this system can be connected to any type of device delivering an output tension in the ±5 V range.
1. Introduction
CityShark II (Figure 1) is an enhanced version of the CityShark station [1], aimed at single-station, array and building studies using ambient vibration, or any low voltage signal, recordings. It has been developed at ISTerre by IRD, the French Institute for Research for Development, and LEAS, a French company dedicated to geophysical data acquisition.
Although CityShark has been very well rated for use in ambient vibration experiments, and ranked second among 12 tested stations in the SESAME equipment evaluation [2-4], the need for such enhancement appeared because CityShark was originally designed to record data from only one sensor, without any time base, aimed at ambient vibration H/V and simple building studies. While it rapidly appeared that CityShark proved to be well suited and reliable for H/V ambient vibration studies [4], the fact that no time reference was used in the data acquisition, as it is not necessary in H/V experiments or simple fundamental building frequency determination, turned out to be a burden when considering ambient vibration array experiments and/or determining buildings parameters such as modal deformation, for example. In other words, while possible with a bit of imagination, CityShark was complicated to use in getting synchronous ambient vibration recordings from several places/sites, and a multi-channels option appeared to be essential for array and building applications.
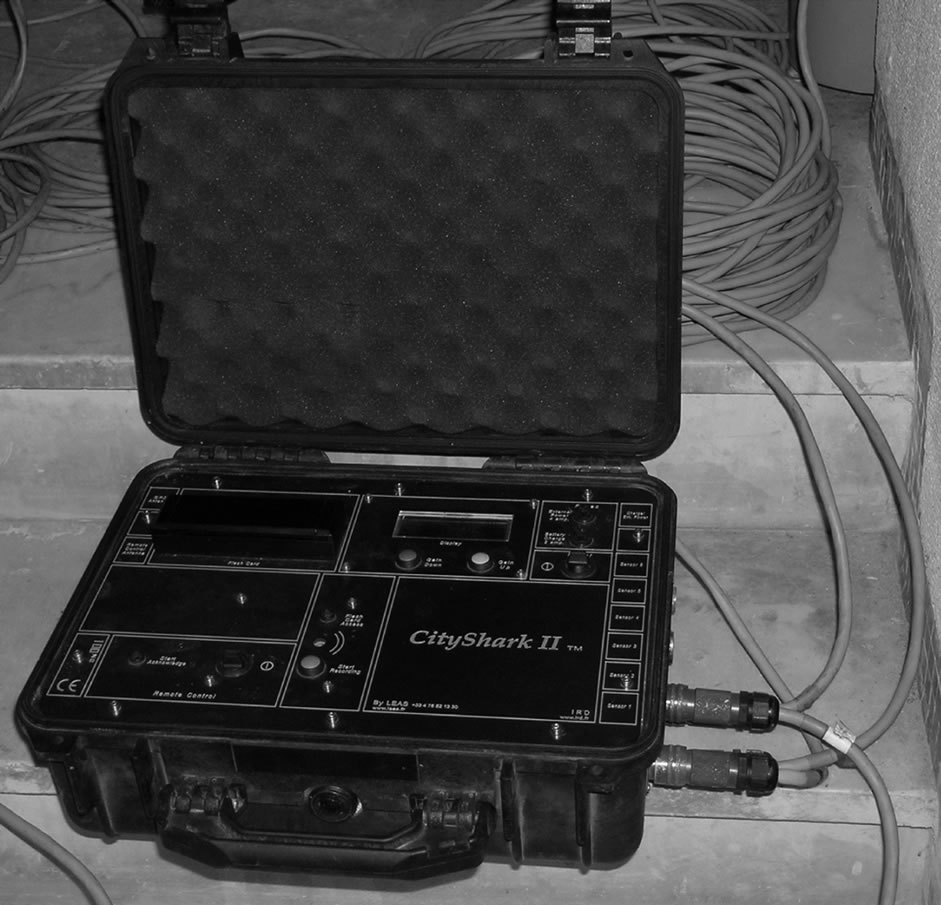
Figure 1. View of a CityShark II-6 station.
It has therefore been decided to develop an instrument, keeping the simple operating philosophy of CityShark, with new capabilities aimed at getting synchronous recordings.
2. CityShark II New Features
CityShark II follows the same operating philosophy as CityShark, i.e. 1) all field operations are performed without any computer connected to the station; 2) push-buttons to set up the recording parameters, as well as to manage the recording procedure; and 3) the station communicates with the operator through a 20-character 4-line LCD built-in screen [1]. As for CityShark, the operating instruction manual simply fits in a single double-sided sheet.
CityShark users will have no surprise: CityShark II is lodged in the same type of case, i.e. it is not more voluminous (420 × 335 × 180 mm), although somewhat heavier (7 kg) in its 6-sensor configuration mainly because of the use of a more powerful internal battery (12 V/7 Ah). Also, the same sensor connectors are used (Souriau 851, i.e. Lennartz sensor compatibility). Active sensor(s) is/are powered through the station internal battery. For longer studies it is possible to connect the station to an external battery or to power it with the battery charger. When used with six active sensors the power consumption is 200 mA, with an auto power-off mode in case of low battery voltage.
2.1. Main New Features
The five main features added to CityShark II are:
1) CityShark II is available in any configuration to synchronously record one (CityShark II-1) to six (CityShark II-6) 3C sensors, i.e. 3 to 18 channels, by step of 3, a CityShark II-1 being equivalent to the former CityShark;
2) An option for continuous recording, with data storage into files, which size is chosen by the operator, allowing applications such as short or/and long-term monitoring of structures such as structural health monitoring;
3) CityShark II may be equipped with an embedded GPS receiver providing the time at start and at end of recording, as well as the site geographical coordinates Thanks to the new features 2) and 3), it is now also possible to use CityShark II as an earthquake recording device;
4) CityShark II may be equipped with a remote triggering device. This option proves very useful to get synchronous records in large array experiment or on large structures such as bridges (over 100 - 200 m) for which the use of cables might be a constraint. The remote start is triggered with a 0.5- or 5-watt radio transmitter;
5) When interrupting a recording before its programmed end, the operator has the choice to either save the recorded data or to delete them, a convenient option to operate CityShark II for short experiments of unknown duration.
2.2. Other New Features
Several convenient features have been added or changed from the original CityShark configuration: 1) the sample frequency range has been extended to 18 selectable rates in the 10 - 1000 sps range; 2) display of actual battery voltage and choice of low-battery voltage cut-off; 3) automatic detection of faulty or unusable flash card; 4) programmable recording start; and 5) programmed repeating recording time in minutes during the first hour. Data download software has been developed for other systems than MS-Windows (see section below).
Future station software updates are directly available on the LEAS website, and transferred to the station through the station flashcard reader.
3. CityShark II Performances
CityShark II timing is based on a 1.5 ppm TCXO crystal, working in the −20˚C - +70˚C range. The acquisition board comprises up to six modules of three 24-bit delta-sigma ADCs (one module per 3C-sensor), with input stage dynamics available at ±2.5 V or ±5 V. The dynamic range varies from 108 dB at 100 sps to 90 dB at 250 sps. 14 selectable amplifier gains are available, from 1 (0 dB) to 8192 (78 dB), by powers of two (6 dB).
3.1. Gain Values
A test performed on gains shows that up to 512 gain values are within 0.001% - 0.3% from their nominal values, and from −5% to −6 % in the 1024 - 8192 gain range, while variations throughout the 18 channels are less than 0.3% in the entire 1 - 8192 gain range. Voltage saturation does not produce any perturbation in the following recorded signal.
3.2. Internal Noise, Missing Code, Offsets and Anti-Aliasing Filter
Internal noise, missing code, and offsets were evaluated trough statistical tests, performed using histogram techniques (distributions of the number of count values, i.e. the number of times a count value is reached, versus count values). The tests were first performed by recording the signal obtained without any sensor connected to each of the 18 channels, with the entries not being short-circuited. In a second series of tests, a 1-kΩ resistor has been connected between the two signal pins (+ and −) of the 18 input channels. Recordings were performed at 100 sps in both cases.
The average internal noise level reaches a value of ±1/131072 counts (±19 µV) at gain 1 (Figure 2) and ±15/131072 counts (±0.035 µV) at gain 8192. This high signal-to-noise ratio permits CityShark II to record very low amplitude signals, allowing, for example, to get a 0.4 Hz H/V peak from a 4.5-Hz seismometer (Figure 3).
 (a)
(a)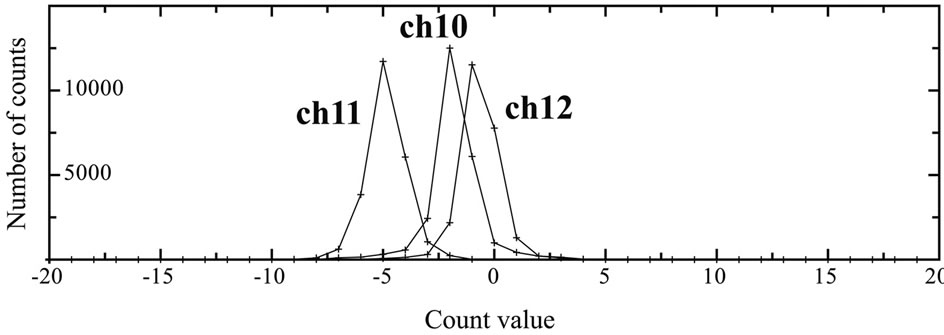 (b)
(b)
Figure 2. Examples of histograms of count values from recordings obtained without any sensor connected to CityShark II for channels 1-3 (top, (a)) and channels 10-12 (bottom, (b)). Recordings were made at 100 sps and gain 1. The internal noise obtained from the half width of the Gaussian curves has a value of 1. The curves are centered on the channel offset value, which reached a maximum of 15. No “missing code” is evidenced, as within each curve all count values are reached.
 (a)
(a)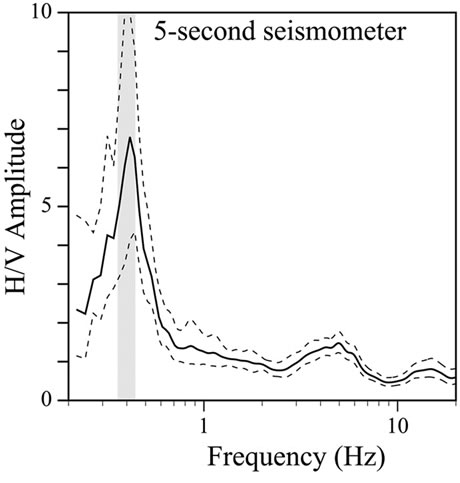 (b)
(b)
Figure 3. Comparison of H/V curves from ambient vibration recordings, with a 0.4 Hz peak, obtained with a 5- second Lennartz seismometer (left) and a Mark Products 4.5-Hz seismometer (right) on the same ground site. The very low level of internal noise of CityShark II results in a very high signal/noise ratio, which allows obtaining the same peak frequency value (0.4 Hz) with both the 4.5-Hz and the 5-second seismometer, even though it is way below the 4.5-Hz seismometer frequency cut-off. Understandably, though, the H/V amplitude of the peak is lower when using the 4.5-Hz seismometer.

Figure 4. Maximal count values from 2.5 Volts sine waveforms with frequencies in the 12.5 - 375 Hz range recorded at 125 sps at gain 1 using a 10 V dynamic range CityShark II, showing the behavior of the anti-aliasing filter.
These results also show that there is no missing code, as there is no “hole” in the number of count values, i.e. count values that are not reached within the distribution range, to the contrary of what is encountered with some other data acquisition systems [5].
Offsets are within ±15 counts (±275 µV) at gain 1 and ±13600 counts (±32 µV) at gain 8192.
The anti-aliasing filter has been tested by recording, at 125 sps, 2.5-Volt sine waveforms with frequencies varying from 12.5 Hz up to 375 Hz. To the contrary of what is observed for other recording devices, the CityShark II anti-aliasing filter works fine (Figure 4).
3.3. Synchronism in-between Channels
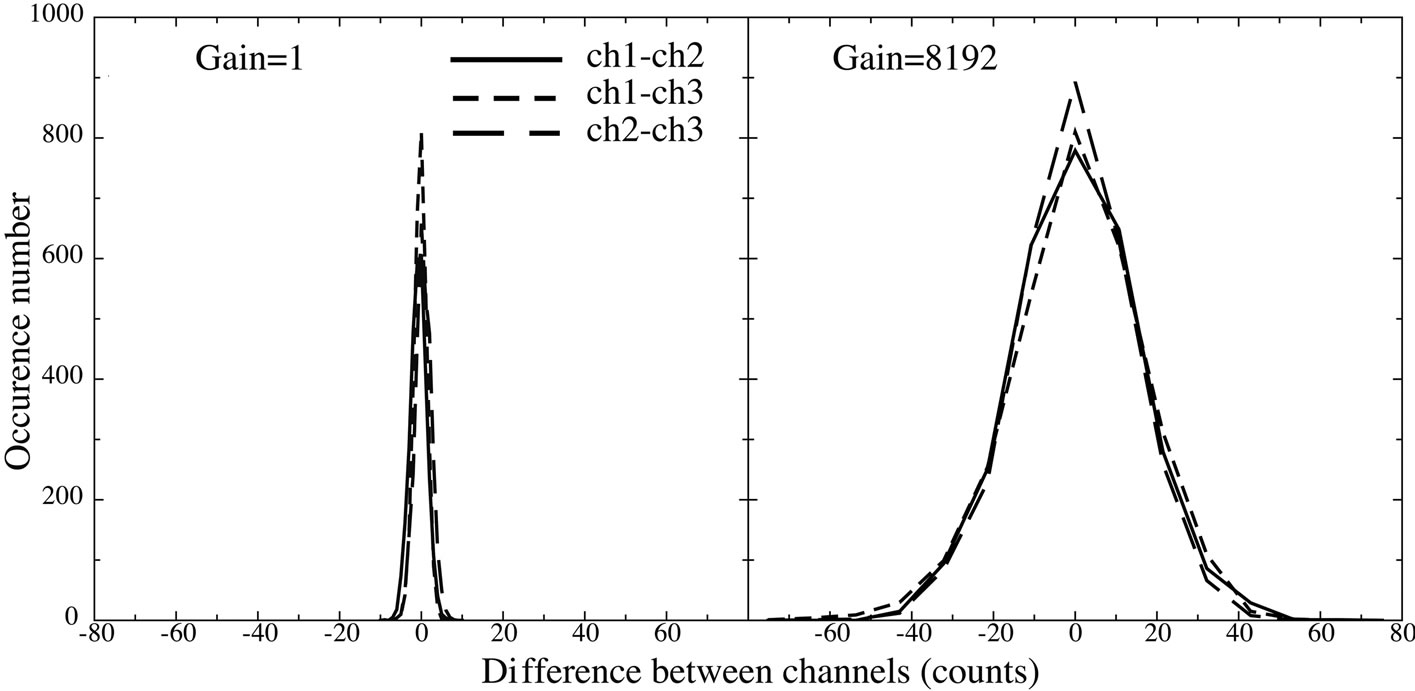
A simultaneous recording of the same 1 Hz triangleshape signal by all of the 18 CityShark II channels has been completed at 100 sps, using various gains. Then, in order to check their synchronism, the signal differences have been computed, after removing the trace offsets. As in the preceding test, results are shown as the distributions of the number of count values versus count values, which in this case should be Gaussian curves centered on zero, the deviations from zero being due to the combined effect of internal noise and the slight variations in gain value in-between channels. The results show a perfect synchronism between channels, as we indeed do obtain Gaussian curves centered on 0, without missing values (Figure 5). These curves also confirm that the combined effect of internal noise and gain variations in-between channels is negligible.
3.4. Synchronism in-between Stations Using Remote Triggering
The synchronism of recording start-up in-between several stations when using the remote triggering has been
 (a)
(a) (b)
(b)
Figure 5. Examples of test of the synchronism in-between the 18 CityShark II channels. The same 1 Hz triangle is sent simultaneously on the 18 channels at 100 sps. The top of the figure ((a) and (b)) shows the differences in-between channels of the same acquisition board (channels 2 to 3), at gain 1 (a) and 8192 (b). The bottom of the figure ((c) and (d)) shows the differences in-between channels of different acquisition boards (channels 1, 7 and 18), at gain 1 (c) and 8192 (d). The only differrences come from the slight gain variations from one channel to another, evidenced by the differences of the top values of the Gaussian curves.
evaluated by recording the logical level of seven station receivers on an oscilloscope in two series of four, with a reference station. The average delay is about 60 µs, with a maximum of about 125 µs (Figure 6).
4. Operating CityShark II
4.1. Recording Data
CityShark II works in a similar way to CityShark. Parameters and internal time settings are adjusted on the station itself, without connecting an external computer to the station, with the help of two press-buttons labeled “gain up” and “gain down”. Basically, only three recording parameters have to be adjusted: gain, sample rate, and recording duration. Optional parameters can be setup: the maximum percentage of clipped samples allowed during a record, a period of repeated recording, and overwriting the default file index used in the data file. The signal level is indicated by a bar graph on the builtin screen. For a more detailed description of operating CityShark, and on the way it works, see [1].
4.2. Retrieving Data
CityShark II stores recorded data on a removable memory flash card, with storage capacity ranging from 32 MB to 2 GB. The flash card must be formatted and prepared on an external computer before its first operation. Once the data have been recorded, the flash card is read on a PC using ReadCity, software developed specifically to handle the CityShark data format for MS-Windows (Figure 7), Linux and Mac OSX systems. In the CityShark II station, data records are written on the flash card into a single large binary file, each record including a small header containing all relevant parameters. Read-

Figure 6. Example of starting time delays from 7 CityShark II-1 when using the remote triggering. Starting time is indicated by a downward step.

Figure 7. ReadCity screen under MS-Windows system. ReadCity shall be used to download CityShark data from a flash card, and to erase data.
City allows to select some or all of these records, and to download them to the PC as ASCII files in a spreadsheet-ready format (Figure 8) or as binary files, at the operator convenience. After downloading in ASCII format it is possible to include any commentaries in the header, as long as they are added in-between the first and last line of the actual header. After saving the data, ReadCity can prepare the flash card for a new recording session by erasing all records and initializing the flash card header. Data are however not physically erased from the card, and a ReadCity option allows to retrieve them in the case of a mistakenly erasure, as long as no new record has been performed. Data analysis can be performed with standard scientific software or ambient vibration processing dedicated software such as the open source geopsy software (www.geopsy.org). Alternatively, data files can be directly downloaded into the seismic SAC format, thus allowing using the large library of seismic software based on this format.
4.3. Results
CityShark II has been successfully used in various types

Figure 8. Example of a 3-channel CityShark II data file retrieved using ReadCity. The original file name is transformed by adding the year, obtained from the internal date of the computer with which the data is retrieved, and hour minute are separated from the rest of the name by an underscore. File name may also include sensor number (1 to 6) when recording several sensors (e.g. Capt_1_050430_1612.001, and/ or the station serial number (e.g. 050430_1612.001_001.001, Capt_1_050430_1612.001_001.001); the latter should be used when recording from several stations with the same time set. The conversion factor is the value by which following data, in counts, should be divided to get data in Volts at gain 1. This value should be divided by the gain for gain values over 1. Dynamic range is the full dynamic range (e.g. 5 Volts for ±2.5 Volts). Maximum amplitude is the maximum absolute count value reached by the data. Other header parameters are self-explanatory. Commentaries may be included in the header in-between the first and last line, which must not be changed. Data are listed as a sample per line, in counts, in the Z, N-E, E-W order, i.e. signal from the A-B, C-D, and E-F input connector pins respectively.
of ambient vibration studies: buildings (Figure 9 and [6- 11]), arrays (Figure 10 and [12-15]), landslides [15] and single-station (H/V) (Figure 3 and [16-22]).
5. Conclusions
CityShark II is a very user-friendly instrument specially designed to meet a wide range of ambient vibration recording applications such as single-station, array or building studies, or any kind of low voltage signal, avoiding all unnecessary recording parameters that are part of operating a station devoted to earthquake recording. Portability of the station is assured through the station light-weight and its independence from external devices, i.e. external battery and computer. It is very easy to use by a non-specia-

Figure 9. Example of determination of the transversal and longitudinal vibration modes of a 28-storey building from ambient vibrations simultaneously recorded with a CityShark II-6 station using five 4.5-Hz sensors (left). The fundamental frequency and the 1st harmonic are clearly showing up. Higher modes need a zoom of the figure to show up. The first 3 modes of longitudinal deformations (right).
 (a) (b)
Figure 10. Example of result from a 8-sensor array ambient noise recording. Two one-channel and one six-channel CityShark II were used, with remote triggering. The seismic shear-wave velocity model (right) is obtained from the Rayleigh wave dispersion curve (left).
list. Synchronous data acquisition for large size array or structure ambient vibration studies is made easy by using remote triggering, or post-synchronization during data processing when using GPS time.
With the continuous recording and GPS options CityShark II can also be used for earthquake recording operations.
Statistical tests, performed using histogram techniques, used to evaluate gain variations, offsets, absence of missing code, internal noise level, remote triggering and in-between channels synchronism proved CityShark II to be a very reliable data acquisition system.
The data software package, provided with the station, allows to format the flash card and retrieve data in ASCII spreadsheet-ready format, in an easy and time-effective way producing very easy to handle data files, or directly in Sac format. The software runs under the most common systems (MS-Windows, Linux, Mac OSX).
Finally, while mostly used in the framework of ambient vibration studies, CityShark II can handle any kind of low voltage signal.
6. Acknowledgements
We had fruitful discussions with P.-Y. Bard, M. Wathelet, F. Dunand and S. Bonnefoy-Claudet, who also helped to test Cityshark II through its validation process. This project has been funded by IRD (Institut de Recherche pour le Développement), a French public research institute, and LEAS company. Save public research.
REFERENCES
- J.-L. Chatelain, P. Guéguen, B. Guillier, J. Fréchet, F. Bondoux, J. Sarrault, P. Sulpice and J.-M. Neuville, “CityShark: A User-Friendly Instrument Dedicated to Ambient Noise (Microtremor) Recording for Site and Building Response Studies,” Seismological Research Letters, Vol. 71, No. 6, 2000, pp. 698-703. doi:10.1785/gssrl.71.6.698
- B. Guillier, K. Atakan, A.-M. Duval, M. Ohrnberger, R. Azzara, F. Cara, J. Havskov, G. Alguacil, P. Teves-Costa, N. Theodulidis and The SESAME Project WP02-Team, “Influence of Instruments on the H/V Spectral Ratios of Ambient Vibrations,” XXVIII General Assembly of the European Seismological Commission (ESC), Genova, 1-6 September 2002, p. 273.
- B. Guillier, K. Atakan, J.-L. Chatelain, J. Havskov, M. Ohrnberger, F. Cara, A.-M. Duval, S. Zacharopoulos, P. Teves-Costa and the SESAME Team, “Influence of Instruments on the H/V Spectral Ratios of Ambient Vibrations,” Bulletin of Earthquake Engineering, Vol. 6, No. 1, 2008, pp. 3-31. doi:10.1007/s10518-007-9039-0
- SESAME, “Site Effects Assessment Using AMbient Excitations,” European Commission—Research General Directorate, Project No. EVG1-CT-2000-00026 SESAME, Report D01.02, 2002. http://sesame-fp5.obs.ujf-grenoble.fr
- R. Pillet, “Missing Code et Filtre Anti-Aliasing de Deux Acquisitions Numériques,” 2002. https://www-geoazur.unice.fr/PERSO/pillet/page-mcfaa2an.html
- C. Michel, P. Guéguen and P.-Y. Bard, “Dynamic Parameters of Structures Extracted from Ambient Vibration Measurements: An Aid for the Seismic Vulnerability Assessment of Existing Buildings in Moderate Seismic Hazard Régions,” Soil Dynamics and Earthquake Engineering, Vol. 28, No. 8, 2008, pp. 593-604. doi:10.1016/j.soildyn.2007.10.002
- M. N. Farsi, B. Guillier, J.-L. Chatelain and S. Zermout, “Retrofitting and Strengthening Evaluation from Stiffness Variations of a Damaged Building from Ambient Vibration Recordings,” In: M. Mucciarelli, et al., Eds., Increasing Seismic Safety by Combining Engineering, Springer Sciences, The Netherlands, 2009, pp. 227-238.
- C. Michel, P. Guéguen, S. El Arem, J. Mazars and P. Kotronis, “Full Scale Dynamic Response of a RC Building under Weak Seismic Motions Using Earthquake Recordings, Ambient Vibrations and Modelling,” Earthquake Engineering and Structural Dynamics, Vol. 39, No. 4, 2010, pp. 419-441. doi:10.1002/eqe.948
- P. Guéguen, “Experimental Analysis of the Seismic Response of an Isolating Building according to Different Levels of Shaking: Example of the Martinique Earthquake (2007/11/29) Mw 7.3,” Bulletin of Earthquake Engineering, Vol. 10, No. 4, 2012, pp. 1285-1298. doi:10.1007/s10518-012-9355-x
- F. Dunand, P. Guéguen, “Comparison between Seismic and Domestic Risk in Moderate Seismic Hazard Prone Region: The Grenoble City (France) Test Site,” Natural Hazards and Earth System Sciences, Vol. 12, No. 2, 2012, pp. 511-526. doi:10.5194/nhess-12-511-2012
- C. Michel, P. Guéguen and M. Causse, “Seismic Vulnerability Assessment to Slight Damage Based on Experimental Modal Parameters,” Earthquake Engineering and Structural Dynamics, Vol. 41, No. 1, 2012, pp. 81-98. doi:10.1002/eqe.1119
- B. Guillier, J.-L. Chatelain, M. Hellel, D. Machane, N. Mezouer, R. Ben Salem and E.-H. Oubaiche, “Smooth Bumps in H/V Curves over a Broad Area from Single-Station Ambient Noise Recordings Are Meaningful and Reveal the Importance of Q in Array Processing: The Boumerdes (Algeria) Case,” Geophysical Research Letters, Vol. 32, No. 24, 2005, 4 p. doi:10.1029/2005GL023726
- M. Hellel, J.-L. Chatelain, B. Guillier, D. Machane, R. Ben Salem, E. H. Oubaiche and H. Haddoum, “Heavier Damages without Site Effects and Site Effects with Lighter Damages: Boumerdes City (Algeria) after the may 2003 Earthquake,” Seismological Research Letters, Vol. 81, No. 1, 2010, pp. 37-43. doi:10.1785/gssrl.81.1.37
- M. Hellel, E. H. Oubaiche, J.-L. Chatelain, D. Machane, R. B. Salem, B. Guillier, G. Cheiklounis, “Basement Mapping with Single-Station and Array Ambient Vibration Data: Delineating Faults under Boumerdes City (Algeria),” Seismological Research Letters, Vol. 83, No. 5, 2012, pp. 798-805. doi: 10.1785/0220110142
- P. Lacroix, M. Wathelet, L. Tatard, B. Guillier, F. Bondoux, J. Marino, E. Taipe, B. Zavala, P. Valderrama, L. Fidel, J.-C. Gomez and E. Norabuena, “Caracterización de los Procesos Sismicos y Gravitacionales Sobre el Deslizamiento de Maca (Colca, Peru),” XVI Congreso Peruano de Geologia & SEG, Lima, 2012.
- P. Guéguen, J.-L. Chatelain, B. Guillier, H. Yepes and J. Egred, “Site Effect and Damage Distribution in Pujili (Ecuador) after the 28 March 1996 Earthquake,” Soil Dynamics and Earthquake Engineering, Vol. 17, No. 5, 1998, pp. 329-334. doi:10.1016/S0267-7261(98)00019-0
- P. Guéguen, J.-L. Chatelain, B. Guillier and H. Yepes, “An Indication of the Soil Topmost Layer Response in Quito (Ecuador) Using H/V Spectral Ratio,” Soil Dynamics and Earthquake Engineering, Vol. 19, No. 2, 2000, pp. 127-133. doi:10.1016/S0267-7261(99)00035-4
- A. A. Panou, N. Theodulidis, P. Hatzidimitriou, K. Stylianidis and C. B. Papazachos, “Ambient Noise Horizontal-to-Vertical Spectral Ratio in Site Effects Estimation and Correlation with Seismic Damage Distribution in Urban Environment: The Case of the City of Thessaloniki (Northern Greece),” Soil Dynamics and Earthquake Engineering, Vol. 25, No. 4, 2005, pp. 261-274. doi:10.1016/j.soildyn.2005.02.004
- B. Guillier, J.-L. Chatelain, S. Bonnefoy-Claudet and E. Haghshenas, “Use of Ambient Noise: From Spectral Amplitude Variability to H/V Stability,” Journal of Earthquake Engineering, Vol. 11, No. 6, 2007, pp. 925-942. doi:10.1080/13632460701457249
- J.-L. Chatelain, B. Guillier and I. A. Parvez, “False Site Effects: The Anjar Case, Following the 2001 Bhuj (India) Earthquake,” Seismological Research Letters, Vol. 79, No. 6, 2009, pp. 816-819. doi:10.1785/gssrl.79.6.816
- R. Ben Salem, J.-L. Chatelain, D. Machane, E. H. Oubaiche, M. Hellel, B. Guillier, M. Djeddi and L. Djadia, “Ambient Vibration Techniques Applied to Explain Heavy Damages Caused in Corso (Algeria) by the 2003 Boumerdes Earthquake: Understanding Seismic Amplifications Due to Gentle Slopes,” Seismological Research Letters, Vol. 81, No. 6, 2010, pp. 928-940. doi:10.1785/gssrl.81.6.928
- E. H. Oubaiche, J.-L. Chatelain, A. Bouguern, R. Ben Salem, D. Machane, M. Hellel, F. Khaldaoui and B. Guillier, “Experimental Relationship between Ambient Vibration H/V Peak Amplitude and Shear-Wave Velocity Contrast,” Seismological Research Letters, Vol. 83, No. 6, 2012, pp. 1038-1046.