International Journal of Medical Physics, Clinical Engineering and Radiation Oncology
Vol. 1 No. 2 (2012) , Article ID: 21717 , 9 pages DOI:10.4236/ijmpcero.2012.12004
Planning Margins to CTV for Image-Guided Whole Pelvis Prostate Cancer Intensity-Modulated Radiotherapy
1Department of Radiation Oncology, University of Miami, Miami, USA
2Department of Radiation Oncology, University of Maryland, Baltimore, USA
3Department of Radiation Oncology, University of Southern California, Los Angeles, USA
Email: zdwang@gmail.com
Received April 23, 2012; revised June 2, 2012; accepted June 30, 2012
Keywords: Prostate Cancer; Whole Pelvis; Image Guidance; IMRT; Margin; Alignment
ABSTRACT
Purpose: We investigated the margin recipes with different alignment techniques in the image-guided intensity-modulated radiotherapy (IMRT) of whole pelvis prostate cancer patients. Materials and Methods: Forty-eight computed tomography (CT) scans of eight prostate cancer patients were investigated. Each patient had an initial planning CT scan and 5 consecutive serial CT scans during the course of treatment, all of which were acquired using 3 mm slice separation and 0.94 mm resolution in the axial plane at 120 kVp, on a PQ 5000 CT scanner. Three different whole pelvis planning margin recipes, ranging from 3 to 13 mm, were investigated. A unique IMRT plan was created with each PTV on the initial CT scan, and was then registered to the 5 serial CT scans, by bony alignment or by prostate gland-based alignment. The dose computed on each serial CT scans was accumulated back to the initial CT scan using deformable image registration for final dosimetric evaluation of the interplay of the margin selection and alignment methods. Results: Elective lymph nodes coverage is shown to be independent of the choice between prostate-based and bony-anatomy-based patient repositioning. The prostate gland-based alignment greatly enhanced the coverage to the prostate and SV, especially with small margins. Meanwhile, the soft-tissue alignment also raised the incidental dose to the rectum and reduces the dose to the bladder. With small to intermediate margins, only soft-tissue alignment gave acceptable mean coverage to SV. Margin of 13 mm or more was needed for PLNs to maintain good target coverage. Conclusions: We commend prostate-based alignment along with margins less than or equal to 5 mm around prostate and SV, and margins greater than or equal to 13 mm around the vascular spaces.
1. Introduction
The advantages of treating whole pelvis prior to prostate-only irradiation have been widely recognized for locally advanced or aggressive prostate adenocarcinoma [1-6]. Intensity-modulated radiotherapy (IMRT) of whole pelvis for prostate cancer patients [7-13] treats the gross disease in the prostate gland as well as suspected involvement of the distal seminal vesicles (SV) and pelvic lymphatic nodes (PLNs) [7-10,13], while minimizing doses to rectum, bladder, bowel and surrounding normal tissues. The employment of pre-treatment in-room KV imaging systems, such as cone-beam computed tomography (CBCT), has gained their increasing popularity over the years in image-guided prostate IMRT. Under image guidance, setup uncertainty is greatly reduced by patient repositioning prior to delivery of each fraction [14,15]. According to ICRU 50 and 62, the planning target volume (PTV) is an expansion of the clinic target volume (CTV), as:
 (1)
(1)
where σ is the standard deviation of setup uncertainty
(a 2σ margin ensures a 95% confidential level); and ε is the internal margin contributed by organ motion during a given treatment. A more recent work present by Zhang et al. [16] moves forward in this area, which provides different margin formulas between conventional fractionated treatment and single-fraction treatment. Here in our study we investigate setup uncertainty in case of conventional fractionated treatment. As shown in the literatures [7-10], margins for PTV in image-guided whole pelvis prostate IMRT vary from 2 - 15 mm depending on the setup technique. It should be noted that we focus on image-guidance for setup uncertainty correction in our study, and therefore real time tracking for intrafraction motion correction is not included.
The prevalent image-guided technique for prostate only radiotherapy uses the gland for the alignment. On the other hand, image-guided whole pelvis prostate cancer IMRT, unlike the prostate only treatment, needs to align the whole pelvis area including the PLNs. Aligning the prostate gland and the PLNs simultaneously in registration normally runs into great dilemma. The interfraction uncertainty of prostate, SV, bladder and rectum has been intensively studied [17-20], and it has been shown to be large. Meanwhile, the PLNs are not well shown in kV images and their interfraction uncertainty is independent of that from prostate. This adds complexity to the repositioning and has resulted in debates among the clinicians about the choice of the margins for PTV along with the alignment technique. Advocates of aligning whole pelvis IMRT to the prostate [9] hypothesize that under image guidance, it is most beneficial to minimize target under-dosing in the prostate with a lesser emphasis in the elective LN volumes. On the other hand, advocates of bony alignment [8,10] support the notion that the LN are most closely related to the pelvic bony anatomy and hence recommend localization of the pelvic rim. In this case, an extra margin for prostate and SV will naturally result to maintain the dose coverage since registration referenced to bony anatomy alone would be inaccurate and insufficient for target.
As a result of the above debate, the PTV margins around the prostate and SV have a wide range in the literatures, as shown in Table 1 small margins (2 - 5 mm) with daily prostate-based alignment, or much larger margins (7 - 10 mm) due to bony-anatomy-based alignment. In all cases, large margin (10 - 15 mm) is employed around the vascular bundle spaces where LN involvement is suspected since direct detection is difficult for suspected clinical involvement of the lymphatics. It should be emphasized here that introduction of extra margin should always be avoided as long as a proper fusion procedure can be achieved. We examine all margin receipts including bony-anatomy-based alignment here for a complete investigation.
Image-guided technique has considerable advantages in radiotherapy. And the benefits of image-guided whole pelvis IMRT can be maximized by using the optimal PTV margin receipt. The scope of this work is to search for the minimum margin which maintains target coverage to prostate, SV and PLNs. As a result, the incidental doses to rectum and bladder will be minimized. Dosimetric evaluation of different margin selections under their alignment methods are carried out using a planning CT scan and a series of consecutive CT scans similar to planning CT at different days. The serial CT scans is contoured and aligned to the planning CT (similar to the image guidance CBCTs during treatment) while dose of original plan is generated on the aligned serial CT. All the doses on serial CTs are then transferred back to planning CT using a model-based deformable registration [21], where a final dose summation and evaluation is performed.
2. Materials and Methods
Twenty patients with early-stage localized prostate carcinoma were randomized prospectively at University of Maryland Medical System (UMMS) to receive definitive prostate cancer IMRT in the supine or prone positions. During the study, the patients underwent 10 to 11 serial CT scans in non-consecutive days [15,22]. The CT scans were acquired using a 3 mm slice separation and 0.94 mm resolution in the axial plane at 120 kVp, on a PQ 5000 CT scanner (Picker Medical, Cleveland Ohio). Unrelated to the CT scanning portion of the protocol, all patients were treated with a prescribed external beam radiation therapy (EBRT) course of 70.2 Gy in 39 fractions, at 1.8 Gy per fraction. Images acquired for patients in the prone position are reported in a separate study comparing the supine and prone positions under image guidance [15]. A report on the role of patient repositioning and online planning of localized prostate IMRT based on the supine patient CT images is given in [22].
Eight out of these twenty patients were qualified for image-guided whole-pelvis IMRT study. We took six consecutive CT scans from each of the eight patients in the supine position, resulting total 48 CT scans for the investigation. The initial CT scan of each patient was used for IMRT planning, and the subsequent 5 subsequent serial scans were used as would be different treatment fractions. A virtual simulation workstation (Voxel Q—Philips Medical, Milpitas CA) was used to contour the prostate, SV, elective lymphatic spaces, rectum and

Table 1. Different planning strategies for whole-pelvis prostate IMRT.
bladder on each CT scan. All contours were made by one physician in order to eliminate inter-observer uncertainties. Elective lymphatic spaces are defined from expansions of the vascular bundles as seen from CT, since direct detection is difficult for suspected clinical involvement of the lymphatics. Alexander et al. [23] showed that an expansion of 7 to 10 mm around the vascular spaces is required to represent 80% - 90% of all LN involvement (CTV). We refer to the vascular space contours on CT as LN from here on, the vascular spaces with a 7-mm expansion as LN7mm, and a more conservative estimate with a 10-mm expansion as LN10mm. It is imperative to point out that these expansions were used solely to identify the possible lymphatics volume and thus different than the margin expansion used for PTV. The expanded LN for PTV is named the LN portion of the PTV in our work. All the images and contours were transferred to Pinnacle 8.1x radiation treatment planning system (RTPS) by Philips Medical, Milpitas CA. The prostate, SV and the adjacent pelvic vascular bundle of LN contours were used to create a CTV for the whole pelvis treatment planning. Therefore, our CTV contours contained the prostate gland and intracapsular suspected foci of disease, as well as suspected involvement of the SV and vascular bundle spaces. Our CTV did not account for intrafractional motion or contouring uncertainties.
The CTV was expanded into a PTV following one of the three margin receipts as shown in Table 1. The first receipt expanded 3 mm isotropically about the prostate and SV, and 10 mm around the vascular spaces, as practiced by the group of UCSF [7]. With the second receipt the prostate and SV were expanded by 5 mm in the superior-inferior, left-right and anterior direction and 3 mm posteriorly, and 10 mm isotropically around the vascular bundle spaces. This recipe followed the work of Pollack et al. [8] at Foxchase comprehensive cancer center (FCCC), where hypofractionated radiotherapy of intermediate risk prostate cancer patients was delivered under image guidance. The third receipt was practiced at UMMS, in which the prostate and SV were expanded by 10 mm in all directions except the posterior direction of 7 mm margin. Vascular spaces were expanded isotropically by 12.5 - 15 mm in UMMS with variations from patient to patient. We used an expansion of 13 mm around LN for the third margin receipt.
With each of the above three PTV margin receipts, aunique whole pelvis IMRT plan was created on the planning CT, resulting three independent initial plans on the planning CT of each patient. These IMRT plans aimed to deliver a total therapeutic dose of 45 Gy to the prostate, SV and LN at 1.8 Gy per fraction. The plans were constructed from seven 6 MV beams, using a clinically commissioned model of a 21EX Varian LINAC with a 120-leaf MLC (Varian Medical Systems, Palo Alto, CA). The beams were coplanar in the axial plane, at 0˚, 50˚, 100˚, 150˚, 210˚, 260˚ and 310˚ degrees. Each beam was optimized using direct machine parameter optimization (DMPO) in Pinnacle 8.1x, where stepand-shoot MLC (SMLC) instructions for the beam were generated. The plans were computed via adaptive convolution with dose deposition to tissue.
The three IMRT plans on the planning CT were weighted so that at least 95% of the PTV was covered by 95% of the prescription dose of 180 cGy per fraction. Typical IMRT planning constraints that were used in our study are detailed in Table 2. A union of prostate expansion and SV expansion is called PSV here. The constraints to PSV included two minimum doses of 181 and 182 cGy in order to maximize its coverage. We also created tissue contours with the whole skin contours excluding the 1 cm expansion of the PTV (PSV + PLN expansion). In this way, dose to small bowel, femur head, and soft tissues were controlled by the constraint that limited max dose of 126 cGy to the tissue. At the end of optimization, all the three original plans were normalized such that 99% of PTV volume was covered by 95% of the prescription dose.
Image-guided whole pelvis IMRT dose summation and evaluation were simulated through the following three steps.
The first step is the simulation of image-guided registration. In this step, each of subsequent 5 serial CT scans was individually aligned to the planning CT in Pinnacle software. For bony alignment, a cross-Correlation 3Dimage registration package by Pinnacle 8.1x was used to match pelvis bony anatomy between the serial CT and the planning CT. Both three-dimensional translation and

Table 2. IMRT optimization parameters for a prescription dose of 1.8 Gy per fraction.
rotation generally resulted for bony alignment in our study, which closely follows the steps of actual treatment setups. An extra step was then performed for soft-tissue alignment. Our patients did not have fiducial markers implanted in the prostate, therefore the centroid of the prostate on each serial CT scan was carefully matched to that on the planning CT after the bony alignment procedure. This extra step only produced translational shift. The magnitude of centroid shift and the justification of using centroid to align prostate in our study are discussed in detail in Section 3.3.
The second step is the simulation of plan delivery. In this step, the planning parameters (such as beam angle, MLC sequences and couch position) for each of the three initial IMRT plans were copied and transferred from the planning CT to the 5 serial CTs after their corresponding registrations as described above completed. Dose computations were thereafter carried out on the serial CTs using these transferred planning parameters. Importantly, the difference of the resulting new dose distribution from the original at planning CT is a plain demonstration of setup uncertainties.
The third step is the evaluation of the total delivered dose using different planning strategies including margins and alignment under the circumstances of setup uncertainties. In this step, dose summation and evaluation were gathered using registration method described by Kaus et al. [21], which is a surface-based deformable image registration strategy that enables quantitative description of geometrical change in multimodal images. This model-based method uses existing contours sets in both primary and secondary image sets and copes with image differences based on changes in the representation of the same organs. The registration strategy was implemented in Pinnacle 8.1x, which had been evaluated and used in our earlier work [22]. The deformation matrix that mapped the serial CT images back to the planning CT images was obtained using the corresponding contour sets on both CTs, which were contoured by the same physician. This deformation matrix was then used to map the new dose distributions on the serial CT back to the planning CT. The dosimetric impact of each image-guided whole pelvis IMRT strategy was then evaluated by summing up the equally-weighted deformed doses on the planning CT from all serial CTs.
Dose-volume histograms (DVHs) from the final accumulated dose through deformable registration generated dose indices for our comparisons between different plan strategies in this study. The percent volume of the prostate receiving 95% of the prescribed dose or more, or V95, was used for the target DVH index. The fractional volumes that receive minimum 75% and minimum 90% of the prescription dose, or V75 and V90, were used for critical organ DVH indices.
Paired t-test [24] was used to evaluate the statistical significance in the differences of the two seemingly opposite strategies from UCSF and UMMS. The results are illustrated by P value [24] here. A P value of 0.05 means the difference is considered to be statistically insignificant; vice versa.
3. Results and Discussion
3.1. Results
Figure 1 demonstrates the outcome differences from all six combinations of the margin selections and alignment strategies as shown in Table 1. Using bar graph, it compares the average V95 of the prostate, SV and PLNs (adjacent vascular bundles with 7 mm or 10 mm expansion), as well as V75 of rectum and V90 of bladder. The results were averaged over all 8 patients. As discussed earlier, the expansions of 7 mm and 10 mm around the vascular spaces are used here solely to identify the possible lymphatics volume and thus different than the margin expansion used for PTV.
Figure 2 shows the isodose overlays of dose accumulation from two seemingly opposite strategies. The isodose lines shown here are the accumulated using deformable dose registration. The left column are doses resulting from UCSF strategy (small margin + prostate alignment), and the right column are doses from UMMS strategy (large margin + bony alignment). Comparisons of the two planning strategies are made in the axial, sagittal and coronal planes.
Figure 3 compares the DVHs of the same patient using UCSF and UMMS strategies, after the deformable dose accumulation. The solid and dashed lines are for UCSF and UMMS strategies, respectively. And Red, magenta, maroon, green and brown represent the prostate, SV, LN10mm bladder and rectum DVHs.
Table 3 focuses on the comparison of the alignment techniques within each margin receipts. It describes the dose differences between the prostate alignment and bony alignment methods as well as their corresponding statistical significance. The doses within the same strategy present in this table were averaged over all patients in the study. Paired t-test was performed for the evaluation of the statistical significance and the resulting P values are also listed.
Table 4 focuses on the comparison of between UCSF and UMMS strategies. Therefore it reveals the outcome differences between the outcome between small margin with prostate alignment and large margin with bony alignment.
3.2. Discussion
It is apparent that the both the target coverage and incidental doses to OARs increase with larger margins in all six cases as seen in Figure 1. More importantly, Figure 1 reveals that the two different alignment methods under all margin receipts give very similar pelvic LN coverage, with either 7 mm (LN10mm) or 10 mm (LN10mm) expansion to identify of the possible lymphatics volume. This leads to our conclusion that the determining factor for the pelvic LN dosimetric coverage is the margin selection rather than the alignment method. Figure 1 also suggests that prostate-based alignment can greatly enhance coverage to the prostate and SV. The enhancement is significant especially for small margins, and less obvious for large margins. Meanwhile, the prostate-based alignment raises the incidental dose to the rectum while reducing the dose to the bladder, for all the three planning margins.

Figure 1. Average fractional volume of the prostate V95, Seminal Vesicles V95, LN expanded by 7 mm and 10 mm V95, rectum V75 and bladder V90 over all patients’ scans. The blue and magenta bars in each category are for bony and prostate alignment, respectively. The prostate alignment is referred as CM (center of mass of the prostate) method.

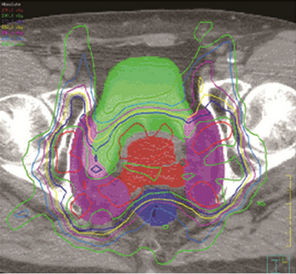

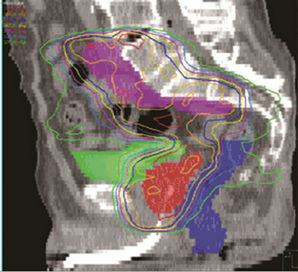

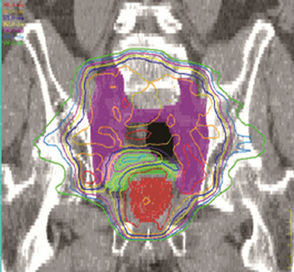
Figure 2. Left, UCSF (small margin around prostate); right, UMMS (large margin around prostate).

Figure 3. DVH of the same patient using UCSF (solid lines) and UMMS (dashed lines) strategies. Red, magenta, maroon, green and brown lines are for prostate, SV, LN10mm, bladder and rectum DVHs, respectively.
Table 3 demonstrates the statistical significance of the dose differences between the two alignment methods. In the case of using the same margin receipt, prostate alignment clearly reduces the bladder dose, which accounts for the only statistically significant dose difference in this table. In other words, there is no statistically significant difference in the doses to the prostate, SV, PLNs or rectum. Again it is confirmed here that the PLNs coverage is not dependent on the alignment method, which does not support the advocates of bony alignment [8,10]. The findings above evidently reveal that with same planning margins, the soft-tissue alignment is preferable in image-guided whole pelvis IMRT.
We now evaluate the combinations of margin receipts and alignment methods. Here we describe the target dose as an acceptable coverage only when its V95 is greater than 95%. From Figure 1 we observe that while all six scenarios resulted in acceptable mean coverage on the prostate, only the soft-tissue alignment gave acceptable mean coverage to SV with small to intermediate margins. Further investigation of each individual patient indicates that the prostate coverage was insufficient for small to intermediate margins with bony alignment. Therefore it is necessary to set up patient with prostate alignment when small margins to prostate are used.
As discussed in Section 2, an expansion of 7 to 10 mm (LN7mm-LN10mm) around the vascular spaces is required to represent 80% - 90% of all LN involvement (CTV) [23]. We observe from Figure 1 that the LN7mm coverage is acceptable with all six scenarios. However, only 13 mm expansion for LN portion of PTV can result in acceptable coverage for LN10mm. Thus it is indeed important to use margin greater than 10 mm for the LN portion of PTV to maintain good target coverage.
For better understanding of different strategies, we now focus on the two seeming opposite approaches: small margins with prostate alignment (UCSF strategy) and large margins with bony alignment (UMMS strategy). As shown in Figures 2 and 3, both strategies give good coverage to the prostate and SV. However, doses to the prostate and SV appear higher for UMMS. And the difference is statistically significant for prostate and otherwise for SV (Table 4). The statistically significant difference in the LN10mm coverage is mainly due to a larger margin used in UMMS strategy, and confirms that a margin greater than 10 mm for the LN portion of PTV is necessary to maintain good target coverage. Meanwhile, UCSF strategy results in smaller incidental irradiation to the bladder and rectum. And the difference is again statistically significant (Table 4).
The findings from the UCSF and UMMS strategies suggest that an optimal planning margin receipt should use prostate alignment to minimize the PTV expansion about the prostate and SV, and that the margin for the LN portion of PTV should be greater than 10 mm. Therefore we tested an “ideal” strategy from this hypothesis on 4 of the patients in this study. To do this test we created a fourth plan for each patient using the following margins. The prostate and SV were expanded following USCF. The vascular bundle spaces were expanded following UMMS. We use prostate alignment following UCSF. All of the dosimetric indices of the prostate, SV and LN10mm improved over the original UCSF strategy, while slightly worse than the UMMS strategy. Meanwhile the incident doses to the bladder and rectum were also between those with UCSF and UMMS strategies. This shows that it is not viable to maximize the benefits from both large and small margins, such as better target coverage and minimal dose to OARs, in the same plan when these margins coexist on the same superior-inferior anatomy of the patient.
3.3. Prostate Motion
We also examined the extent of interfraction prostate motion in our study. The centroid of the prostate on each serial CT scan was compared with its location on the planning scan of the same patient. All the 40 serial CT scans in our study were used for this investigation. The average prostate motion was 0.3 mm, 2.2 mm and 0.9 mm in left-right, anterior-posterior (AP) and superior-inferior direction, respectively. The corresponding standard deviation was 1.7, 3.7 and 3.8. The largest motion was found to be 8.8 mm in AP direction. And 33 of the 40 serial scans exhibited a prostate motion towards posterior direction. This finding is consistent with a decrease in rectum volume during radiotherapy, which results in the posterior movement of both prostate and rectum volume exposed to the irradiation.

Table 3. Statistical differences between the bony and prostate alignments for doses to prostate, SV, LN, bladder and rectum are evaluated using paired t-test.
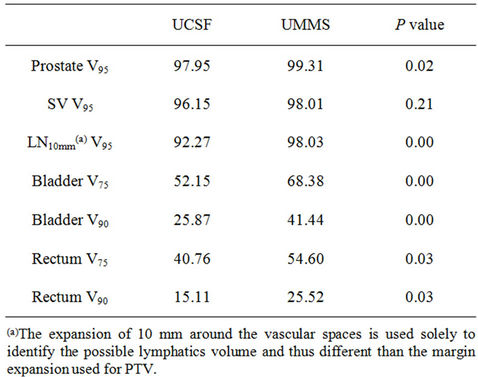
Table 4. Statistical differences between UCSF (Small margin + Prostate alignment) and UMMS (Larger margin + Bony alignment) strategies for doses to prostate, SV, LN, bladder and rectum are evaluated using paired t-test.
Finally, we go back to the discussion of our alignment of prostate using only centroid. As clearly shown in our results, there is no major dose difference from centroid alignment method to marker alignment due to three reasons: (a) the prostate and SV already got sufficient coverage even with the smallest margin with centroid alignment; (b) the LN coverage is independent of the alignment method, which is one of our main findings; and (c) the extra rotational shift brought about by marker alignment is random at each fraction and thus lead to a minimum accumulative dosimetric difference to the nearby critical structures.
4. Conclusion
Elective lymph nodes coverage is shown to be independent of the choice between prostate-based and bony-anatomy-based patient repositioning. The coverage of pelvic lymph nodes is closely related with its margin selection, due to the high uncertainties of LNs deformability. In contrast, prostate and seminal vesicles dose coverage are significantly improved under prostate based alignment. With bony alignment, margins smaller than 10 mm around the prostate and SV lead to unacceptable coverage. Small planning margins around the prostate and seminal vesicles are ideally combined with prostate-based alignment and large margins are suitable when bony-anatomy based alignment is used. The former strategy minimizes bladder volumes receiving over 75 % of the prescription dose. Therefore, to a 95% confidential level, we recommend prostate-based alignment along with margins less than or equal to 5 mm around prostate and seminal vesicles, and margins greater than or equal to 13 mm around the PLNs (adjacent vascular spaces).
REFERENCES
- M. A. Bagshaw, D. A. Pistenma, G. R. Ray, et al., “Evaluation of Extended-Field Radiotherapy for Prostatic Neoplasm: 1976 Progress Report,” Cancer Treatment Reports, Vol. 61, No. 2, 1977, pp. 297-306.
- S. O. Asbell, J. M. Krall, M. V. Pilepich, et al., “Elective Pelvic Irradiation in Stage A2, B Carcinoma of the Prostate: Analysis of RTOG 77-06,” International Journal of Radiation Oncology, Biology and Physics, Vol. 15, No. 6, 1988, pp. 1307-1316. doi:10.1016/0360-3016(88)90225-8
- M. Roach III, M. DeSilvio, C. Lawton, V. Uhl, M. Machtay, M. J. Seider, M. Rotman, C. Jones, S. O. Asbell, R. K. Valicenti, S. Han, C. R. Thomas Jr. and W. S. Shipley, “Phase III Trial Comparing Whole-Pelvic versus Prostate-Only Radiotherapy and Neoadjuvant versus Adjuvant Combined Androgen Suppression: Radiation Therapy Oncology Group 9413,” Journal of Clinical Oncology, Vol. 21, No. 10, 2003, pp. 1904-1911. doi:10.1200/JCO.2003.05.004
- P. Pommier, S. Chabaud, J. L. Lagrange, et al., “Is There a Role for Pelvic Irradiation in Localized Prostate Adenocarcinoma? Preliminary Results of GETUG-01,” Journal of Clinical Oncology, Vol. 25, No. 34, 2007, pp. 5366-5373. doi:10.1200/JCO.2006.10.5171
- C. A. Lawton, DeSilvio M, Roach M III, et al., “An update of the Phase III Trial Comparing Whole Pelvic to Prostate Only Radiotherapy and Neoadjuvant to Adjuvant Total Androgen Suppression: Updated Analysis of RTOG 94-13, with Emphasis on Unexpected Hormone/Radiation Interactions,” International Journal of Radiation Oncology, Biology and Physics, Vol. 69, No. 3, 2007, pp. 646- 655. doi:10.1016/j.ijrobp.2007.04.003
- A. A. Aizer, J. B. Yu, A. M. McKeon, R. H. Decker, J. W. Colberg and R. E. Peschel, “Whole Pelvic Radiotherapy Versus Prostate Only Radiotherapy in the Management of Locally Advanced or Aggressive Prostate Adenocarcinoma,” International Journal of Radiation Oncology, Biology and Physics, Vol. 75, No. 5, 2009, pp. 1344-1349. doi:10.1016/j.ijrobp.2008.12.082
- H. T. Chung, P. Xia, L. W. Chan, E. Park-Somers and M. Roach III, “Dose Image-Guided Radiotherapy Improve Toxicity Profile in Whole Pelvic-Treated High-Risk Prostate Cancer? Comparison between IG-IMRT and IMRT,” International Journal of Radiation Oncology, Biology and Physics, Vol. 73, No. 1, 2008, pp. 53-60. doi:10.1016/j.ijrobp.2008.03.015
- A. Pollack, A. L. Hanlon, E. M. Horwitz, S. J. Feigenberg, A. A. Konski, B. Movsas, R. E. Greenberg, R. G. Uzzo, C.-M. C. Ma, S. W. McNeeley, M. K. Buyyounouski and R. A. Price Jr., “Dosimetry and Preliminary Acute Toxicity in the First 100 Men Treated for Prostate Cancer on a Randomized Hypofractionation Dose Escalation Trial,” International Journal of Radiation Oncology, Biology and Physics, Vol. 64, No. 2, 2006, pp. 518-526. doi:10.1016/j.ijrobp.2005.07.970
- A. Hsu, T. Pawlicki, G. Luxton, W. Hara and C. R. King, “A Study of Image-Guided Intensity-Modulated Radiotherapy with Fiducials for Localized Prostate Cancer Including Pelvic Lymph Nodes,” International Journal of Radiation Oncology, Biology and Physics, Vol. 68, No. 3, 2007, pp. 898-902. doi:10.1016/j.ijrobp.2007.02.030
- L. P. Muren, E. Wasbø, S. I. Helle, L. B. Hysing, A. Karlsdottir, O. H. Odland, H. Valen, R. Ekerold and D. C. Johannessen, “Intensity-Modulated Radiotherapy of Pelvic Lymph Nodes in Locally Advanced Prostate Cancer: Planning Procedures and Early Experiences,” International Journal of Radiation Oncology, Biology and Physics, Vol. 71, No. 4, 2008, pp. 1034-1041. doi:10.1016/j.ijrobp.2007.11.060
- G. Sanguineti, E. J. Endres, B. C. Parker, C. Bicquart, M. Little, G. Chen and J. Berilgen, “Acute Toxicity of Whole-Pelvis IMRT in 87 Patients with Localized Prostate Cancer,” Acta Oncologica, Vol. 47, No. 2, 2008, pp. 301-310. doi:10.1080/02841860701558849
- J. B. Ashman, M. J. Zelefsky, M. S. Hunt, S. A. Leibel, Z. Fuks, “Whole Pelvic Radiotherapy for Prostate Cancer Using 3D Conformal and Intensity-Modulated Radiotherapy,” International Journal of Radiation Oncology, Biology and Physics, Vol. 63, No. 3, 2005, pp. 765-771. doi:10.1016/j.ijrobp.2005.02.050
- L. W. Chan, P. Xia, A. R. Gottschalk, M. Akazawa, M. Scala, B. Pickett, I.-C. Hsu, J. Speight and M. Roach III, “Proposed Rectal Dose Constraints for Patients Undergoing Definitive Whole Pelvic Radiotherapy for Clinically Localized Prostate Cancer,” International Journal of Radiation Oncology, Biology and Physics, Vol. 72, No. 1, 2008, pp. 69-77. doi:10.1016/j.ijrobp.2007.12.045
- D. Schulze, J. Liang, D. Yan and T. Z. Zhang, “Comparison of Various Online IGRT Strategies: The Benefits of Online Treatment Plan Re-optimization,” Radiotherapy & Oncology, Vol. 90, No. 3, 2008, pp. 367-376. doi:10.1016/j.radonc.2008.08.012
- B. Liu, F. A. Lerma, S. Patel, P. Amin, Y. M. Feng, B. Y. Yi and C. Yu, “Dosimetric Effects of the Prone and Supine Positions on Image Guided Localized Prostate Cancer Radiotherapy,” Radiotherapy & Oncology, Vol. 88, No. 1, 2008, pp. 67-76. doi:10.1016/j.radonc.2007.11.034
- Q. Zhang, M. Chan, Y. Song and Burman, “Three Dimensional Expansion of Margins for Single-Fraction Treatments: Stereotactic Radiosurgery Brain Cases,” International Journal of Medical Physics, Clinical Engineering and Radiation Oncology, Vol. 1, No. 2, 2012, pp. 15-22.
- R. D. Crevoisier, A. D. Melancon, D. A. Kuban, A. K. Lee, R. M. Cheung, S. L. Tucker, R. J. Kudchadker, W. D. Newhauser, L. F. Zhang, R. Mohan and L. Dong, “Changes in the Pelvic Anatomy after an IMRT Treatment Fraction of Prostate Cancer,” International Journal of Radiation Oncology, Biology and Physics, Vol. 68, No. 5, 2007, pp. 1529-1536. doi:10.1016/j.ijrobp.2007.01.069
- K. C. Bylund, J. E. Bayouth, M. C. Smith, A. C. Hass, S. K. Bhatia and J. M. Buatti, “Analysis of Interfraction Prostate Motion Using Megavoltage Cone Beam Computed Tomography,” International Journal of Radiation Oncology, Biology and Physics, Vol. 72, No. 3, 2008, pp. 949-956. doi:10.1016/j.ijrobp.2008.07.002
- J. A. Antolak, I. I. Rosen, C. H. Childress, G. K. Zagars and A. Pollack, “Prostate Target Volume Variations during a Course of Radiotherapy,” International Journal of Radiation Oncology, Biology and Physics, Vol. 42, No. 3, 1998, pp. 661-672. doi:10.1016/S0360-3016(98)00248-X
- R. Sripadam, J. Stratford, A. M. Henry, A. Jackson, C. J. Moore and P. Price, “Rectal Motion Can Reduce CTV Coverage and Increase Rectal Dose during Prostate Radiotherapy: A Daily Cone-Beam CT Study,” Radiotherapy & Oncology, Vol. 90, No. 3, 2009, pp. 312-317. doi:10.1016/j.radonc.2008.07.031
- M. R. Kaus, K. K. Brock, V. Pekar, L. A. Dawson, A. M. Nichol and D. A. Jaffray, “Assessment of a Model-Based Deformable Image Registration Approach for Radiation Therapy Planning,” International Journal of Radiation Oncology, Biology and Physics, Vol. 68, No. 2, 2007, pp. 572-580. doi:10.1016/j.ijrobp.2007.01.056
- F. A. Lerma, B. Liu, Z. D. Wang, B. Yi, P. Amin, S. Liu, Y. M. Feng and C. X. Yu, “Role of Image-Guided Patient Repositioning and Online Planning in Localized Prostate Cancer IMRT,” Radiotherapy Oncology, Vol. 93, No. 1, 2009, pp. 18-24. doi:10.1016/j.radonc.2009.06.011
- A. Taylor, A. G. Rockall, R. H. Reznek and M. E. B. Powell, “Mapping Pelvic Lymph Nodes: Guidelines for Delineation in Intensity-Modulated Radiotherapy,” International Journal of Radiation Oncology, Biology and Physics, Vol. 63, No. 5, 2005, pp. 1604-1612. doi:10.1016/j.ijrobp.2005.05.062
- J. A. Rice, “Mathematical Statistics and Data Analysis,” Duxbury Press, Belmont, 1995.