Open Journal of Applied Sciences
Vol.4 No.2(2014), Article ID:43043,9 pages DOI:10.4236/ojapps.2014.42005
Prediction of the Local Scour at the Bridge Square Pier Using a 3D Numerical Model
Nguyen Viet Thanh1, Dang Huu Chung2, Tran Dinh Nghien1
1University of Transport and Communication, Hanoi, Viet Nam
2Vietnam Academy of Science and Technology, Hanoi, Viet Nam
Email: thanhkktqb@gmail.com, dhchung@imech.ac.vn, tdnghien@gmail.com
Copyright © 2014 Nguyen Viet Thanh et al. This is an open access article distributed under the Creative Commons Attribution License, which permits unrestricted use, distribution, and reproduction in any medium, provided the original work is properly cited. In accordance of the Creative Commons Attribution License all Copyrights © 2014 are reserved for SCIRP and the owner of the intellectual property Nguyen Viet Thanh et al. All Copyright © 2014 are guarded by law and by SCIRP as a guardian.

Received 30 November 2013; revised 5 January 2014; accepted 16 January 2014
ABSTRACT
In this paper, the problem on local scour around a single square pier was studied by using both the numerical and physical models. The numerical model for the study is FSUM based on a finite-difference method to solve the Reynolds averaged Navier-Stokes equations (RANS) and the equations for suspended sediment concentration and bed morphology. The computed result was verified through data measured in the experimental flume with a sand bed. In general, the typical features of local scour around the pier were successfully simulated by FSUM, such as stream flow, bow flow, down flow, horseshoe vortex. The comparison between the computation and experiment data shows a quite good fitness. Both numerical model and experiment results show that the maximum scour depth occurs at two front edges of the pier. Although the computed result shows a little bigger scour depth in comparison with the measurement in the physical model, it still confirms the reliability of numerical model in some measure.
Keywords
Numerical Modeling; Experiment; Bridge Square Pier; Local Scour; FSUM Model

1. Introduction
Local scour of alluvial channel beds around obstructions is a problem of continuing interest. That is the removal of bed sediment around or near structures located in flowing water, the serious consequence of which is the lowering of the riverbed level due to bed erosions such that there is a tendency to expose the foundations of a bridge. It is the result of the erosive action of flowing water, excavating and carrying away material from the bed and banks of streams and from around the piers and abutments of bridges (Richardson et al. ). Such scour around pier and pile supported structures and abutments can result in structural collapse and loss of life and property. The amount of this reduction below an assumed natured level is termed scour depth. Scour is usually divided into categories.
Local scour is the direct result of flow field changes due to the presence of a structure. It is caused by the three-dimensional turbulent flow around the abutment and bridge piers, by an acceleration of flow and resulting vortices induced by obstructions to the flow. It is characterized by the formation of scour holes around the bridge foundation.
In recent years, with the ever-increasing capabilities of computer hardware and software, the approach of numerical simulation has been widely used to determine fluid flow behavior in industrial and environmental applications. Some progression of using numerical simulation to study the flow around a pier and the scouring process has been made considerably.
Most models for predicting sediment transport are based on a single-phase flow approach. Bakker developed a numerical model to calculate suspended sediment concentration. Hagatun et al. (1986) presented a turbulence model to simulate the instantaneous sediment concentration and the turbulent boundary layer in the sheet flow regime over a flat bed. Nadaoka et al. (1990) developed a mobile bed model considering the mass and momentum transport of a single-phase flow. Olsen et al. (1993) predicted local scour developing processes using a three-dimensional flow and sediment transport model. They solved the Reynolds equations with the k-ε model for turbulence closure. Considering both suspended load and bed load, they solved the bed sediment conservation equation by iterating the procedure until the scour hole at an equilibrium state is obtained.
Recently, several two-phase flow-modeling techniques have been developed. Asano (1990) proposed a partial two-phase flow model in which the vertical velocity of particles was approximated by an empirical expression rather than being solved in the governing equations. Li et al. (1995) followed Asano’s work by formulating a complete set of two-phase flow equations. Gotoh et al. (1997) presented a numerical simulation of the sediment transport and flow kinematics with a closure for particle/particle interactions in the sheet flow regime. Richardson et al. (1998) simulated the flow structures around a bridge pier with and without the scour hole. They used FLOW3D with the RNG k-ε model. Comparing the simulated with the experimental results, they found that the 3D hydrodynamic model well simulates the complex flow patterns around the bridge pier. Wang et al. (1999) examined the importance of including various flow effects on sediment transport. They used a numerical model to simulate the three dimensional flow conditions around a pile and in a scour hole. Empirical functions were used to alter the shear stress in an empirical sediment transport model to account for the effects of the main flow, down flow, vortices, and turbulence intensity on sediment transport within the scour hole. Wang et al. (1999) simulated an evolution of the scour hole developing around the bridge pier by using CCHE3D. They examined the importance of including various flow effects on sediment transport. They used a numerical model to simulate the three dimensional flow conditions around a pile and in a scour hole. Tseng et al. (2000) conducted the numerical simulation with the square and the circular piers by the LES. They found that the down flow was made at the front face of the pier and this affected the creation of the horseshoe vortex. They also compared turbulent structures; lift coefficient, and drag coefficient with the experimental results. Good agreements were obtained. Sumer et al. (2002) used a finite volume hydrodynamic model with k-ε turbulence modeling to simulate the 3-D flow around a pile. Sumer et al. were able to capture all the main features of the scour process (i.e., the horseshoe vortex, sand slides or avalanching on the sides of the scour hole, bed ripples, the shape of the scour hole) and their equilibrium scour depth agreed fairly well with measurements. Equilibrium was reached in approximately 2.5 hours. Gamal et al. (2006) used the 3D flow model to verify the flow and local scour variation around a single pier and introduced an interaction effect between bridge piers. The model used a finite-volume method to solve the non-transient Navier-Stokes equations for three dimensions on a general non-orthogonal grid. The k-e turbulence model was used to solve the Reynolds-stress term. The numerical model solved the sediment continuity equation in conjunction with van Rijn’s bed-load sediment transport formula to simulate the bed evolution. The 3D flow model was verified through an experimental study in the non-cohesive bed material in an experimental flume. The different causes of local scour around the pier were simulated well, such as bow flow, down flow, horseshoe vortex, pressure variation and lee-wake vortex. The results show good agreement between simulation and experimental results. A. Azhari, et al (2010) used the Eulerian granular multiphase model to solve related equations. The flow was considered unsteady. A 3-D numerical model and a physical model were employed to simulate and predict the local scour depth around a set of three vertical circular piers located in a river. The computations were performed using k-e turbulent model. They found that the maximum scour depth was occurred around the first pier. The time course tests showed that 80% of scour hole was extracted in the first hour. The results from the computed tests showed a good agreement with the experimental data collected from the physical model which was an indication of the precision of the chosen computation procedure.
However, due to the complexities of both the flow field and the scour mechanism, numerical modeling of the scour process around bridge piers remains a difficult research topic.
In this paper, the erosion around a square pier is studied by using the mathematical and physical models. The mathematical model is FSUM (Flows with Substance transport and Bed Morphology) developed by Chung, D.H. . The numerical result is compared with the result from the experiment. At the same time, some treatments on local bed roughness are incorporated into FSUM model to improve the result of numerical simulation.
2. Experimental Work and Result
Particular experiments were conducted in an open rectangular concrete flume (Figure 1) with a length of 20 m, width of 1.1 m and depth of 0.5 m to verify the numerical results, located at Vietnam Academy Water resources (VAWR) in Hanoi, Viet Nam. The flume was divided into three parts: the inlet part, the working section and the outlet part. The working section located 8 m downstream of the flume entrance, having a length of 6 m, width of 1.1 m and depth of 0.5 m. Experiments were carried out under the condition of clear water. Table 1 shows the variables used in the experiment. The wooden square pier size of 0.1 × 0.1 m, side facing the approaching flow, was mounted in the middle of a working section. The flume bed was covered by clean and coarse sand particles with d50 = 0.27 mm for a thickness of 15 cm. The inflow discharge of 0.052 m3/s was supplied to the flume from a re-circulating tank with the help of a centrifugal pump, the flow depth was maintained at 0.22 m at the downstream during the experimental process. The selected water depth for the experiment run was maintained with the help of an adjustable vertical slit type tailgate provided at the downstream of the flume. An acoustic velocimeter (Delf, Holland) was used to measure the instantaneous 3D velocity. Two point gauges of 0.1 mm accuracy were used for measuring water depth in the longitudinal direction and the profile of the scour hole. The experiment was started by carefully filling the flume with water to the required flow depth. The experiment was stopped after a period of 4 hours. Figure 2 shows the illustration of scour hole after 3 hours when the scour depth is equilibrium. The maximum scour depth was occurred at two front edges of the pier.


Figure 1. Snapshots of experimental model.

Table 1. Variables for laboratory experiment.
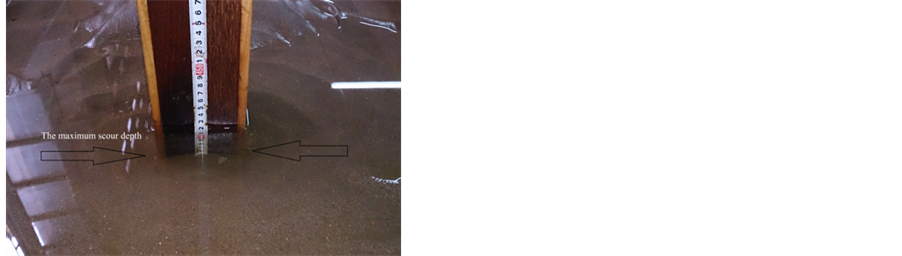
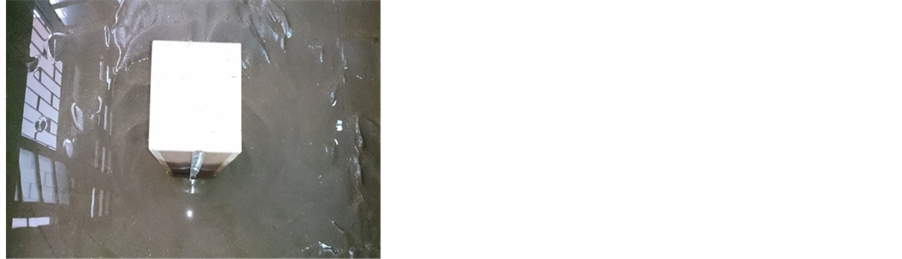
Figure 2. Snapshots of scour hole around the pier.
3. FSUM Model and Setup Procedure
The governing equations of FSUM includes the equations related to fluid velocity field that is governed by Reynolds-averaged Navier-Stokes equations, advection-diffusion equations and bed update equation together with initial and boundary conditions (Chung, D.H., 2008) as follows:
 (1)
(1)
 (2)
(2)
 (3)
(3)
 (4)
(4)
in which t is the time,  the spatial coordinates,
  the velocity vector of flow,
  the Coriolis acceleration vector,
  ,
,  the acceleration of gravity,
  the water density,
  the non-hydrostatic pressure,
  the momentum diffusion coefficients determined from zero-equation or k-epsilon model,
  ,
,  the settling velocity of solid particle, s the common variable for temperature, salinity, toxics or suspended sand concentration,
  the diffusion coefficients for suspended sediment,
  the bed level with the downward positive direction,
  ,
,  the total sediment flux components,
  the water level,
  the reference level and
  the porosity.
For turbulence simulation, the standard k-epsilon model is used, in which the effect of buoyancy and source terms are ignored (Mohammadi, B. and Pironneau, O., 1994) .
The above equations together the initial and boundary conditions were numerically solved in FSUM (Chung, D.H., 2008) ; Dang Huu Chung and Nguyen T. Kieu Duyen (2012) with the finite difference method and coded with FORTRAN 90/95. Approach of operator splitting for the finite-difference equations combining a semi-Lagrangian treatment of the advective terms with a semi-implicit discretization of the vertical diffusion terms is used (Casulli, V. and Stelling, G.S., 1998) .
In order to prepare the setup procedure for FSUM angular and rectangle grid on the x-y plane with the grid size of 0.01 m was generated (Figure 3). As shown in Figure 3, a two dimensional grid with 300 cells in the x-direction, 55 cells in y-direction and 12 layers in z-direction. The square pier was generated by blocking the area of the pier (Figure 4).
The boundary conditions are as follows:
• At the upstream:
 (5)
(5)
 (6)
(6)

Figure 3. XY plane for computational grid.
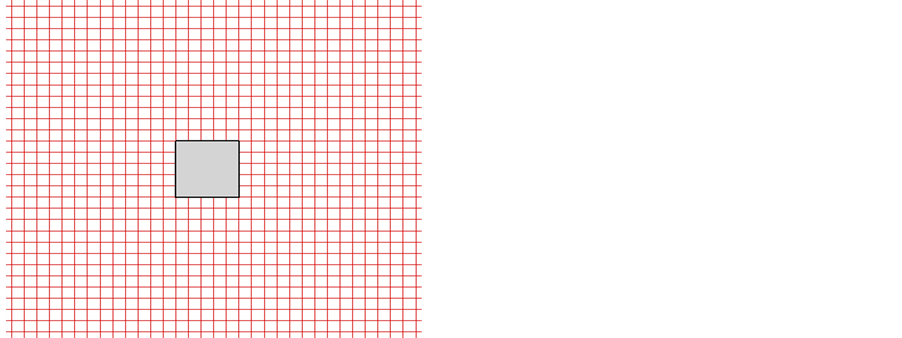
Figure 4. Detailed view of the grid after pier generation.
• At the downstream:
 (7)
(7)
 (8)
(8)
 (9)
(9)
in which Q is water discharge, c sediment concentration, u velocity component in x direction and  water level.
4. Numerical Results and Comparison
Some of the simulated results are presented in Figures 5-7. Since the flow field at far distance downstream is almost the same as that of the upstream inflow, therefore only a part of longitudinal profile of flow streams in the x-direction around the pier is shown in Figure 5. The behavior of flow pattern in the whole computation domain is quite sensible. It’s clearly seen that the flow in front of pier has a tendency of going down and behind the pier the flow is going up.
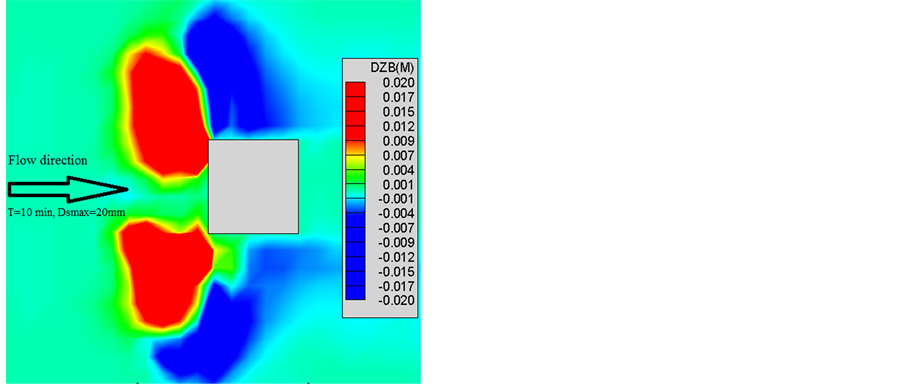
The reverse stream flow exists in front of the pier and the horseshoe vortex around the pier. The plots clearly show the existence of a separation zone behind the pier. The wake region in the numerical model results was defined as the region in which the longitudinal velocities are in opposite direction to the main flow direction. It indicated the presence of a downward flow at the face of the pier. It can be inferred that the down flow may also exert forces on the bed that initiate the eddy that causes the increase of local scour around the pier. The vertical downward flow in front of the pier increases with the increase in scour hole depth, until an almost equilibrium stage is reached (Ali et al., 2002) . Figure 6 shows a sequence of pictures, illustrating the time evolution of the local scour hole around a bridge pier obtained in the present simulation for T = 10, 20, 30, 40, 50, 60, 90,120 and 180 minutes, respectively. From these figures, we can see that the depth of local scour is larger and larger as the time elapsed. At the same time, the locations of erosion by the numerical model are quite suitable with the result of the experiment.

Figure 5. Horseshoe vortex and wake vortex on the plane section (x-z plane).
 (a)
(a) (b)
(b) (c)
(c) (d)
(d) (e)
(e) (f)
(f) (g)
(g) (h)
(h)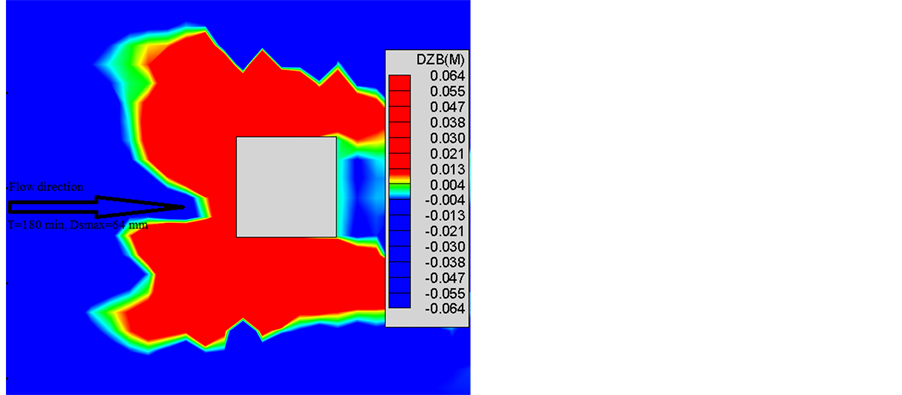 (i)
(i)
Figure 6. Contours of local scour depth around the pier. (a) T = 10 min; (b) T = 20 min; (c) T = 30 min; (d) T = 40 min; (e) T = 50 min; (f) T = 60 min; (g) T = 90 min; (h) T = 120 min; (i) T = 180 min.

Figure 7. The maximum scour depth versus time.
Figure 7 shows an interesting comparison on the development of the maximum scour depth versus time between the numerical model and experiment. The behavior of erosion evolution around the pier by the numerical model is quite suitable with the experiment. The correlation coefficient between observed and predicted values was 0.98. This also confirms the correctness of the proposal on the local treatment on bed roughness calculation in FSUM.
5. Conclusions
Local scour around a single square pier has been comprehensively studies by using a 3D numerical model FSUM along with a physical model in order to investigate the progressive development of the scour hole around the pier and also to verify the reliability on simulation and prediction of FSUM model. The obtained results over 3 hours of simulation and experiment showed a good qualitative and quantitative agreement. The following conclusions could be made based on the results of this study:
• The time duration of about 4 hours for such an experiment is enough to investigate in more details the process of erosion around a pier. Time variation of the maximum scour depth indicates that 90% of equilibrium scour depth occurs in the first two hour. Especially, this remark is very important for prediction with numerical model.
• Both numerical model and experiment results show that the maximum scour depth occurs at two front edges of the pier. However, the numerical model predicts a bigger scour depth in comparison to the measured scour depth in the physical model.
• From the longitudinal profile of stream lines it shows the important mechanism of local scour around the pier, the decisive factor of which is due to the sudden change of flow direction in front of a barricade, especially, the flow direction downwards to the bed. This remark could give some suggestions for special treatment on engineering consolidation.
• Finally, through this study, it also shows that the ability of application of numerical model in practice to predict the scour depth under various conditions is completely possible.
Acknowledgements This study was technically supported by Vietnam Academy Water resources (VAWR) in Hanoi, Viet Nam. The authors would like to thank the director of VAWR for his useful help.
References
- Richardson, E.V. and Davis, S.R. (2001) Evaluating scour at bridges. 4th Edition, Federal Highway Administration Hydraulic Engineering Circular No. 18, FHWA NHI 01-001.
- Bakker, W.T. (1974) Sand concentration in an oscillatory flow. Proceedings of 14th Conference on Coastal Engineering, Copenhagen, 24-28 June 1974, 1129-1148.
- Hagatun, K. and Eidsvik, K.J. (1986) Oscillatory turbulent boundary layers with suspended sediments. Journal of Geophysical Research, 91, 13045-13055. http://dx.doi.org/10.1029/JC091iC11p13045
- Nadaoka, K. and Yagi, H. (1990) Single-phase fluid modeling of sheet-flow toward the development of numerical mobile bed. Proceedings of 22nd Conference on Coastal Engineering, Delft, 2-6 July 1990, 2346-2359.
- Olsen, N.R.B. and Melaaen, M.C. (1993) Three-dimensional calculation of scour around cylinders. Journal of Hydraulic Engineering, 119, 1048-1054. http://dx.doi.org/10.1061/(ASCE)0733-9429(1993)119:9(1048)
- Asano, T. (1990) Two-phase flow model on oscillatory sheet-flow. Proceedings of 22nd Conference on Coastal Engineering, Delft, 2-6 July 1990, 2372-2384.
- Li, L. and Sawamoto, M. (1995) Multi-phase model on sediment transport in sheet flow regime under oscillatory flow. Coastal Engineering Journal (Japan), 38, 157-178.
- Gotoh, H. and Sakai, T. (1997) Numerical simulation of sheet flow as granular material. Journal of Waterway, Port, Coastal, and Ocean Engineering, 123, 329-336.
- Richardson, J.E. and Pancheng, V.G. (1998) Three dimensional simulation of scour inducing flow at bridge piers. Journal of Hydraulic Engineering, 124, 530-540. http://dx.doi.org/10.1061/(ASCE)0733-9429(1998)124:5(530)
- Wang, S.S.Y. and Jia, Y. (1999) Computational simulations of local scour at bridge crossings—Capabilities and limitations. Proceedings ASCE International Water Resources Engineering Conference, Seattle, 8-12 August 1999, Session BS-06, Water Resources Publications, LLC, Highlands Ranch.
- Tseng, M., Yen, C.L. and Song, C.C.S. (2000) Computation of three-dimensional flow around square and circular piers. International Journal for Numerical Methods in Fluids, 34, 207-227. http://dx.doi.org/10.1002/1097-0363(20001015)34:3<207::AID-FLD31>3.0.CO;2-R
- Sumer, B.M., Roulund, A., Fredsoe, J. and Michelsen, J. (2002) 3-D numerical modeling of flow and scour around a pile. First International Conference on Scour of Foundations, ICSF-1, College Station, 17-20 November 2002, 795- 809.
- Gamal, A.A.A., Hassan, I.M. and Shima, M.A. (2006) 3-D numerical simulation of flow and clear water scour by interaction between bridge piers. Tenth International Water Technology Conference, IWTC10, Alexandria, 2006.
- Azhari, A., Saghravani, S.F. and Mohammadnezhad, B.A. (2010) 3D Numerical modeling of local scour around the cylindrical bridge piers. In: Carrera, J., Ed., XVIII International Conference on Water Resources CMWR 2010, CIMNE, Barcelona.
- Chung, D.H. (2008) FSUM model and applications. Vietnam Journal of Mechanics, VAST, 30, 237-247.
- Chung, D.H. (2008) Numerical simulation of sediment transport from Ba Lat Mouth and the process of coastal morphology. Journal of Geophysics and Engineering, 5, 46-53. http://dx.doi.org/10.1088/1742-2132/5/1/005
- Mohammadi, B. and Pironneau, O. (1994) Analysis of the k-epsilon turbulence mode. John Wiley & Sons, Chichester.
- Chung, D.H. and Eppel, D. (2008) Effects of some parameters on numerical simulation of coastal bed morphology. International Journal of Numerical Methods for Heat & Fluid Flow, 18, 575-592. http://dx.doi.org/10.1108/09615530810879729
- Chung, D.H. and Duyen, N.T.K. (2012) Sensitivity of Lagrangian particle tracking based on a 3D numerical model. Journal of Modern Physics, 3, 1972-1978. http://dx.doi.org/10.4236/jmp.2012.312246
- Casulli, V. and Stelling, G.S. (1998) Numerical simulation of 3D quasi-hydrostatic, free-surface flows. Journal of Hydraulic Engineering, 124, 678-698.
- Ali, K.H.M. and Karim, O. (2002) Simulation of flow around piers. Journal of Hydraulic Research, IAHR, 40, 161- 174. http://dx.doi.org/10.1080/00221680209499859