Journal of Sustainable Bioenergy Systems
Vol. 2 No. 4 (2012) , Article ID: 25398 , 4 pages DOI:10.4236/jsbs.2012.24011
Bio-Oil Production by Pyrolysis of Oil Palm Empty Fruit Bunch in Nitrogen and Steam Atmospheres
Department of Chemical Technology, Chulalongkorn University, Bangkok, Thailand
Email: peera030127@hotmail.com, harakhun@hotmail.com, tharapong.v@chula.ac.th
Received July 30, 2012; revised September 10, 2012; accepted September 25, 2012
Keywords: Alternative Energy; Pyrolysis; Biomass; Oil Palm Empty Fruit Bunch; Box-Behnken Design
ABSTRACT
This work investigated the bio-oil production from oil palm empty fruit bunch (EFB) by continuous pyrolysis reactor under nitrogen and steam atmospheres as sweeping gas. The study parameters were particle size, biomass feeding rate, reactor temperature, and reactor sweeping gas. The EFB particle ranges were below 500 micrometers, between 500 - 1180 micrometers and 1180 - 2230 micrometers. Feeding rates were 150, 350, and 550 rpm. Both factors were analyzed by single factor ANOVA. Additionally, Box-Behnken design was used to investigate temperature (350˚C - 600˚C) under the following nitrogen and steam flow rates as sweeping gas: 0, 100, and 200 cm3/min of nitrogen and 0, 9, and 18 cm3/min of steam. The mathematical model from Box-Behnken design succeeded in predicting the optimal conditions for normal and nitrogen atmospheres. A particle size below 1180 µm was determined to be optimal for bio-oil production. In a normal atmosphere or no sweeping gas, the condition was 475˚C and 450 rpm of feed rate. The optimal condition for nitrogen atmosphere was 530˚C, 450 rpm of feed rate, and 200 cm3/min of nitrogen flow rate. However, steam as sweeping gas caused high uncertainty and the model was unable to predict the optimal conditions accurately. The biooils from normal, nitrogen, steam, and mixed atmospheres were analyzed for general characteristics. NMR and GC-MS were used to analyze chemical compositions in the bio-oils. Relationships between physical and chemical characteristics were determined and discussed.
1. Introduction
Biomass is considered to be a potential alternative energy source. The biomass from agriculture, organic waste, food, and forestry industry can be used for energy production. An important attribute of the utilized biomass is that it should be inedible, thus avoiding any adverse effects on food production. Oil palm empty fruit bunch (EFB) is a byproduct from harvesting palm fruits. The government policy is to promote the cultivation of oil palm and increase oil palm production capacity. The plan is to increase palm oil production up to 26% of total world consumption in 2020 [1].With an expected agriculture area about 40 million acres in 2029 (Executive Summary-Oil Palm, [2]),the massive oil palm empty fruit bunch has a potential to be used in many applications such as natural fiber synthesis, and oleo-chemical [3,4]. Of particular interest is its use as an energy source for electricity production and bio-oil synthesis.
Pyrolysis is the decomposition of biomolecules at elevated temperatures without the participation of oxygen. The products are in solid (biochar), liquid (bio-oil), and gas phases. There are studies regarding factors which affect the bio-oil production including temperature, particle size, and sweeping gas atmosphere. A study by Mohan et al. suggested that the temperature range between 400˚C - 500˚C is optimal and a small particle size with high surface area is associate to improved decomposition reaction [5]. Later works by Özbay et al. stated that the addition of an inert sweeping gas such as nitrogen to the atmosphere resulted in an increased bio-oil yield. The inert molecules in gas facilitate heat and mass transfers in the reaction site and prevent secondary reaction [6]. However, inert gases, including high-purity nitrogen are expensive and unsuitable for application in faraway country side area. An alternative atmosphere for easy and economical implementation should be considered. Of particular interest as an alternative atmosphere is steam. A work published by Pütün et al. investigated pyrolysis under steam atmosphere and found an increase in liquid product yield.[7] There has been research conducted by Sulaiman and Abdullah, into determining optimal conditions for liquid yield of EFB pyrolysis.[8] Their research was carried out on afluidized bed bench scale fast pyrolysis reactor, with the objective of determining the important conditions and key variables which are required to maximize the liquid yield and its quality. The research investigated the impact of reactor temperature, varying residence time, within the fluidized bed reactor through control of nitrogen flow rate. A tubular reactor setup and steam atmospheric conditions were not investigated.
The study is to determine pyrolysis factors, which affect liquid yield or bio-oil production. The particle size and feed rate were evaluated by single factor ANOVA. Box-Behnken design experiment was to evaluate temperature, inert (N2) and steam atmospheres factors for optimum conditions.
2. Methodology
2.1. Feedstock Preparation
The EFB was kindly supplied by Royal Project, Huaikayeng, Kanchanaburi. The fresh feedstock was chopped and dried by sunlight for a week before being grinded to reduce its particle size. The grounded EFB was left over night in an oven set to 105˚C to remove moisture. Particle sizes were then segregated by molecular sieves into <500, 500 - 1180, and 1180 - 2230 µm sizes. Finally the sorted EFB particles are dehydrated again in the oven at 105˚C before being sealed in plastic bags to keep dry.
2.2. EFB Characteristic Analysis
The EFB was analyzed for calorific value by the bomb calorimeter, Parr 6200. The proximate analysis is analyzed according to ASTM established procedures. Ultimate analysis was performed to determine elemental composition by LECO CHN-2000 and sulfur analyzer. The weight fraction of carbon, hydrogen, and nitrogen were analyzed, and the oxygen weight fraction was attained by the difference. Thermo-gravimetric analysis was performed by Pyris 1 TGA from PerkinElmer at temperature under 500˚C for nitrogen gas and between 500˚C - 600˚C for oxygen gas with a temperature increase rate of 10 K/min.
2.3. Reactor Configuration and Procedure
Reactor components are Protherm Electrical Furnace and temperature controller, Honeywell DC1010. The temperature was monitored by a thermocouple inside the bed. Nitrogen feeder consisted of a nitrogen tank with arotameter to control volumetric flow rate (gas). For steam feeder, deionized water is contained in an enclosed tank and pumped by a peristaltic pump to a 200˚C electrical heater. The flow rate of steam is controlled by the volumetric flow rate (liquid) of water from water tank to the electrical heater. The superheated steam is then fed to the reactor. The complete setup and configuration of the reactor is shown in Figure 1. An EFB sample of 100 gram was fed to hopper where it is deposited on the reactor screw feeder for transportation through the reactor. The detention time is controlled by the feed rate of the reactor screw feeder. The feed rates of interest were 150, 350, and 550 rpm. A higher speed (rpm) results in lower detention time and conversely lower speed (rpm) leads to longer detention time.
The EFB is fed to the hopper (no. 3) and deposited on the reactor screw feeder. The reactor screw feeder then transports the EFB through the tubular reactor (no. 7) where the pyrolysis process took place. The solid product was collected in the tower (no. 8). The vapor phase condensed in condenser and collected in flask (no. 9 and 10 subsequently) and non-condensable gas exhausted out by vacuum pump (no. 11).
Statistical analyses were according to Montgomery [9] and calculated by Microsoft Excel®. The effects of particle size and feed rate were determined by single factor ANOVA with double replication. To investigate the particle size effect, the operating condition was 200 ml/min of nitrogen flow rate, 450 rpm of feed rate, and 450˚C. The 1:1 proportion of <500 and 500 - 1180 µm mixture was chosen for further experiments. The three-factor BoxBehnken design was for temperature, nitrogen, and steam volumetric flow rate (Table 1 and Figure 2). The experiment plan and liquid yield are shown in Table 5. Variance, normality, and residual tests were included.
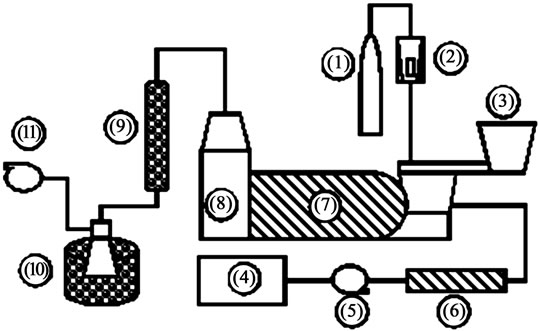
Figure 1. Diagram of continuous pyrolysis reactor: (1) nitrogen tank, (2) rotameter, (3) biomass hopper with screw feeder, (4) enclosed deionized water tank, (5) peristaltic pump, (6) electrical coil heater with temperature controller, (7) pyrolysis reactor with screw feeder and digital temperature controller, (8) bio-char collecting tower, (9) condenser, (10) flask in ice bucket, and (11) vacuum pump.

Table 1. Natural variable for coded variable in Box-Behnken design.

Figure 2. Cubic plot for factors, Box-Behnken design (modified from ref [10]).
2.4. Bio-Oil Analysis
General characteristics have been identified based on ASTM standard. Chemical analyses are to identify interaction between composition and atmospheres.
3. Result and Discussion
3.1. Characteristic of EFB
Table 2 shows the proximate and ultimate analysis of EFB. The compositions and calorific value are close to other kinds of biomass [11].
DTG diagram displayed in Figure 3 shows the decomposition of Hemicellulose and cellulose in the range of 180˚C to 380˚C which the highest decomposition rate was at about 290˚C. The absence of a peak at approximately 150˚C, typically associated with dehydration of EFB, is due to the low moisture content in the EFB sample (Table 2). This mixture usually gave indistinct peaks for each composition. After 380˚C, lignin started to decompose until finish about 500˚C. The highly aromatic compound of lignin caused higher thermal stability and composition temperature. The highest peak was about 450˚C. TGA analyzer switched from nitrogen to oxygen gas to burn fix carbon. Moisture, and fix carbon compositions were 5.74 and 12.72 respectively which were closed to proximate analysis results.
3.2. Effect of Particle Size to Product Yield
The three ranges of EFB size; below 500, between 500 - 1180, and 1180 - 2230 µm were investigated for their effects by single factor ANOVA. Their experimental and statistical results are shown in Table 3.
P-value below 0.05 from statistical analysis revealed significance of particle size effect at 95% CI. Residue analyses indicated precision and confidence of result. Normality tests were investigated by normal plot (not shown) and Bartlett’s test. The later test gave P-value of 0.869 thus the observations meet normal assumption by an equality of variance.
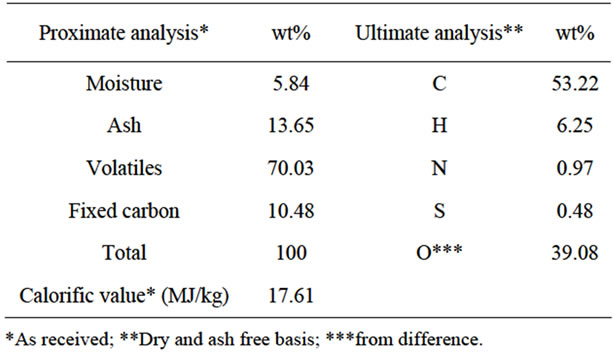
Table 2. Characteristics of EFB.

Figure 3. Thermogravimetric analysis of EFB.

Table 3. Product yield from each particle size.
Figure 4 demonstrates below 500 and 500 - 1180 µm sizes which gave higher liquid yield compared to the 1180 - 2230 µm of particle size at 95% CI (based on pooled standard deviation). The smaller size provided more diffusivity than the larger one which helped heat and mass transfer. This condition favors the liquid production as described in some researches. The poor heat and mass transfer of larger particle favored the secondary reaction to produce more gas product [12-14].
However, the solid yield remained constant which was mainly related to ash and carbon residue in the biomass (Figure 5).
The distribution of obtained particles sizes are 10% below 500 µm, 70% between 500 - 1180 µm, and 20% 1180 - 2230 µm. Due to the low quantity of obtained below 500 µm particle size and negligible difference in influence on the liquid product yield, particle sizes of below 500 and 500 - 1180 µm were chosen and mixed together in a 1:1 ratio for the further experimentation.
3.3. Effect of Feed Rate to Product Yield
The feed rate of the reactor screw feeder can be adjusted

Figure 4. Liquid yield form each particle size.

Figure 5. Product yield from each particle size.
by an electronic controller. A higher screw rate causes the faster movement of reagent through the reactor resulting in low detention time. The study chose 150, 350, and 550 rpm of screw rate to vary feed rate. The results are shown in Table 4.
P-value below 0.05 shows significance of feed rate on liquid yield at 95% CI (based on pooled standard deviation). PRESS and residue analysis confirm normality of data residue. The Bartlett’s test confirmed normality with P-value of 0.861. The amounts of liquid yield descended from high to low are 350, 550, and 150 rpm respectively (Figure 6). The lower screw rate lowers yield due to the high residence time causing extensive thermal decomposition. The resulting higher gas product might be caused by biomass dispersion in the thermal reactor where additional cracking could have occurred (Figure 7). The 350 rpm was the most favorable operating condition for the liquid production. Lower screw rates result in an unreliable operation (rate fluctuations/jamming) therefore a higher screw rate of 450 rpm, which will avoid problems and yield acceptable results, is chosen for further experimentation.

Table 4. Product yield from each screw rate.
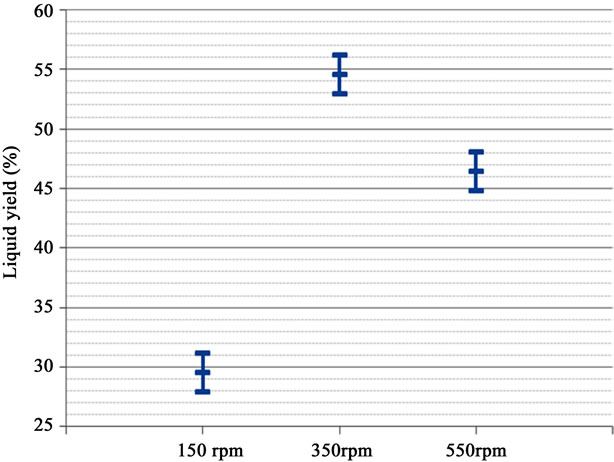
Figure 6. Liquid yield form each screw rate.

Figure 7. Product yield from each screw rate.
3.4. Effect of Temperature, Nitrogen, and Steam Flow Rates
Box-Behnken design was to determine factor effect and their interaction. Table 5 shows product yields which are further analyzed by central composite design. Control variables are particle size below 1180 µm and screw rate of 450 rpm. The chosen screw rate was fast enough to drive steam out from reactor and prevent steam backleakage. The main difficulty caused by steam is the agglomeration of the EFB particles. The close placement of steam inlet and biomass screw feeder results in premature contact between superheated steam and EFB. The superheated steam comes into contact with the relatively cooler EFB and partially condenses into water vapor on the EFB particles. This moisture causes the EFB particles to agglomerate forming clumps that sometimes block the biomass screw feeder and affect the pyrolysis process. This problem is the partial cause of reduced liquid yield and high uncertainty to this type of system. Careful experiments with thorough experimental records were needed to deal with these difficulties. The preliminary results were rejected by statistical analysis. To solve this problem the experimental data was preprocessed with Box-Cox transformation to improve model fit and additional statistic methods were employed to identify outliers. Replication was carried out if any obvious outliers were detected. The preprocessed data was then reevaluated by statistical analysis.
The Quadratic model was chosen because it was appropriate to the design and not aliased. P-value indicates significance of the model and variable. The variables with P-values less than 0.05 and their inherent are included in mathematical expression. Lack of Fit is not significant indicating a good data modeling. PRESS and R-Squared are acceptable.
Normal plot of residuals shows that these data have no pattern which implies an inequality of variance. Studentized residuals and COOK’s distance confirmed no indication of outlier. However, Leverage plot showed an abnormally high value which might imply some influential observation but would be acceptable in this case because other statistical tests were accepted.
The mathematical model is:
For coded variable:
 (1)
(1)
For actual variable:
 (2)
(2)
Contour plots from the model show relationship between those of three factors. Figure 8 represents the response of liquid yield from temperature and nitrogen flow rate. The condition of interest was at 475˚C and 200 ml/min. The contour plot also shows weakness of BoxBehnken design about inability of concise prediction of response at the extreme corner conditions [10]. The point at the center of each edge of the plot indicates actual experiment conditions for modeling. The highly accurate prediction is the condition in the nearby area.
The steam atmosphere caused uncertainty in the experiments. The system might not be able to maintain steam temperature in a superheated state at the entrance of the thermal reactor. The lower liquid yield is due to the high moisture and incomplete pyrolysis reaction. As can be seen in the contour plot shown in Figure 9, the temperature and steam flow rate at the condition of interest (475˚C and 200 ml/min) is predicted to produce 40% - 50% yield.

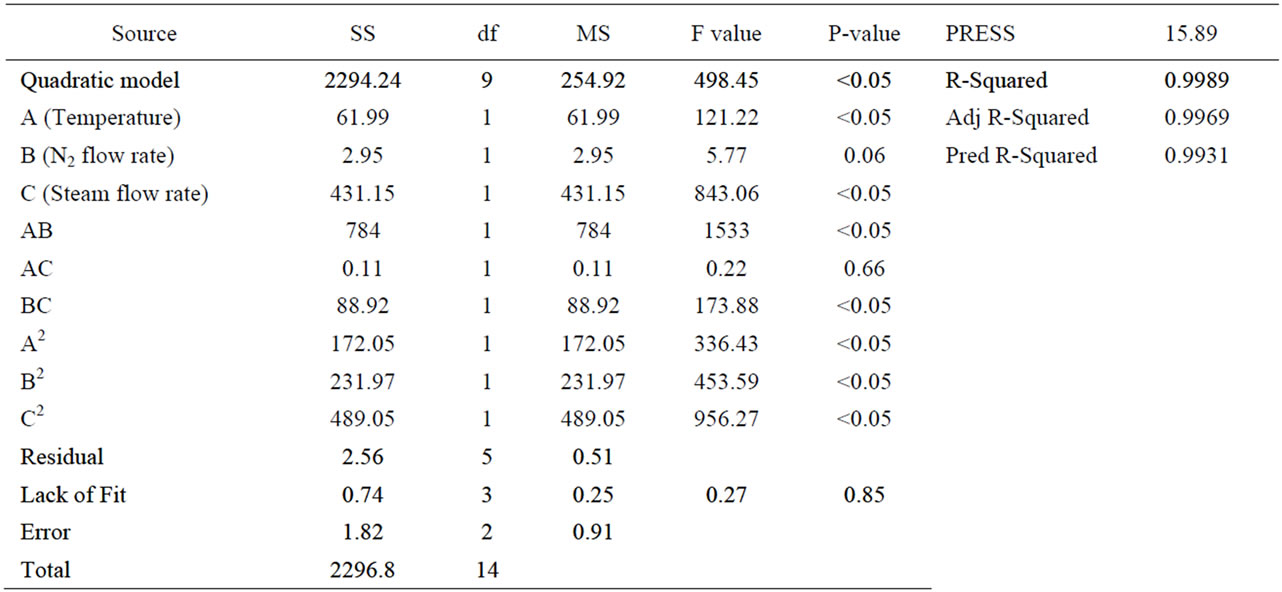
Table 5. Product yields from Box-Behnken design.

Figure 8. Contour plot for temperature versus nitrogen flow rate.

Figure 9. Contour plot for temperature versus steam flow rate.
Figures 10 and 11 represent interaction between nitrogen and steam atmosphere at 475˚C and 600˚C respectively. They suggest that higher temperatures and the utilization of both sweeping gases also minimized liquid yield. This might imply that gas expansion within the system causes a higher leakage of vapor and gas from the system. It can be seen that the high uncertainty of operating under steam atmosphere causes an unreliable model prediction.
The model had been verified by double replication for each atmosphere. The selected conditions were chosen from the areas close to actual experiment’s condition. Box-Behnken design has low accuracy in areas which are located far from the experimented conditions particularly at corners. Selected product yields are presented in Table 6.

Figure 10. Contour plot for interaction between nitrogen versus steam flow rate at 475˚C.
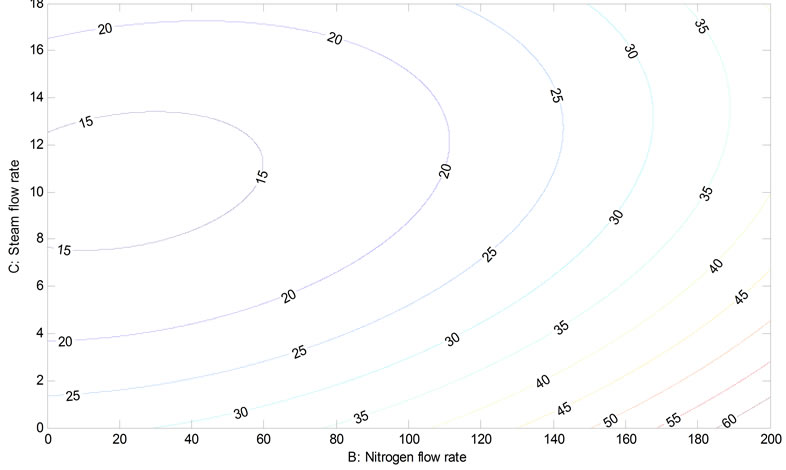
Figure 11. Contour plot for interaction between nitrogen versus steam flow rate at 600˚C.

Table 6. Product yields from selected condition.
Under normal (no sweeping gas) and nitrogen atmosphere, the replications are accepted by tolerant interval (TI). However, the results of steam and mixed atmosphere were rejected by tolerant interval (TI). The steam caused high uncertainty thus the model is unable predict result accurately.
3.5. General Bio-Oil Characteristic
The composition general characteristics of the bio-oils produced were determined by ASTM standard, as shown in Tables 7 and 8, respectively. The differences in characteristics of each bio-oil are then indicated, examined, and discussed for potential problems that might arise in further application.
3.5.1. Inhomogeneity of Bio-Oil
The bio-oil produced consisted of aqueous and organic phases. The aqueous phase contained high water composition and water-soluble compounds. The organic phase was a black and high viscosity liquid which contained lower polar compounds with relatively high calorific value. Total water composition was analyzed by KarlFisher titration from both phases and summed together. The high water content lowers flame temperature but also reduce emission [15,16].

Table 7. Composition of bio-oil, calorific value, and elemental analysis.

Table 8. General characteristic of bio-oils.
3.5.2. Calorific Value of Bio-Oil and Char
Average calorific value of the bio-oil from normal atmosphere was lower than other sweeping gas atmospheres. However, the char from normal atmosphere had lower calorific value compared to the others. This would relate to amount of carbon components in the bio-oil among the atmospheres.
3.5.3. Elemental Analysis of Bio-Oil and Char
Carbon content related to type of atmosphere. Normal atmosphere gave higher carbon bio-oil and lower carbon char. Amounts of carbon among sweeping gas atmospheres are similar.
3.5.4. Density and Viscosity of Bio-Oil
Bio-oil from the normal atmosphere had higher density and viscosity. This might relate to higher carbon and aromatic components compared to those from sweeping gas atmospheres. The bio-oil has higher value than the standard thus the bio-oil might be applicable for lowspeed diesel engine due to limited mass transfer. The density is highly related to other characteristics including viscosity High viscosity can decrease flow rate and distort pumping [17]. A narrower density range to meet appropriated air/fuel ratio can reduce emission while maintaining performance.
3.5.5. Carbon Residue and Ash
Carbon residue and ash are related to type of biomass. Ash accumulates in plant’s structure thus there no difference among atmospheres. The high carbon residue has more tendencies to form carbonaceous deposits resulting in stress, corrosion, or cracking of the system. The ash also causes additional complication such as component wear and injector nozzle clogging. The carbon residue and ash must be further regulated to meet standard requirement to increase system lifetime [17].
3.5.6. pH Value
Compared to the crude oil, the bio-oils have lower pH. The acidic chemical compounds consist of phenol and carboxylic acid. Metal and polymer component in engine need to be improve to prevent corrosion.
3.5.7. Flash Point
The high flash point of the obtained bio-oil is due to the polar and water components. This is the important property for safe storage and handling.
3.5.8. Corrosion
Copper Strip Corrosion test is under ASTM D130. All bio-oils produced 1b standard color or slight corrosion which meets Worldwide Fuel Charter specified the 1 color. The corrosion by bio-oil is mainly contributed to acidic compound in the bio-oils. This can affect metallic parts in fuel system including pumps, engine, and oil storage system [17].
3.6. Chemical Analysis
3.6.1. Proton Nuclear Magnetic Resonance Spectroscopy
Atmospheres affected on chemical compositions of biooils. Compared to the steam, nitrogen gave lower aromatic and aliphatic bonded to oxygen, however, higher Aliphatic bonded to aromatic or alkene and other aliphatic Table 9.
3.6.2. Gas Chromatography—Mass Spectrometry
The chemical compound in the bio-oils is presented in Table 10. The bio-oils produced consisted of hydrocarbon compounds with hydroxyl and carboxyl groups, particularly for phenols, alcohols, and ketones. The phenols and theirs derivatives were main components which imparted high acidity, viscosity, and low thermal stability to the bio-oil characteristics.
Phase separation of the bio-oil is caused by high water composition [19]. Water might be removed by hot condenser [20] or vacuum distillation. The improvement of bio-oil physical properties by emulsification or solvent has been reported in many studies. The addition of alcoholcan improve homogeneity, viscosity, and storage stability [21,22]. Surfactants to emulsify bio-oil droplet also enhance its characteristics [23].

Table 9. Chemical composition by H-NMR.


Table 10. Chemical compounds in the bio-oils.
4. Conclusion
Proximate and elemental analysis revealed the compositions of EFB which were closed to other kinds of plantderived bio-mass. From TGA, Holocellulose started to decompose thermally from 180˚C - 380˚C with the highest peak at about 290˚C. Lignin started to decompose from then to 500˚C with the highest rate at about 460˚C. In study of effect between atmospheres, the appropriated control variables were the <1180 µm of particle size and 450 rpm of screw rate.
5. Acknowledgements
This work was supported by the Higher Education Research Promotion and National Research University Project of Thailand, Office of the Higher Education Commission (EN 272 A), Ratchadaphiseksomphot Endowment Fund ( CU-CLUSTER-FUND ), the Thai Government Stimulus Package 2 (TKK2555) under the Project for Promotion of bio and biomass utilization potential for fuel production and exporting technology, Chulalongkorn University and Research Program on Materials for Future Energy, Center of Excellence on Petrochemical and Materials Technology.
REFERENCES
- Department of Agricultural Extension, “Information on Palm Oil,” 2010. http://www.doae.go.th/plant/palm.htm
- “Executive Summary—Oil Palm,” 2010. http://www.kasetcity.com/Thaibioenergy/Plam/QAview.asp?id=15
- M. S. Umikalsom, et al., “The Treatment of Oil Palm Empty Fruit Bunch Fibre for Subsequent Use as Substrate for Cellulase Production by Chaetomium Globosum Kunze,” Bioresource Technology, Vol. 62, No. 1-2, 1997, pp. 1-9. doi:10.1016/S0960-8524(97)00132-6
- S. H. A. Rahman, J. P. Choudhury and A. L. Ahmad, “Production of Xylose from Oil Palm Empty Fruit Bunch Fiber Using Sulfuric Acid,” Biochemical Engineering Journal, 2006. Vol. 30, No. 1, pp. 97-103. doi:10.1016/j.bej.2006.02.009
- D. Mohan, C. U. Pittman and P. H. Steele, “Pyrolysis of Wood/Biomass for Bio-Oil: A Critical Review,” Energy & Fuels, Vol. 20, No. 3, 2006, pp. 848-889. doi:10.1021/ef0502397
- N. Özbay, et al., “Biocrude from Biomass: Pyrolysis of Cottonseed Cake,” Renewable Energy, Vol. 24, No. 3-4, 2001, pp. 615-625. doi:10.1016/S0960-1481(01)00048-9
- A. E. Pütün, E. ApaydIn and E. Pütün, “Rice Straw as a Bio-Oil Source via Pyrolysis and Steam Pyrolysis,” Energy, Vol. 29, No. 12-15, 2004, pp. 2171-2180. doi:10.1016/j.energy.2004.03.020
- F. Sulaiman and N. Abdullah, “Optimum Conditions for Maximising Pyrolysis Liquids of Oil Palm Empty Fruit Bunches,” Energy, Vol. 36, No. 5, 2011, pp. 2352-2359. doi:10.1016/j.energy.2010.12.067
- D. C. Montgomery, “Design and Analysis of Experiments,” 6th Edition, John Wiley & Sons, Hoboken, 2004.
- National Institute of Standards and Technology, “The Three-Factor Box-Behnken Design was for Temperature, Nitrogen, and Steam Volumetric Flow Rate,” NIST/ SEMATECH e-Handbook of Statistical Methods, 2012. http://www.itl.nist.gov/div898/handbook/
- W. T. Tsai, M. K. Lee and Y. M. Chang, “Fast Pyrolysis of Rice Straw, Sugarcane Bagasse and Coconut Shell in an Induction-Heating Reactor,” Journal of Analytical and Applied Pyrolysis, Vol. 76, No. 1-2, 2006, pp. 230-237. doi:10.1016/j.jaap.2005.11.007
- F. Abnisa, et al., “Utilization Possibilities of Palm Shell as a Source of Biomass Energy in Malaysia by Producing Bio-Oil in Pyrolysis Process,” Biomass and Bioenergy, Vol. 35, No. 5, 2011, pp. 1863-1872. doi:10.1016/j.biombioe.2011.01.033
- H. Park, et al., “Pyrolysis Characteristics of Oriental White Oak: Kinetic Study and Fast Pyrolysis in a Fluidized Bed with an Improved Reaction System,” Fuel Processing Technology, Vol. 90, No. 2, 2009, pp. 186-195. doi:10.1016/j.fuproc.2008.08.017
- J. Shen, et al., “Effects of particle size on the fast pyrolysis of oil mallee woody biomass,” Fuel, Vol. 88, No. 10, 2009, pp. 1810-1817. doi:10.1016/j.fuel.2009.05.001
- R. Calabria, F. Chiariello and P. Massoli, “Combustion Fundamentals of Pyrolysis Oil Based Fuels,” Experimental Thermal and Fluid Science, Vol. 31, No. 5, 2007, pp. 413-420. doi:10.1016/j.expthermflusci.2006.04.010
- Q. Zhang, et al., “Review of Biomass Pyrolysis Oil Properties and Upgrading Research,” Energy Conversion and Management, Vol. 48, No. 1, 2007, pp. 87-92. doi:10.1016/j.enconman.2006.05.010
- “Properties of Diesel,” 2011. http://www.med.govt.nz/
- “Worldwide Fuel Charter,” 2011. http://www.autoalliance.org
- Q. Lu, W.-Z. Li and X.-F. Zhu, “Overview of Fuel Properties of Biomass Fast Pyrolysis Oils,” Energy Conversion and Management, Vol. 50, No. 5, 2009, pp. 1376-1383. doi:10.1016/j.enconman.2009.01.001
- A. Oasmaa, et al., “Fast Pyrolysis of Forestry Residue and Pine. 4. Improvement of the Product Quality by Solvent Addition,” Energy & Fuels, Vol. 18, No. 5, 2004, pp. 1578-1583. doi:10.1021/ef040038n
- M. E. Boucher, et al., “Bio-Oils Obtained by Vacuum Pyrolysis of Softwood Bark as a Liquid Fuel for Gas Turbines. Part II: Stability and Ageing of Bio-Oil and Its Blends with Methanol and a Pyrolytic Aqueous Phase,” Biomass and Bioenergy, Vol. 19, No. 5, 2000, pp. 351-361. doi:10.1016/S0961-9534(00)00044-1
- M. E. Boucher, A. Chaala and C. Roy, “Bio-Oils Obtained by Vacuum Pyrolysis of Softwood Bark as a Liquid Fuel for Gas Turbines. Part I: Properties of Bio-Oil and Its Blends with Methanol and a Pyrolytic Aqueous Phase,” Biomass and Bioenergy, Vol. 19, No. 5, 2000, pp. 337-350. doi:10.1016/S0961-9534(00)00043-X
- M. Ikura, M. Stanciulescu and E. Hogan, “Emulsification of Pyrolysis Derived Bio-Oil in Diesel Fuel,” Biomass and Bioenergy, Vol. 24, No. 3, 2003, pp. 221-232. doi:10.1016/S0961-9534(02)00131-9