Open Journal of Acoustics
Vol. 3 No. 2 (2013) , Article ID: 33463 , 4 pages DOI:10.4236/oja.2013.32006
The Brief Research on the Pitch Pattern Comparison of Electroacoustic Disguised Voice
China Criminal Police University, Shenyang, China
Email: zhbhn@sina.com
Copyright © 2013 Hongbing Zhang. This is an open access article distributed under the Creative Commons Attribution License, which permits unrestricted use, distribution, and reproduction in any medium, provided the original work is properly cited.
Received November 25, 2012; revised January 1, 2013; accepted January 10, 2013
Keywords: Disguised Voice; Pitch Pattern; Normalization; Speaker Identification
ABSTRACT
Camouflage voice is the common check material form in judicial voice testing field that brings about many difficulties to speaker identification. Aiming at the electroacoustic disguised voice, we get fundamental frequency variation rule before and after voice change of multiple corpuses by analyzing map and data. The results show that the fundamental frequency before and after voice change exists a linearity relationship, we can realize speaker identification in electroacoustic disguised speech field through comparing Chinese pitch pattern.
1. Introduction
Fundamental frequency as one important acoustics character in speech check field has indispensable application value about speaker identification work. The pitch difference will not change tone, but the pitch change will change tone. Since every person has different compass, and check material is easy to camouflage, channel and voice extraction methods, etc. factors are different in judicial speech testing process, that speaker fundamental frequency is prone to some degree of variation, so the fundamental frequency data has not comparability. It’s particularly difficult to make speaker identification because of disguised speech which is the common check materiel form in judicial speech testing field, and electroacoustic camouflage is a typical individual speech camouflage pattern.
The personalized camouflage for speaker’s natural voice realized by voice changing hardware and software technology lead to most listener feel difficult to identify speaker’s identity, age and sex, and seriously affected the identification effect of judicial speech test, which bring great trouble to the judicial identification work. Aiming at the electroacoustic disguised pattern, we focus on the speech character changing rule before or after voice change. According to this variation rule of acoustic feature which combined with the Chinese pitch pattern theory and in depth analysis of the change regularity of fundamental frequency value before and after speaker voice change, we can compare the voice and find whether there are differences between their pitch pattern curves. As result we provide a scientific and effective method for speaker identification of such voice through pitch pattern comparison.
2. Chinese Pitch Pattern
Since Mandarin Chinese pitch changes in different, they form four tones in Mandarin Chinese. The Chinese pitch changes bear rich speech, linguistic information, these complex changes also reflects the speaker’s pitch features. Generally we use tone shape and tone pitch to describe Chinese tone. Tone shape is a reflection of fundamental frequency changing morphology when the vocal cords vibrate. The fundamental frequency changing range is from the lowest tone to the highest tone which called tone domain. There are many internal difference existed in Chinese pitch. It is necessary to do a detailed decomposition of pitch change to analyze the various personality characteristics, so we can gain the specific differences from individual tones [1].
2.1. Fundamental Frequency Acquisition and Processing
Now there are many methods of pitch extraction, someone simply adopt to choosing syllable region directly and get the average value or measure harmonic wave frequency value sometime and divided by harmonic wave number then make data analysis. Someone use complex algorithm to extract the fundamental frequency and consider the noise resistance performance and other factors. The former method’s operation is simple but has large measurement error, and makes little sense for fundamental frequency comparison. The latter method has higher extraction precision but require complex algorithms and large number of data processing in later stage. However apply either algorithm to get fundamental tone periodic orbit that could not coincide with the true fundamental tone orbit perfectly. Based on this problem the author uses Praat software to make labeling and measuring analysis for fundamental frequency, adjust the curve data at same time to ensure smooth of the curve.
Averagely select 10 sampling points from pitch curve which been extraction and smoothed, measure their fundamental frequency value respectively. About the same tone we use length average value (L) to make normalization processing, and curve within L + 20% length range as the measuring object, in order to avoid the influence brought by time length of fundamental frequency [2].
The dots in this figure (Figure 1) mean fundamental frequency value of that time point which been analyzed by Praat program. If the fundamental frequency value is neat without sudden flip phenomenon, the analysis result is basically correct. If the fundamental frequency point free on the overall we need pay special attention and modification. Fundamental frequency value extraction errors typically occur near starting and ending position of fundamental frequency band. In addition if the fundamental frequency is relatively low or periodicity is not clear, that requires prior check about doubtful point of fundamental frequency value to ensure the error within 4 Hz and do the accurate measurement with the help of narrow-band speech map.
Direct measurements of the fundamental frequency data have some floating ranges that do not meet the speaker pitch characteristic of overall pronunciation. Now the scientific method is combined with Zhao Yuanren’s “five degree tone-marking method” as well as T value calculation formula of the tone pattern, to normalize the fundamental frequency data within 5 degree range. On fundamental frequency curve smoothing process, we find other types of curves appear the breakpoint region except the high-level tone curve. So consider the average value of high-level tone as the fundamental reference value to form pitch curve model is more accurate [3,4].
2.2. Pitch Pattern Curve Fitting
After data measurement and five degrees normalization processing, the fundamental frequency data can been multiple fitted directly through Excel for minimum radius of curvature, etc problems, thereby forming a smooth pitch pattern curve. Through the observation and comparison of the pitch pattern diagram, we can easily

Figure 1. Praat fundamental frequency label analysis.
summarize speaker’s pitch levels and characteristics. In addition to the comparison of their overall morphology change, also can make specific comparison analysis through parameters describe method. Such as, Upper limit value and lower limit value of pitch, average value of highlevel tone, initial and ending value of each curve, the slope rate of curves rising section and descending section, etc in the model. Otherwise special attention is need to the “elbow section” and “tail section” of the curve. Considering the starting and end point of pronunciation stability problem, when make comparing analysis we need to make the appropriate correction.
3. The Experiment and Analysis
By selecting different speaker to make normal and camouflage pronunciation from different corpus, we can analysis the fundamental frequency value change before and after camouflage, and use each corpus to fit their pitch model curve. We can research & analysis the pitch pattern curve shape stability and Feasibility using pitch patterns for speaker identification through comparative analysis the curve shape and pattern parameter of pitch.
3.1. The Experiment Corpus and Design
This experiment select 4 speakers (3 men and 1 women) to do normal and electroacoustic disguised pronunciation about 100 syllables within four tones, that we form 8 corpus including 400 syllables, numbered list is A, B, C, D, AW, BW, CW, DW. Select the professional recording studio as recording environment to ensure a high signal to noise ratio.
3.2. The Experiment Result Analysis@NolistTemp# The comparison of pitch model with same corpus contents between different speakers. Figure 2 is the pitch pattern curve selected from these four speakers’ normal
 (a)
(a) (b)
(b)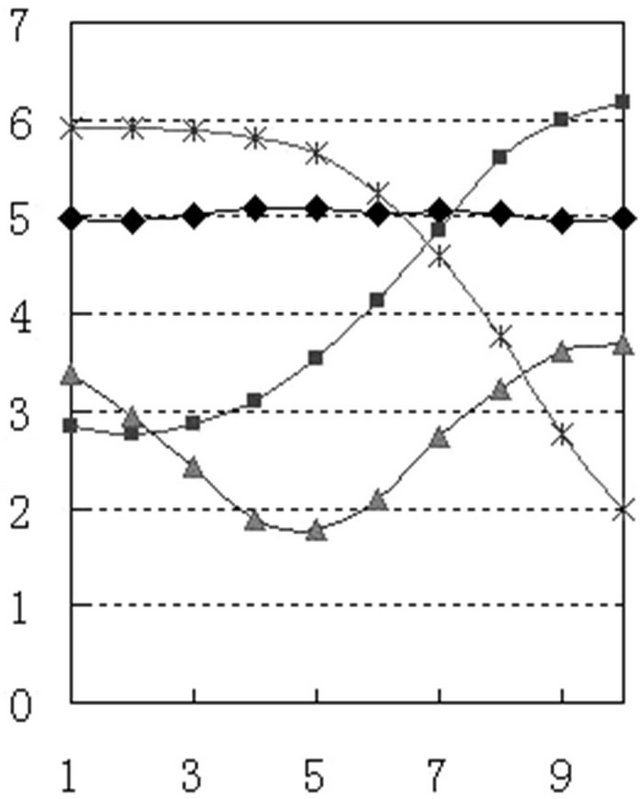 (c)
(c) (d)
(d)
Figure 2. Pitch pattern curve of four speakers’ normal pronunciation.
Comparison of four patterns can see that different speaker’s curve pattern has certain difference. (a) and (c) curved in the end compared with (b) and (d), that shows the former two speakers stop tone in rising tone end. (a) and (c) have obvious difference in the cross point of positive tone and falling-rising tone compared with (b) and (d). The former speaker’s parameter is above 4, especially (c), and the latter speaker’s parameter is under 4, especially (d). This parameter (Table 1) shows their difference in their positive sound rising speed or fallingrising tone falling speed. In addition there is obvious difference in blank area which formed by each speaker’s positive tone, rising tone and falling-rising tone curve crossed. This analysis results show that there is essential difference between each speaker’s pitch pattern curves (Table 2).
3.3. Fundamental Frequency Value Analysis before and after Disguised.
We respectively change the low tone and high tone of these four speaker using voice changer, measure the fundamental frequency value before and after voice change and make statistical analysis, the statistical standard deviation is less than 0.05. That result shows that fundamental frequency value before and after voice change and disguise have strong correlation, and have strong linear ratio relation that fundamental frequency value after voice change can go back to the original voice by multiple relations.

Table 1. Pitch pattern parameter of four corpus.

Table 2. Pitch pattern parameter of four corpus.
3.4. The Pitch Pattern Comparison of the Same Speaker’s Corpus before and after Disguised
Figures 3 and 4 are the pitch pattern curves respectively extracts from B and BW corpus. Although there are some differences between the two patterns, but from the overall shape and each pitch pattern parameters’ comparative analysis, the pitch pattern did not change their quality before and after camouflage, some difference was caused by measurement error. So, the speaker identification method using pitch pattern is applicable to voice change camouflage speech.
4. Conclusions
Chinese is a tone language, so comparative analysis for its pitch becomes important aspects of Implementation of speaker identification during judicial speech testing process, especially for speech camouflage, the comparative analysis of Chinese pitch pattern can more objectively and accurately reflect the speaker ‘s pitch variation.
This article combines with five degree tone-marking method and tone pattern theory, using Praat and Excel and other conventional software to realization of speaker’s pitch pattern measuring and fitting extraction. Based on statistical analysis of fundamental frequency values before and after voice change about every corpus, we know that speech fundamental frequencies before and after voice change exists strong linear ratio relation, and then respectively compared the pitch pattern of the same speaker in curve shape and model parameter before and after voice change. Comprehensive analysis of experimental results, I sum up that pitch patterns exist relatively stability of speaker-self, there are obvious difference in pitch pattern between different speakers. We can make speaker identification in electroacoustic disguised

Figure 3. Normal pitch pattern.
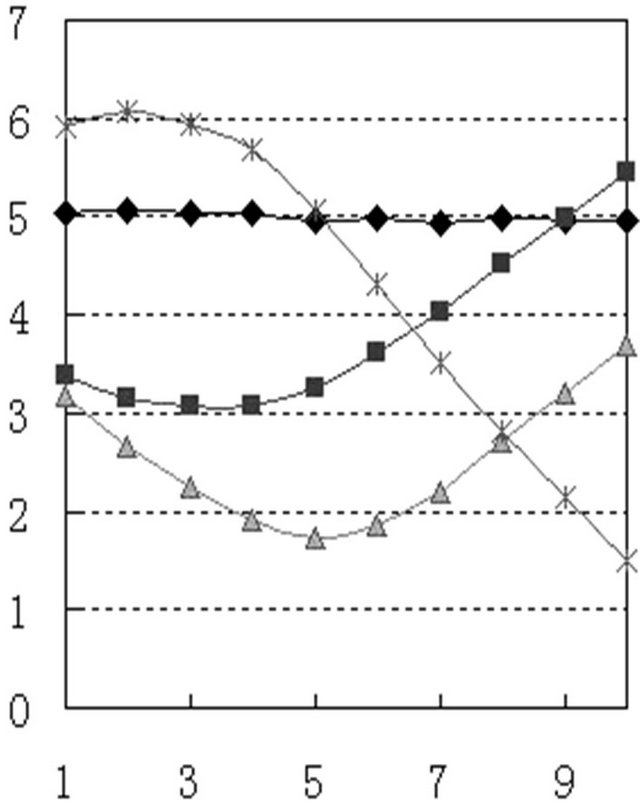
Figure 4. Disguised pitch pattern.
speech field in help with comparison of pitch patterns curve shape and parameter difference method.
REFERENCES
- G. Q. Zhang, Y. Z. Jin, H. W. Liu and X. Y. Cui, “Study on Changing Rules of Electronic Disguised Voice,” Evidence Science, Vol. 16, No. 4, 2010, pp. 10-11.
- W. W. Song and X. Y. Du, “A Simple Method about Third-Order Curve Fitting,” Information Technology, 2008, p. 6.
- Q. Q. Feng, “Experimental Study on the Pitch Pattern of Harbin Dialect,” Liaoning Technical University Journal (Social Sciences Version), Vol. 1, No. 2, 2008, pp. 5-7.
- L. Chen and X. W. Zhang, “A Novel Approach for Speech Camouflage Communication Based on Speech Quality Evaluation,” Signal Processing, Vol. 19. No. 5, 2003, pp. 23-25.