New Journal of Glass and Ceramics
Vol. 2 No. 4 (2012) , Article ID: 23627 , 6 pages DOI:10.4236/njgc.2012.24020
Glass Thickness and Fragmentation Behavior in Stressed Glasses
![]()
Glass Tech Research Center, Samsung Corning Precision Materials, Asan, Korea.
Email: *hoikwan.lee@samsung.com
Received July 4th, 2012; revised August 12th, 2012; accepted August 26th, 2012
Keywords: Fragmentation; Breakage Pattern; Residual Stress; Thin Tempered Glass; Fractured Surface
ABSTRACT
Breakage patterns, residual stress, and fractured surfaces on tempered glasses are investigated to find the correlation among glass thickness, tempered level, and the number of fragments, particularly when the glass thickness is less than 4 mm. Relatively thin glasses require high compressive stress for producing fragments, and the required compressive stress is increased with decreasing glass thickness (3.2 to 2.1 mm). By analyzing the residual stress of glasses before and after the fragmentation test, we observe that a relatively thin glass spends more stored energy to generate a new fracture surface and stores less energy for the second cracking as compared to thick glasses. Fractography shows that all glasses have a similar characterization on the fractured surface irrespective of glass thickness. However, the only difference is the depth of the compressive layer. By reducing the depth of the compressive layer to less than approx. 20% of the glass thickness, it is observed that the possibility of producing small fragments is dramatically decreased. Therefore, this study confirms that the compressive stress and its depth are essential as key factors contributing to the achievement of a relatively high fragmentation using a thin glass.
1. Introduction
The nature of fractures in tempered glass determines the glass’s degree of safety. The European Standard EN121 50-1 defines the minimum number of fragments required for soda-lime silicate safety glass on the basis of fragmentation test results. In an area of 50 mm × 50 mm, the number of fragments should be not less than 15 pcs, 40 pcs, and 30 pcs when the glass thicknesses are 3 mm, 4 - 12 mm, and 15 - 19 mm, respectively [1].
Several studies on the interrelation among tempered level, glass thickness, and the number of fragments have been reported since P. Acloque’s first report on the fragmentation test in 1956 [2-4]. The study described in this first report, however, did not provide readers with a clear answer to the abovementioned correlation [5]. In recent years, R. Tandon and S. J. Glass have studied the control of the fragmentation behavior of stressed glasses and reported that the size of fragments is inversely proportional to the square of the center tension and depends weakly on the thickness of the sample [6]. S. T. Gulati has developed an analytical model that helps predict the frangibility of tempered glass. According to his frangibility model based on certain assumptions, particle density is independent of glass thickness and depends on the 4th power of central tension. He has also pointed out that each of the fragments may still have residual central tension that is insufficient to sustain further crack branching [7]. The most recent study, which is the basis of an experiment, was reported by E. Mognato et al. They showed that the number of fragments is proportional to the surface compressive stress and the particle density is generally independent of the glass thickness when the thickness is within 4 - 10 mm [8].
Thus far, the calculations have been performed using a formula and an experiment to predict the interrelation among glass thickness, stress level, and the number of fragments. These reports reflect the correlations well in a wide range of considerations for theories and results. From a systematic review, we have found that there is a necessity to verify the interrelation when it comes to relatively thin glasses (<4 mm) because nowadays thin glasses are successfully tempered and are ready for use in reducing the weight and cost of glasses.
In this study, therefore, we first attempted to find the correlation among the thickness, stress level, and particle density of thin tempered glasses. The fragmentation behavior was observed as a function of glass thickness, and the residual stress on the fragments was measured for evaluating the stored energy and estimating the volume dependence of the residual stress. Lastly, the most likely key factors contributing to the fragmentation behavior of thin glasses are explained and carefully discussed.
2. Experiment
In order to study the interrelation among the glass thickness, compressive stress, and the number of fragments, soda-lime silicate float glasses having different thicknesses (2.1, 2.5, 2.8, and 3.2 mm) in sizes of 500 mm × 500 mm and 600 mm × 1100 mm were employed. The 2.1 mm-thick glasses were successfully tempered by using a thermal tempering machine that has a modified quenching system called air-mist quenching. The comnpressive stress of each sample was analyzed at a minimum of 5 spots using an edge stress meter (GES- 100-MWA, Strainoptic®, USA) and a strain viewer (FSM- 60LE, ORIHARA, Japan). For the fragmentation test, a sharp-hardened hammer was used. Two different spots, the center of a glass plate and the middle of the edge of a glass plate, were impacted, and the particle density in an area of 50 mm × 50 mm was measured around 200 mm from the fracture origin. Fractured surfaces were observed using an optical microscope to characterize the morphology as a function of the glass thickness.
3. Results
3.1. Investigation of Fragmentation Behavior in Tempered Thin Glasses
Figure 1 shows the pictures captured after the fragmentation test. Both of them have a similar compressive stress and the same dimensions except for glass thickness. The result reveals that there is a significant difference in their breakage patterns. The 3.2 mm-thick tempered glass exhibits a high particle density, whereas the 2.1 mm-thick tempered glass only has a few cracks.
For finding out the effect of the tempered level on the fragment density, a fragmentation test with highly tempered glasses as a function of thickness was carried out, and the results are summarized in Table 1. As given in Table 1, the results show that the number of fragments seems to be affected by the glass thickness and the tempered level. In the case of the 2.1 mm-thick glasses, most samples produced splines, which are long particles, and a few samples formed patchily countable breakage patterns. This implies that the compressive stress (138 MPa) of the 2.1 mm-thick glass is not sufficient to produce small fragments even though the stress level is 50% higher than that of the 3.2 mm-thick glasses; probably a considerably high level of compressive stress is required to produce the small fragments.
Nonetheless it should be noted that the 2.5 mm-thick
 (a)
(a) (b)
(b)
Figure 1. Comparison of breakage patterns observed in thermally tempered glasses with different thicknesses; the specimen has a dimension of 600 mm × 1100 mm. (a) 3.2 mm-thick glass with 90 - 100 MPa; (b) 2.1 mm-thick glass with 100 - 110 MPa.

Table 1. Correlation between compressive stress and fragments as a function of glass thickness.
tempered glass after improving its compressive stress exhibited behavior similar to the fragmentation behavior, and the 2.1 mm tempered glass also exhibited improved breakage patterns as compared to Figure 1(b).
Figure 2 shows the breakage patterns captured after the fragmentation test. As explained, all samples with thickness up to 2.8 mm satisfied the breakage patterns required for safety glass, and the average number of fragments was above 40 pcs. In the case of the 2.5 mm-thick glass, the overall breakage patterns were similar to those observed in the case of the 2.8 mm-thick glass. However, the fragments were simplified and relatively large as shown in Figure 2(c), and the number of fragments was in the range of 10 - 15 pcs. Figure 2(d) shows the most representative breakage pattern (splines) observed in the case of the 2.1 mm-thick tempered glass; barely countable breakage patterns were patchily obtained.
Figure 3 shows the relation between compressive stress and glass thickness plotted using the previously reported and the experimentally obtained data. Even though the number of data points was not sufficient to clearly verify the relation or extract a formula, we could use it to at least understand the tendency. With a decreasing glass thickness of less than 4 mm, the compressive stress for satisfying the fragmentation test increased. This implies that a thin glass needs a higher compressive stress than a thick glass in order to produce small fragments.
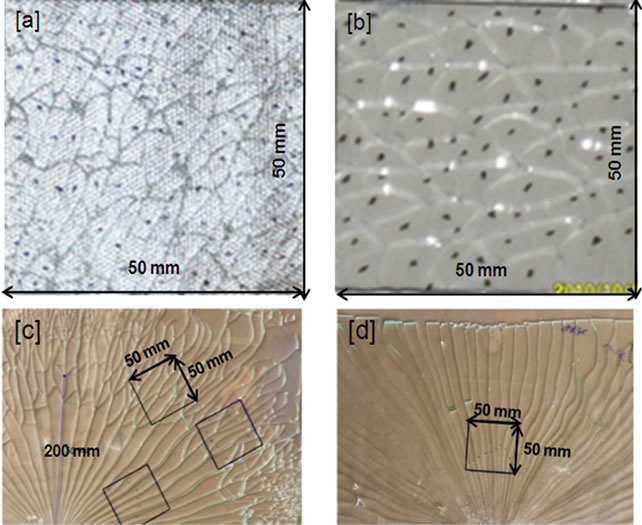
Figure 2. Observation of fragment patterns as a function of glass thickness corresponding to the sample set in Table 1. [a] 3.2 mm glass 90 ± 10 MPa; [b] 2.8 mm glass 109 ± 10.6 MPa; [c] 2.5 mm glass 133 ± 2.4 MPa; [d] 2.1 mm glass 138 ± 3.5 MPa.

Figure 3. Dependency of particle density on glass thickness and compressive stress.
3.2. Analysis of Residual Stress and Stored Energy on Fragments
To know why the thin tempered glasses did not produce fragments, the residual stress and the stored energy, which contribute to crack bifurcation, were investigated using fragments. Figure 4 shows the residual center tension as a function of the glass thickness and the volume of fragments. The relation between the volume of fragments and the center tension reflects that the residual center tension depends on the glass thickness rather than on the volume of fragments. It should be noted that each of the fragments still has residual center tension that is constituted of the stored energy and is not used for generating a new fracture surface. The point to note is that the stored energy is low in the case of a thin glass even though this glass does not exhibit the fragmentation behavior. The results reveal the assumption that the energy that should be stored to sustain further crack bifurcation is easily dissipated in thin glasses during early cracking.
Figure 5 shows the correlation among the central tension, stored energy, and glass thickness. Here, the central tension is measured in the fragments, and then, the stored

Figure 4. Residual center tension related to volume of fragments.

Figure 5. Glass thickness dependence of center stress and stored energy measured on fragments.
energy is calculated using this value [3,7]. As shown in Figure 5, both the central tension and the stored energy increase with an increase in the glass thickness.
In order to estimate the stored energy consumption during crack branching, the stored energy before and after the fragmentation test is calculated and summarized in Table 2. In the calculation, the volume of fragments is replaced with the glass thickness because the volume of fragments is not related to the central tension, as shown in Figure 4. The result reveals that the stored tensile strain energy in the body is used up for generating new fracture surfaces during the fragmentation process. In the case of the 2.8 mm-thick and 3.2 mm-thick glasses, approx. 86.33% and 76.91% of the stored energy in the tensile region is consumed for generating new fracture surfaces, whereas in the case of the 2.1 mm-thick and 2.5 mm-thick glasses used approx. 97.89% and 96.78% of their stored energy is consumed for the crack bifurcation, respectively. This implies that the stored energy consumption of the relatively thin glasses is considerably higher than that of the relatively thick glasses. In other words, the relatively thin glasses cannot keep the stored energy in the body during the fragmentation process.
3.3. Analysis of Fractured Surfaces
In order to figure out why the thin glasses have a poor ability to retain the stored energy and why they use most of the energy for the early cracking, the fractured surface was studied carefully. In Figure 6, the photos of the fractured surface show half of the entire glass thickness. As seen, three different zones characterized as the compressive zone, the smooth zone, and the rough zone, are identical for all samples irrespective of the glass thickness. River-line-like scratches on the compressive zone and Waller-line-like parabolic on the smooth zone reveal the crack propagation direction in each zone. Mist and Hackle on the rough zone indicate a complex fracture process. The topography indicates that there must be a radical change among these three zones.
Under normal tempering conditions, the depth of the compression layer is typically fixed at approx. 42% (21% on each side) of the glass thickness, assuming that the classical parabolic strain profile is frozen in the glass during quenching [14]. However, the depth of the compression layer measured in this experiment did not reach the above-mentioned value, as summarized in Table 3. The depth of the compression layer decreased from 30.7% to 13.1% when the glass thickness was decreased. Considering the result of the fragmentation test given in Table 3, we think of that the depth of the compressive layer should be thicker than at least 20% (10% on each side) of the glass thickness in order to obtain the fragmentation behavior.

Table 2. Analysis of stored energy before and after fragmentation test.

Figure 6. Comparison of fractured surface as a function of glass thickness; the left side of each picture is glass surface and the right side is the middle of the glass. [a] 3.2 mm; [b] 2.8 mm; [c] 2.5 mm; [d] 2.1 mm.
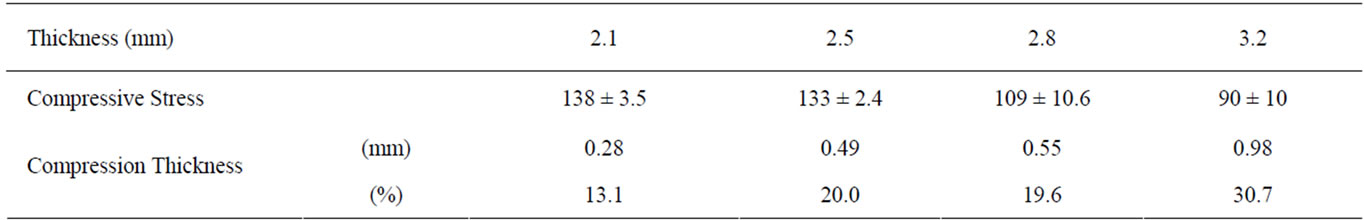
Table 3. Comparison of compression layer as a function of glass thickness.
In order to further investigate the fractured surface in detail, compressive zones are magnified as shown in Figure 7. Slightly below the glass surface (left side of each picture), river lines that indicate the crack propagating direction and support the hypothesis that an interior fracture leads to the fragmentation process are observed. Next to the river lines, there is a smooth surface called the clear zone. It should be noted that the clear zone is not formed or is very weak in the case of the 2.1 mm-thick tempered glasses that have a thin compressive layer. According to Hull, the clear zone indicates a relatively low crack velocity and a relatively low energy release rate [9,10]. In other words, it may be assumed that the existence of the clear zone probably makes crack bifurcation possible by controlling the release rate of the stored elastic energy.
4. Discussions
The fragmentation behavior of thin glasses (<4 mm) was investigated in order to understand the effect of glass thickness on the particle density. 3.2 mm-thick and 2.85 mm-thick thermally tempered glasses were powdered to produce small fragments much more than 40 pcs in an area of 50 mm × 50 mm. When the glass thickness was decreased to 2.5 mm, the breakage patterns were simplified even though the glass was thermally tempered well, and the glass’s particle density was in the range of 10 - 15 pcs. In the case of the 2.1 mm-thick glass, a barely countable breakage pattern was obtained and splines were observed. The above-mentioned results led to the idea that there is a relation between glass thickness and fragmentation behavior, particularly in the case when the glass is thinner than 4 mm. Figure 3 plotted with previously reported and experimentally obtained data supported our expectation, and the plot showed that the compressive stress required for a successful fragmentation test increased when the glass thickness decreased to less than 4 mm.
From the viewpoint of stored elastic energy, in order to find why thin glasses need a considerably high compressive stress, the residual stress and the stored energy related to the crack bifurcation were investigated using the fragments as a function of the glass thickness. The fragments retained their residual stress after the fragmentation test as reported by Gulati [7]. The data showed

Figure 7. Comparison of compressive zone as a function glass thickness. [a] 3.2 mm; [b] 2.8 mm; [c] 2.5 mm; [d] 2.1 mm.
that the residual stress depended on the glass thickness rather than on the volume of fragments. The important point to be noted is that the thin glass consumed more stored energy for the first cracking than the relatively thick glass even though it had a high stored energy. This indicated that the relatively thick glass could retain the stored energy in the body during and after the fragmentation process, and the thin glass could not be powdered because most of its stored energy was consumed for the first cracking and the remaining energy was not sufficient for the second cracking. To find out why the thin glass had a poor ability to retain the stored energy, the fractured surface was observed in detail. Irrespective of the glass thickness, the fractured surface of the tempered glasses had three different zones, namely compression zone, smooth zone (Wallner line), and rough zone (Mist and Hackle). The first clear difference that we found was that the glasses exhibiting the fragmentation behavior had a minimum depth of the compressive layer (approx. 20% of the glass thickness). The second point that we observed was that the clear zone right in front of the river line was not observed in the 2.1 mm-thick tempered glass. According to Hull [9], the clear zone next to the river line indicated a relatively low velocity and a relatively low energy release rate. These results suggested that the reason that the thin glass did not produce a considerable particle density could be related to the depth of the compression layer of the tempered glass and the existence of the clear zone. The other evidence that strongly supported our expectations was reported by Rajan Tandon et al. [6] who observed the fragmentation behavior as a function of the ion exchange time. In their experiment, the fragmentation behavior was initiated after some hours of the ion exchange process and the particle size decreased with an increase in the time of the ion exchange process. This implied that a specific level of the compressive stress was required to begin the continuous crack bifurcation because the stress level increased with an increase in the ion exchange time. However, their report was based on two facts that should not be ignored. First, the compressive stress level was saturated, and it deteriorated because of the structural relaxation after the ion exchange process was carried out for a considerable period of time. Second, the invadingion penetration (the depth of the compressive stress) increased as the square root of time. These observations implied that both the stress level and the depth of the compressive stress were key factors in deciding the fragmentation behavior of tempered glasses, and the size of fragments may be more influenced by the depth of the compressive layer because there was an increase in the net compressive force when the exchanged depth was increased.
Therefore, this study confirmed the key factors that contributed to the fragmentation behavior of thin glasses, such as the depth of the compressive layer, the level of compressive stress, and the existence of the clear zone. It was essential that the glasses had an adequate depth of the compressive layer (approx. 20% of the cross section) as well as a high compressive stress. Here, the depth of the compressive layer and the fragmentation behavior were most likely dependent on the glass thickness when the glass thickness was thinner than 4 mm.
5. Conclusion
With reducing glass thickness, the breakage patterns of tempered glasses get simplified and finally the splines are produced even though thin glasses have a much higher compressive stress than the ones of thick glasses. The analysis of stored energy shows that relatively thin glass spends more energy to produce a new fracture surface and stores less energy for the second cracking. Based on the fractography study, it draws a conclusion that the energy storage ability of thin tempered glass presumably concerned with the depth of the compressive layer. To produce small particles after Fragmentation testthe adequate depth of compressive layer (more than approx. 20% of the glass thickness) is required.
REFERENCES
- Comité Européen de Normalisation (CEN), “EN 12150 European Standard: Glass in Building Thermally Toughened Soda-Lime Silicate Glass, Part 1-2,” Comité Européen de Normalisation, Brussels, 2000.
- P. Acloque, “Deferred Processes in the Fragmentation of Tempered Glass,” Proceedings of the 4th International Glass Congress, Vol. 6, 1956, pp. 279-291.
- J. M. Barsom, “Fracture of Tempered Glass,” Journal of the American Ceramic Society, Vol. 51, No. 2, 1968, pp. 75- 78. doi:10.1111/j.1151-2916.1968.tb11840.x
- K. Akeyosh and E. Kanai, “Mechanical Properties of Tempered Glass,” Proceedings of the 7th International Glass Congress, Vol. 14, 1965, pp. 80-85.
- A. I. Shuto, P. B. Popov and A. B. Bubeev, “Prediction of the Character of Tempered Glass Fracture,” Glass and Ceramics, Vol. 55, No. 1-2, 1998, pp. 8-10. doi:10.1007/BF03180135
- R. Tandon and S. J. Glass, “Fracture Mechanics of Ceramics; Active Materials, Nanoscale Materials, Composites, Glass, and Fundamentals,” Springer, Vol. 14, 2005, pp. 77-92.
- S. T. Gulati, “Frangibility of Tempered Soda-Lime Glass Sheet,” Glass Performance Days, 1997, pp. 13-15.
- E. Mognato, A. Barbieri, M. Schiavonato and M. Pace, “Thermally Toughened Safety Glass: Correlation between Flexural Strength, Fragmentation and Surface Compressive Stress,” Glass Performance Days, 2011, pp. 115-118.
- D. Hull, “Fractography-Observing, Measuring and Interpreting Fracture Surface to Topography,” Cambridge University Press, Cambridge, 1999, pp. 91-150.
- J. H. Nielsen, J. F. Olesen and H. Stang, “The Fracture Process of Tempered Soda-Lime-Silicate Glass,” Experimental Mechanics, Vol. 49, No. 6, 2009, pp. 855-870. doi:10.1007/s11340-008-9200-y
- K. Akeyoshi, “Report of the Research Laboratory,” Asahi Glass Company, Ltd., Vol. 17, No. 1, 1967, pp. 23-36.
- M. Schiavonato, E. Mognato and A. S. Redner, “Stress Measurement, Fragmentation and Mechanical Strength,” Glass Performance Days, 2005, pp. 92-95.
- H. Hessenkemper, “Kosten und Qualitätssituation für PVGläer,” Engineered Transparency—International Conference at Glasstec, Düsseldorf, 29-30 September 2010.
- A. S. Redner, E. Mognato and M. Schiavonato, “Correlation between Strength and Measured Residual Stress in Tempered Glass Products,” Journal of ASTM International, Vol. 2, No. 3, 2005, pp. 85-94. doi:10.1520/JAI12565
NOTES
*Corresponding author.