Journal of Environmental Protection
Vol. 3 No. 8A (2012) , Article ID: 21783 , 10 pages DOI:10.4236/jep.2012.328111
Statistical Analysis of Bursa Nilüfer Creek’s Water Quality Parameters for Period of 2002-2010
![]()
1Department of Environmental Engineering, Institute of Science, Uludağ University, Bursa, Turkey; 2Department of Environmental Engineering, Faculty of Engineering and Architecture, Uludağ University, Bursa, Turkey; 3Department of Econometrics, Faculty of Administrative Sciences, Uludağ University, Bursa, Turkey; 4Department of Environmental Engineering, Faculty of Engineering, Anadolu University, Eskişehir, Turkey.
Email: *karaer@uludag.edu.tr
Received June 4th, 2012; revised July 7th, 2012; accepted August 8th, 2012
Keywords: Water Quality; Nilüfer Creek; Statistical Method; Principal Component Analysis
ABSTRACT
Increasing contamination of water resources in the world and our country and decreasing water quality over time, not having met the objectives of utilization of water resources; it has increased the importance of water management. The monitoring of the water resources and evaluation of these monitoring results have given direction to the studies’ outcome in order to control factors that pollute water resources and reduce water quality. Nilüfer Creek is very important for both being a source of drinking and potable water and a discharge area for wastewaters for the city of Bursa. In this study, the results of the analysis belonging to the period between 2002-2010 which are taken from 15 points by General Directorate of Bursa Water and Sewerage Administration (BUWSA) were evaluated in relation to water quality of the Nilüfer Creek. Non-parametric methods were used in the evaluation of the water quality data due to the lack of normally distributed data. The identification of the best represented parameters of the water quality was provided by applying Principal Component Analysis. According to results of the analysis, the best representative 9 parameters from the 19 water quality parameters were defined as parameters of BOD5, COD, TSS, T.Fe, Zn, conductivity, NO2-N, Ni and NO3-N that taking part of the first two components.
1. Introduction
Today, as a result of increased agricultural and industrial uses, with increased pollution of drinking water and use of water sources, as well as decreased water quality, utilization of the water resources purposes have become insufficient or enter below the threshold, together with rapid population growth and industrialization in developing countries.
Water resources are a natural wealth that should be used for long-term stability [1]. It is important to reveal the quality status of water resources and to protect the good quality conditions, in addition to increase the status of water resources in good condition, if they are not in good condition. Therefore, carrying out and evaluating studies are necessary to efficiently guide monitoring the quality status of the water resources.
One of the most important inputs of the developing process of countries is the management of water resources in a successful way and consequently creating the most advanced utilization level from water. Nowadays, the successful management of water resources, first of all, depends on the existence of the water quality observations that are provided the sufficient information about these resources [2].
For protecting the rivers that provide the substantial portion of the needed water for domestic, industrial and agricultural use, there has to be monitoring of the water quality and determination of the changes in the quality. Only in this way, healthy and economical water quality management can be carried out, and both for current and future periods such management can be obtained to protect water resources in efficient ways [3].
The most important stage in the process of data analysis is to determine appropriate statistical techniques for the data and the purpose of the study. To determine the most appropriate statistical technique in the process of data analysis, primarily the objective of the research, the sampling method, type of variables (dependent—independent, qualitative—quantitative), measuring the level of the dependent variables (nominal, ordinal, interval, ratio), parametric and nonparametric test conditions, compared groups (sample) or measurements (independent groups, associated measurements), number of compared groups or measurements, the number of subjects in each group and so on issues should be taken into account [4].
Engineering applications and data sets for comparison of data sets with each other, representing the change in values, knowledge and determination of the average around the central tendency (median, mode, arithmetic mean, etc.) and measures of dispersion (variance, standard deviation, coefficient of variation, etc.) is required. In this way, it can be possible, to evaluate the data set [5].
Whereas univariate analyses examine the effect of a single factor only, a large number of variables are used in multivariate statistical analyses which attempt to analyze the real impact of all of them and the relation between each other. To make the events more simple, to classify units examined, to destroy the dependence structure between variables and to reduce the size can be made by using multivariate statistical analyze. In many cases the objective is to reveal the relationship between the variables by reducing from the large number of variables to the small number of variables [6]. Principal Component Analysis, the best sequence of an axis or axes that will represent within the multi-dimensional area relationship between the types on the type of display, is based on projections [7].
Multivariate statistical analysis is a set of developed methods to examine according to the information concerning the structure of the nature of the problem and to reach solutions, taking into account examined internal and external f actors of in and around a large number of events. Considering an analyzed variable in detail, does not show by itself independently of the nature of the dispersion. More or less, it is changing/relating with a variable. When examining a variable, via this variable it is not possible to accept or take control of the fixed/ uniformity all of other variables (factor, condition). This change of conditions to include problem-solving should take advantage of multivariate statistics to achieve realistic solutions. Principal Components Analysis is a utilized method that in order to obtain a variable with p > 2 data matrices are associated with each other, independently of each other and to a lesser number of new data structures. It is used to derive new variables that have fewer and no correlation between them, from the data which have high level of correlation between them and to make data reduction [8].
Regarding observations, this is a collection of a large number of the data matrix which includes X data consisting of n observations and p variables. The axes of the shape cannot be perpendicular to each other and cannot define because there cannot be complete independence between the variables in question. On the other hand, axes perpendicular to each other will provide more information. For this purpose, it is provided that the axes perpendicular to each other provide that they have not changed the total variance of points along the first axis by making a transformation. Also, in this proposed method by Harold Hotelling standardized Z data matrix is used [9].
Tpxp to the transformation matrix,
 (1)
(1)
is expressed in the form. In other words, Y values which are not related to each other are obtained from Z values associated with each other.
By using this information, important components of equation are obtained by using Eigen values. Many methods have been developed for determining the number of these basic components. According to the most simple method used, m is the number of Eigen values greater than one and
 (2)
(2)
provided the condition of the smallest value of m determines recognized as important the number of principal components. In short, the basic components approach is used to eliminate the dependency structure and for the purposes of dimensionality reduction.
A part of the original variables related to the existing knowledge can be lost and/or neglected as a result of a lower dimensional space representation, summarizing of the data expressed in the form of size reduction or data reduction [10].
It is suggested to use a smaller number of Principal Component instead of using p units original variable to analyze the data if an important part of the total variance in the data as disclosed by a small number of Principal Component [11]. If they are fully correlated with each other of the original variables, it is explained the all of the variance in the first Principal Component data. In other words, when the relationship between the variables increases, also the degree of data reduction increases equally [12]. Thus, in case of the original variables correlated high degree with each others, it is possible to reduce very few variables without having significant loss of many variables information [10]. In order to interpret correctly and effectively by use of Principal Components Analysis the ratio of the first two or three components of the total variation must be greater than 25% [13].
The purpose of this study is to apply Principal Component Analysis being multivariate statistical analysis methods on to the 19 parameters of Nilüfer Creek Water Quality. Water quality parameters were taken annually from 15 monitoring points by General Directorate of Bursa Water and Sewerage Administration (BUWSA) during 2002-2010.
2. Materials and Method
2.1. Study Area and Sampling Points
Nilüfer Creek which is one of the most important rivers of Marmara Region, has a great importance in terms of being a source of drinking water for the city of Bursa, as well as facilitating the majority of wastewater being discharged to the receiving environment. Nilüfer Creek, in particular as a result of these discharges was faced with very intense pollution. In this situation, water quality of Nilüfer has been degraded over the years, and Nilüfer ceases to be a clean and livable place as before. Reduction has been in the quality of agricultural products irrigated with water from the river, the number of people consuming these products, and also use of this river’s water has distorted their health. Moreover, the odor problem has negatively affected the public around the river, together with heavy pollution in the river.
Turkey’s water basins are shown in Figure 1 [14]. Nilüfer Creek is located in Susurluk Basin which has a flow potential of 5.43 km3 per year and has also 2.9% of the water potential of Turkey’s rivers.
Nilüfer Creek, which is born in the southern slopes of Uludağ mountain and fed by many streams, is watering plains of Bursa and Karacabey. As a result of domestic and industrial wastewater discharges, especially made into it, the creek was faced with very intense pollution. The creek’s water quality, due to domestic, industrial and agricultural reasons has decreased from the source to the end. Polluting elements in the Nilüfer Creek are: wastewaters resulting from residential areas without water treatment plant and reaching to the creek, wastewaters based on non-measures treatment industry, pollution from agricultural sources to reach the creek, disposal of solid waste to the river and transferring pollution resulting from the atmosphere to the creek with rainfall.
Waste Water Treatment Plants (WWTP) constructed in order to improve water quality in Nilüfer Creek are [15];
1) Constructed and operated by the General Directorate of Bursa Water and Sewerage Administration, East WWTP (240.000 m3/day capacity)—West WWTP (87.500 m3/day capacity) that urban wastewater is collected and purified in the western and eastern basins of the city center;
2) 48.000 m3/day capacity 2 units Bursa Organized Industrial Zone WWTP;
3) Demirtas Organized Industrial District WWTP with a capacity of 70.000 m3/day;
4) NOSAB chemical wastewater treatment plant with a capacity of 720 m3/day;
5) Yesil Cevre Cooperative Wastewater Treatment Plant constructed in order to purify domestic and Industrial wastewaters coming from Gürsu and Kestel Organized Industrial Zones and wastewater resulting from firms that are located in the same region but outside the organized industrial zones, with a capacity of 55.000 m3/day;
5) Natural Treatment Systems constructed by the Directorate of Special Provincial Administration;
6) Water quality of Nilüfer Creek is monitored by the General Directorate of BUWSA at 15 points. Nilüfer Creek Water Quality Monitoring Points are shown in Figure 2.
The main information on the points enumerated as follows:
Point 1: On the Nil. creek, after participation of Hasanaga Stream (downstream), Point 2: Hasanaga Stream, Point 3: On the Nil. creek, after participation of Ayvalı Stream, Point 4: On the Ayvalı Stream, before discharge

Figure 1. Water basins of turkey.
of West WWTP, Point 5: On the Ayvalı Stream, after discharge of West WWTP, Point 6: On the Ayvalı Stream, Point 7: On the Nil. creek, before participation of Ayvalı Stream, Point 8: On the Nil. creek, Gumustepe location (upstream), Point 9: Cilimboz Stream, Point 10: On the Nil. creek, after participation of Cilimboz Stream Point 11: Panayır Stream, Point 12: Gokdere Stream, Point 13: Kaplıkaya Stream, Point 14: On the Delicay Stream, before discharge of East WWTP, Point 15: After discharge of East WWTP [16].
The first 15 points’ water quality was monitored beginning from the years 1998-1999 and the data has been collected more systematic since 2002. Therefore, the data regarding these points was evaluated at assessable quality. In this study, Principal Component Analysis that among the methods of multivariate statistical analysis have been applied to Nilüfer Creek which holds an important place for the city of Bursa. Water quality parameters have systematically monitored and measured by the General Directorate of BUWSA since 2002. A reduction of size has been done for the period of 2002-2006 and 2007-2010 and the quality of the water is tried to express together with fewer components in the analysis. Determining of the best representative water quality parameters is aimed before and after commissioning of the Urban Wastewater Treatment Plants.
2.2. Method of Analysis
In this study, Principal Component Analysis that among the methods of multivariate statistical analysis have been applied to the observation values made up the annual average and obtained the period of 2002-2010 and 19 parameters that taken sample from 15 measuring points by BUWSA and are shown in Figure 2 indicated the water quality of Bursa Nilüfer Creek. Thus, it is tried to reach the best representative parameters that are the fewer numbers and immeasurable structures, of Nilüfer Creek water quality and to explain the water quality of the measurement points on the basis of these components. Also, the data is divided in two groups as 2002-2006 data period and 2007-2010 data period for the purpose of explaining the effect on the best representative parameters of the water quality of the wastewater treatment plants stream due to commissioning of West and East Urban Wastewater Treatment Plants after 2006. It is tried to determine the structural impact of the treatment plant on the quality of the water so the first period, expressed the period of not having the treatments plants, the second period indicated the next period after the treatments plants. The annual averages are used in the 15 measuring points as an indicator of the water quality including 19 parameters (variable) the period of 2002-2006 and 2007- 2010. Thus, the role of all the measured values is ensured to represent the water quality [16].
SPSS 18.0 program is implemented to the data related to the parameters of Nilüfer Creek water quality using the data in the period of 2002-2006 and 2007-2010. Using Analyze > Dimension Reduction > Factor > command in the program, Varimax Rotation option is applied as an Extraction method together with Unrotated factor solution option and Principal Component Analysis. As a result of the analysis, common variance values, the values of the total explained variances, rotated Principal Component matrices, and three Principal Component values were assessed.
3. Results and Discussion
For two data period in the period of 2002-2010, the descriptive statistics related to the average values in the Tables 1 and 2 and the correlation matrices of these variables (parameters) in Tables 3 and 4 are given in two separate periods in the Nilüfer Creek water quality monitoring points.
N column located in the Tables 1 and 2 refers to the

Figure 2. Buwsa Nilüfer creek water quality monitoring points.

Table 1. Descriptive statistics related to the average values of the parameters of Nilüfer Creek Water Quality Monitoring Points during 2002-2006 (units of the parameters are shown as μs/cm for conductivity and mg/L for all the other parameters).

Table 2. Descriptive statistics related to the average values of the parameters of Nilüfer Creek Water Quality Monitoring Points during 2007-2010 (units of the parameters are shown as μs/cm for conductivity and mg/L for all other parameters).

Table 3. Correlation matrix related to the average values of the parameters of nilüfer Creek Water Quality Monitoring Points during 2002-2006.

Table 4. Correlation matrix related to the average values of the parameters of nilüfer Creek Water Quality Monitoring Points during 2007-2010.
15 measurement points. Range column, value of Xmax - Xmin, is shown the range of propagation of the each parameter. Having a lot of variables of the wide range value, is shown the variation of parameters due to anthropogenic factors household, industrial and agricultural origin in the measurement points. Std. Deviation value indicates the variability of the all measuring points however range values of the parameters only specifying the difference between the end points. M column indicates the average values of the 19 parameters in the measurement points. Skewness column that is a measure of asymmetry, states right oblique (skew) in case of the positive (+) value and left oblique (skew) in case of the negative (−) value of the series. Observation values are added to the minor data in the right oblique series, to the major data in the left oblique series. If the values are closer to 0, it indicates that the series (data) are symmetric. Kurtosis value, is a kurtosis measure, represents sharpness or kurtosis of the parameters. This value shows that the series are sharp when it is positive or kurtosis when it is negative. A series of sharp indicates the high frequency of the observation values close to each other and a series of kurtosis show the low frequency of observation values close to each other.
The parameters are close to each other values due to the low standard deviations of the heavy metal parameters shown in the tables, and height standard deviation of Conductivity, BOD, COD and TSS parameters state that very different values between the each other as a point.
The high correlation especially between the BOD5, COD and TSS parameters in the Tables 3 and 4 emerges as a natural result arising from the character of the parameters.
Common Variance Values related to the average values of the parameters during 2002-2010 was shown in Table 5.
According to the findings in the Tables 6 and 7, it is possible to say that 6 Principal Component is derived and these components can be used as water quality parameter. The first core value is 5.595 from the six main components; the first Principal Component of the total variance explains 29.447% percent (5.595/19). Percentage of variance explained by other components, respectively were obtained in the form 20.040%, 12.353%, 8.309%, 8.127% and 7.083%. Thus, the total variance of 6 items explains a significant proportion of 85.363% [(5.595 + 3.808 + 2.347 + 1.579 + 1.544 + 1.346)/19]. Similarly, the total explained variance values for the period 2007-2010 has been obtained as in the Table 7. In addition, the variance of the square of the standard deviation is calculated in the Tables 1 and 2, the variance of the conductivity variable explains a significant portion of the total variance. COD, TSS and BOD5 parameter follows this variable.

Table 5. Common Variance Values related to the average values of the parameters of Nilüfer Creek Water Quality Monitoring Points during 2002-2010.
On the other hand, during the period of 2007-2010 covering the period after the establishment of treatment plants, the first component is composed of BOD5, COD, TSS, T.Fe variables, 2nd component is composed of Zn, conductivity, NO2-N, Ni, NO3-N, 3rd component is composed of Pb, Sb, Cu, variables, 4th component is composed of Cd, T.Cr, Al variables, 5th component is composed of B, As, Sn variables and 6th component is composed of Mn variables.
For the best representation of water quality parameters of the Nilüfer Creek, the components which their Eigen value is greater than 1 were determined. These parameters converted with Principal Components Analysis, those Principal components were shown in the Table 8.
According to the results of the analysis, 85.4% and 86% of the Nilüfer Creek water quality can be represented by the 6 obtained Principal Component. It can be said that water quality of each main component of the creek released up to the total explained variance in Tables 6 and 7. As a result of the analysis, 29.4% and 32.7% of the water quality even appears to represent the

Table 6. Total explained variance values related to the average values of the parameters of Nilüfer Creek Water Quality Monitoring Points during 2002-2006.

Table 7. Total explained variance values related to the average values of the parameters of Nilüfer Creek Water Quality Monitoring Points during 2007-2010.
1st component in both sampling periods. Due to the necessity of being larger proportion of the total variation in the first 2 or 3 items than 25%, it is possible to interpret the results of analysis in order to use the Principal Component Analysis effectively. Six Principal Component, parameters of the components (variables) and the percentages of the variance components are summarized in Table 9 for the two-sample (data) period.
4. Conclusion
According to the findings, there are significant changes in the components of the parameter that best represents the quality of water after the operation of treatment plants. However, especially BOD5, COD and TSS parameters that intensively used for expression of the water quality appear as a natural result taking place in the first component in both periods, show the analysis implemented effectively. One of the findings acquired as a result of the analysis is the Cd, Pb, T. Fe, Ni, NO2-N parameters become better representative parameters of water quality and the parameters of Sb, Mn, Al, B, As become less represents the water quality after commissioning the
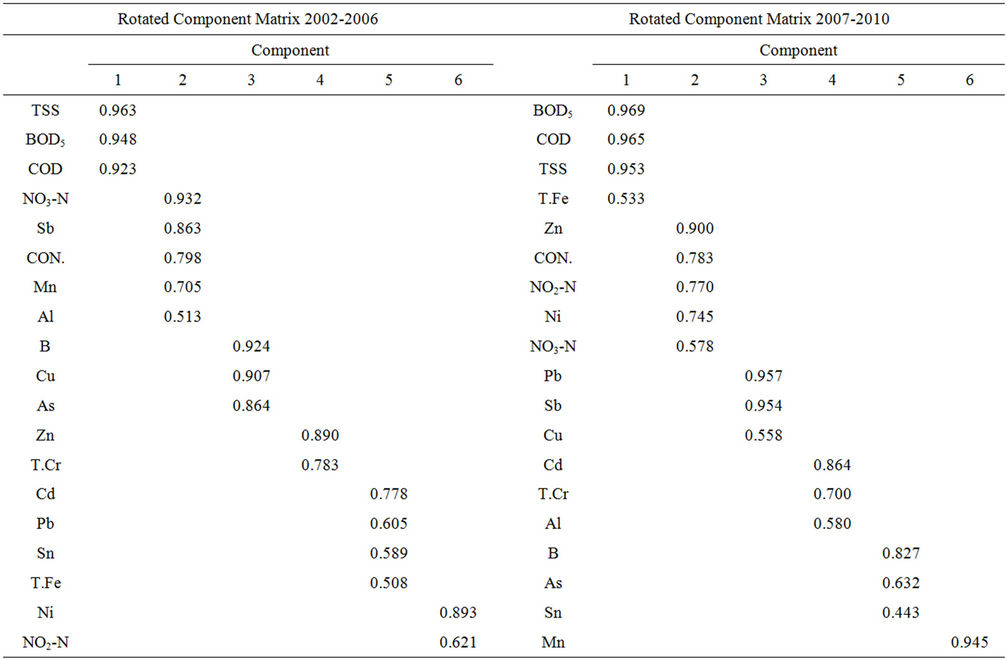
Table 8. Rotated principal component matrices related to the average values of the parameters of nilüfer Creek Water Quality Monitoring Points during 2002-2010.

Table 9. Principal component for the period of 2002-2006 and 2007-2010.
Urban Waste Water Treatment Plants. The result of the analysis was found significant for the years 2007-2010 because of the next period after commissioning Urban Waste Water Treatment Plant and belonging to the last 4 years. According to this result, 9 parameters that best represents the water quality from the 19 parameters were determined as the parameters which BOD5, COD, TSS, T.Fe, Zn, conductivity, NO2-N, Ni, and NO3-N that take part the first 2 Components. When taking into consideration T.Fe parameter in the first component showed that industrial character began to gain importance besides residential character after commissioning Urban Waste Water Treatment Plants. In addition, the selection of 12 parameters in the first 3 components represented 64.19% of water quality in the creek, 15 parameters in the first 4 components represented 72.53%, 18 parameters in the first 5 components represented 80.10%, and 19 parameters in the first 6 components represented 86%. In this context, the first 9 parameters were found to be important for the monitoring of the water quality at the monitoring stations.
REFERENCES
- H. Kalyoncu, B. Yorulmaz, M. Barlas, Z. Yıldırım and M. Zeybek, “Water Quality of Aksu Stream and Effect of Physicochemical Parameters on the Macroinvertebrate Diversity,” Science and Engineering Journal of Fırat University, Vol. 20, No. 1, 2008, pp. 23-33.
- N. Alpaslan and N. Harmancıoğlu, “Basic Approaches of Designing Water Quality Watching Net,” Turkey Civil Engineering XII, Technical Congress, 1999.
- E. Albek and S. Göncü, “Investigation of the Long-Term Suspended Solids Trends in Turkish Streams,” Anadolu University Journal of Science and Technology, Vol. 6, No. 2, 2005, pp. 183-190.
- A. Ural and İ. Kılıç, “Scientific Research Processes and Data Analysis by SPSS,” Detay Press, Ankara, 2006.
- E. McBean and F. Rovers, “Statistical Procedures for Analysis of Environmental Monitoring Data & Risk Assessment,” Prentice-Hall Inc., USA, 1998.
- H. Küçükönder, E. Efe, E. Akyol, M. Şahin and F. Üçkardeş, “The Use of Multivariate Statistical Analysis in Animal Science,” 4th National Zootechny Science Congress, Paper Book, Isparta, 1-4 September 2004, pp. 550- 555.
- V. Gözen, “Morphologic Characterization in Hybrid Greenhouse Cucumber (Cucumis sativus L.) Breeding and Determination of Appropriate Hybrid Combinations and Hybrid Seed Quality,” PhD Thesis, University Institute of Science, Ankara University, 2008.
- K. Özdamar, “Statistical Data Analysis by Package Programmes,” Kaan Press, Eskişehir, 2010.
- A. Ünsal and S. Duman, “Analysis of Principal Component Approach of Bank’s Performance in Türkiye,” 7th National Econometry and Statistic Symposium, 2005, pp. 1-20.
- K.-C. Li, “Sliced Inverse Regression for Dimension Reduction,” Journal of the American Association, Vol. 86, No. 414, 1991, pp. 316-327. doi:10.1080/01621459.1991.10475035
- E. Işığıçok, “Determination of 100 Big Textile Companies According Principal Component Analysis at Bursa,” Journal of Marmara University, Social Science Journal, 1999, pp. 127-128.
- S. Sharma, “Applied Multivared Techniques,” John Wiley & Sons Inc., Canada, 1996.
- S. A. Mohammadi and B. Prasanna, “Analysis of Genetic Diversity in Crop Plants,” Salient Statistical Tools and Considerations, Crop Science, Vol. 43, 2003, pp. 1235- 1248.
- Ş. Kara, “Nilüfer Creek Basin, Specialties, Water Hydraulic Works Projects and Evaluations of Water Quality,” 2nd Bursa Water Symposium, 2010.
- www.bursacevreorman.gov.tr.
- BUSKİ General Directorate Data, 2010.
NOTES
*Corresponding author.