Advances in Chemical Engineering and Science
Vol. 2 No. 1 (2012) , Article ID: 16722 , 7 pages DOI:10.4236/aces.2012.21016
Experimental Study of Drying Process of COLZA Seeds in Fluidized Bed Dryer by Statistical Methods
1Department of Mechanical Engineering, Hormozgan University, Bandar Abbas, Iran
2Department of Mechanical Engineering, Islamic Azad University, Roudan Branch, Roudan, Iran
Email: hasan.davari163@gmail.com
Received November 23, 2011; revised December 20, 2011; accepted December 30, 2011
Keywords: Fluidized Bed; Drying Process; Colza Seeds; Heat Transfer; Regression Model
ABSTRACT
In this study the effect of initial parameters such as inlet gas temperature, initial particles temperature and gas velocity on temperature changes of solid particles and outlet gas temperature in a fluidized bed dryer was studied. For testing, an experimental setup was established. With combination of air and Colza seeds belonging to D groups of the Geldart classification (Geldart, 1986) fluidization regime was carried out. With five test series with maintaining the inlet gas temperature, solid particle temperature and outlet gas temperature during time were carefully measured. To analyze these data by using regression analysis to predict solid particle and outlet gas temperature, 2 correlations on initial parameters were presented. The result has shown that temperature gradients in the beginning of fluidization, is very high and therefore the exponential functions in the regression model is used to predict the temperature changes.
1. Introduction
Fluidization is the phenomenon in which solid particles in a gas or a liquid type are suspended and it has many applications in many physical, chemical industries. One of the most prevalent implementation of this phenomenon is to dry granular seed. Fluidized bed dryers have many usages in chemical, agricultural and medical industries. The Major reason to use such dryers in those industries is:
1) Height heat and mass transfer coefficients due to gas-solid contact;
2) High quality in produced products because of harmony and solid-gas proper mixture;
3) They are suitable for operations in great scale;
4) They have low service and maintenance cost;
5) Gas flow voids particles crack and fraction.
High application of such dryers has led to many researches in this field which mostly are depended an experimental equations and today many experimental equations are available to predict heat and mass transfer coefficients provided from these researches. The significant point is that in all of these researches, every equation has been presented in specific condition limit of fluidization regime type so conditions dominated on problem have significant importance to use these equations because every equation has validity on specific domain of particles type, fluidization regime, specific pressure and temperature.
Geldart categorized for the time fluidization regimes of solid-gas in to 4 groups A, B, C, and D by running precise tests [1]. These classifications are based on density, solid particle diameters, gas density. In Figure 1 you can see related diagram about this classification. Botteril et al. analyzed pressure effect on heat transfer coefficient between bed and a suspended surface [2]. The results showed that temperance transference coefficient between a bed and a suspended surface increased as bed pressure enhanced. Also results proved that pressure effect on heat transfer coefficient reduced as particle size is decreased.
Hariprasad et al. evaluated temperature effect on minimum fluidization velocity (Umf) in their study [3]. They ran the tests for 9 kinds of different particles belonged to group B of Geldart classification at thermal range of 298 to 973 Kelvin and calculated minimum fluidization velocity and presented equations for Umf. In performed tests, experimental data belonged to Umf compared to other equations which were obtained by other researchers.
Rizzi et al. [4] used a laboratory device to evaluate heat transfer in a fluidized bed containing grass seeds which belonged to group D of Geldart classification and finally presented an equation to predict heat transfer coefficient based on Reyrold number. Following to Khorshidi et al. reformed modeling and applied more proper

Figure 1. Geldart classification diagram.
equations and used the same data to analyze heat transference phenomenon in such dryers [5].
Our purpose in this research is to evaluate variations of temperature in one fluidized bed dryer contains Colza seeds belonged to group D of Geldart classification by experimental tests in order to present temperature variation which Manifests high rate of heat transfer in such dryer.
To analyze provides data we applied statistical method based on Regression model which is used to point out to studies related to variables relations and it was expanded for the first time by Karl Pearson for statistical context.
2. Materials and Methods
2.1. Particle Characterization
The consumed seed for these tests was Colza seed. Oily seeds are the secondary consumable global sources after cereals. Colza or Canola is the scientific name for Brassica Napus which is the third oily plant in the world Colza seed contain 40% to 45% oil and 30% to 35% proteins and because of so it is considered as one of the most important oily seed in the world. Colza oil mainly used in nutritive, color, chemical, lubrication, Soap, knitting and leather industries. In 1957 in Canada, the first oily Colza regenerated by a few amount of Oursic acid. To produce Colza as much as possible during 1965, thousands hectares of Canada fields were used specifically to till this plant. In 1971 span type, the first variated with low oursic acid and three years later after tower type with little Oursize acid and Glucoseinolat as the first Kahola variations were introduced. Kanola some was registered in 1978 by Canadian oil extracting institute. Several methods are used to dry such oily seeds but Gazor et al. (2008) proved in their study that fluidization method for this grain drying has had developmental effect on some of quality specifications of extracted oil like color and acidity in addition to drying time meaningful reduction.
2.2. Experimental Setup
For experimental modeling in this research, an experimental setup which makes a fluidized bed was established, this device contains a compressor with 2 hp power capability that inters air with controlled pressure and flow in to an electric heater by 1000 Watt power and then send it in to a cylindrical chamber in which there is fluidized bed. This system has controllers for pressure and temperature to measure and control them in different sections. This cylindrical bed diameter is 3 cm with external diameter of 3.5 cm made of glass with two holes that one of them is located to install solid particles temperature sensor at 2 cm stature and second holes is located at 12 cm height for outlet gas temperature sensor to receive data from the bed. By 4 thermocouple type K with 0.1 accuracy on centigrade, the electronic heater temperature, and inlet gas temperature, solid particles and outlet gas temperatures are measured. To control inlet gas temperature to the bed a PID1 controller is used. To prevent thermal loss, fiber glass has been used as thermal isolation of bed walls. We use a distributor plate in the bed to make a uniform gas flow. This plate has holes reticulatedly with 1 mm diameter and 1 cm thickness. To weight solid particles a digital balance with 0.01 gram precision (model Scont Pro Spu 902) has been used. In following picture you can see schematic (Figure 2) of this device:
The physical properties of Colza seeds and the Geometric properties of the bed used in the experiments are shown in Table 1.
In Experimental modeling, solid particles temperature (TS) and outlet gas temperature from bed (Tgl) during 20 minutes have been registered by keeping inlet gas temperature steady and fixed. Also we measure velocity and fluidization high and repeat tests for different inlet gas temperatures and velocity for 5 conditions and then registered the results should be pointed that all experimental data are provided in bubbling regime. In Table 2 you can see operational conditions of experiments.
Data related to solid particle temperature and outlet gas temperature from bed are obtained in a condition at which inlet gas from bed are obtained in a condition where inlet gas temperature is kept stable by controller system by 0.1 precision and because of bed isolation, there is no thermal losses from bed zone.
3. Results and Discussion
3.1. Descriptive Statistics
As Table 3 shows solid particles mean temperature is 42.43 and out let gas mean temperature is 40.95 and in

Figure 2. Experimental setup.
1. Compressor; 2. Gage pressure; 3. Flow control valve; 4. Pressure regulator; 5. Flow control valve; 6. Flow meter; 7. Gage pressure; 8. Electrical heater; 9. Heater temperature sensor; 10. Inlet gas temperature sensor; 11. Distributor plate; 12. Solid temperature sensor; 13. Outlet temperature sensor; 14. Glass column; 15. Gage pressure; 16. Flow control valve; 17. Orifice plate; 18. Heater temperature recorder; 19. Inlet gas temperature recorder; 20. Solid temperature recorder; 21. Outlet gas temperature recorder; 22. Temperature controller.
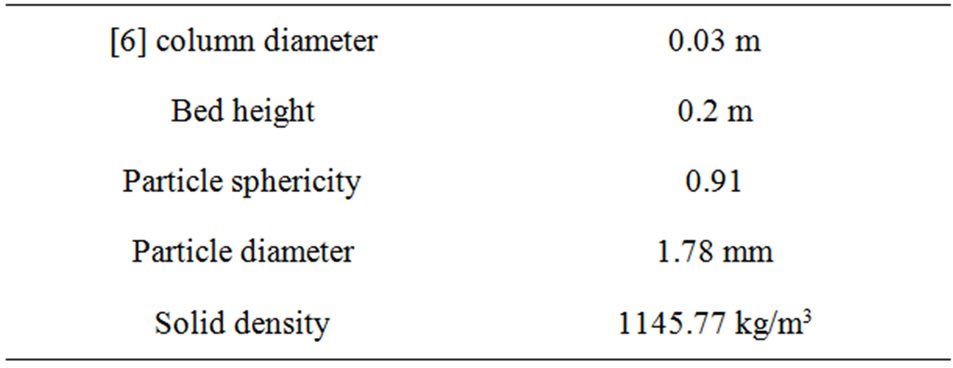
Table 1. Physical and geometrical properties of the bed and the seed.

Table 2. Operational conditions of experiments.
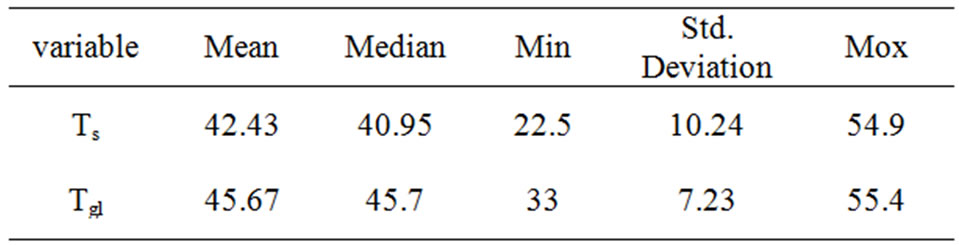
Table 3. Descriptive Statistics of variation.
50% of tests outlet gas temperature was lower than 45.7 and temperature variation coefficient for solid particles was 24% and variation coefficient for outlet gas was 16%.
3.2. Correlation Coefficients
According to Table 4 it is clarified surely that 99% of solid particle temperature has had meaningful relation with primary parameters and surely 99% of outlet gas has meaningful relation with primary parameters (P < 0.01). Also the relation between solid particles temperature and time is 99% meaningful surely (P < 0.05).
Table 5 is obtained by Stepwise method. After elimination of test beginning time, following results obtained: in the first step of Regression, inlet gas temperature variable which has the highest meaningful correlation with solid particle temperature has been entered in to model, in second step time variable, in third step gas velocity and in fourth step solid particles primary temperature have been added to Regression model. As it is obvious in Table 5 in forth step, F value has been calculated 1072.9 for Regression model and obtained which is meaningful in a = 0.01 level (P = 0.000 < 0.01), in other word solid particles temperature is predictable 99% by the use of primary parameters and time surely. Also in

Table 4. Pearson Correlation between solid particles and outlet gas temperature, initial parameters and time.

Table 5. Regression correlation between solid particles temperature with initial parameter and time.
final step t certain number has been calculated for Regression coefficients in a = 0.01 which had been meaningful and meaninglessness assumption about Regression coefficients are rejected, so Regression model could be written as below:
 (1)
(1)
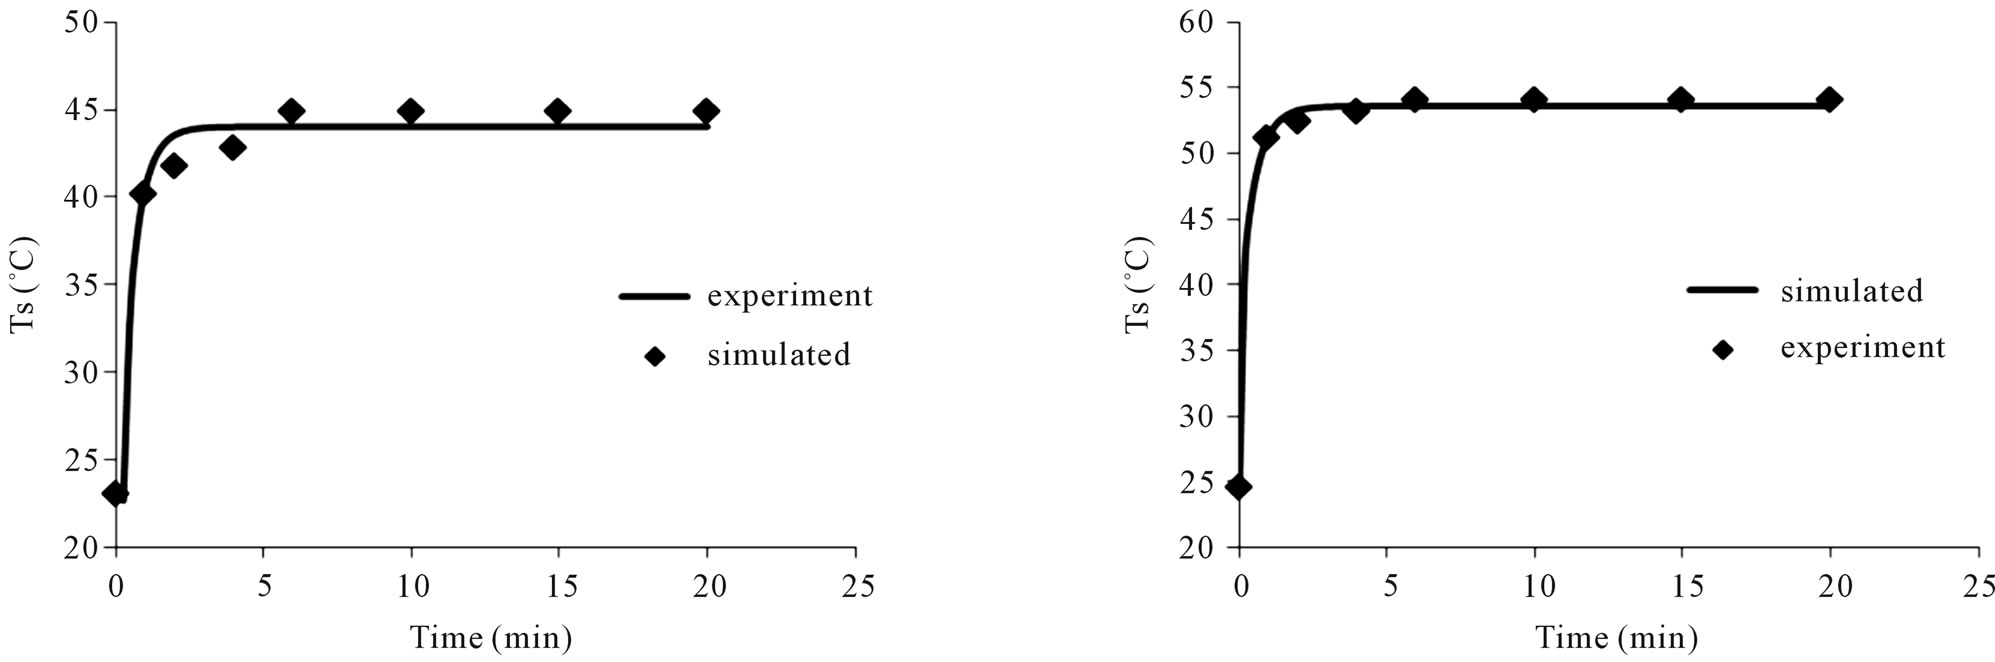
Also 99/3% of solid particles temperature prediction are provided by the implementation of primary parameters and time to analyze residual independency, DurbinWatson statistic is used on a way that if this statistic rate is more than 1.5 and lower than 2.5 we can accept residuals independence. Because Durbin-Watson statistic is obtained as 1.55 we can conclude that residuals independency assumption is acceptable. To analyze residual normalization, Kolmogrov-Smirnov test has been used meaningful level was 0.274 about this test which shows accepted assumption about residuals normalization. In Figure 3 you can see results of simulation for solid particles temperature beside experimental data which are drawn for tests 1, 4.
Note Mentioned figure is made by stepwise method application. In first step of Regression, inlet gas primary temperature variable which has the highest meaningful correlation which solid articles temperature is entered in to the model, in second step time variable, in third step velocity variable and in fourth step temperature variable for solid particles are added to Regression model. As it is obvious in Table 6 F rate is calculated in fourth step for Regression model and 296/2 has been obtained as the result which is meaningful at a = 0/01 (P = 0.000 < 0.01), in other word with 99% assurance, outlet gas temperature is predictable by the use of primary parameters and time. Also in final step t calculated value is meaningful for Regression coefficients at a = 0.01 and Regression coefficient meaninglessness is rejected, so it is possible to write Regression model as below:
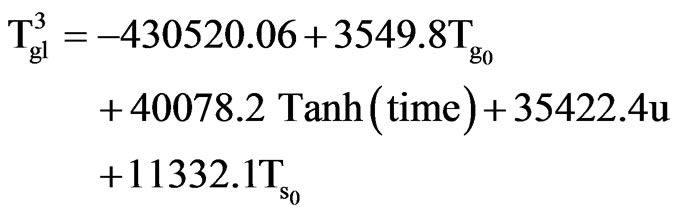 (2)
(2)
Also 97.1% of outlet gas prediction is determined by time and primary parameters. Because Durbin-Watson statistic is 1.53, we can conclude that residuals independency is accepted. Also meaningfulness level for Kolmogrov-Smirnov test is 0.086 which shows residuals normalization assumption has been accepted at a = 0.01 in Figure 4 you can see results about outlet gas simulation beside experimental data for test 1, 4.
 (a) (b)
Figure 3. Comparison between experimental and simulated data for solid particle temperature: (a) Test #1; (b) Test #4.
 (a) (b)
Figure 4. Comparison between experimental and simulated data for outlet gas temperature: (a) Test #1; (b) Test #4.
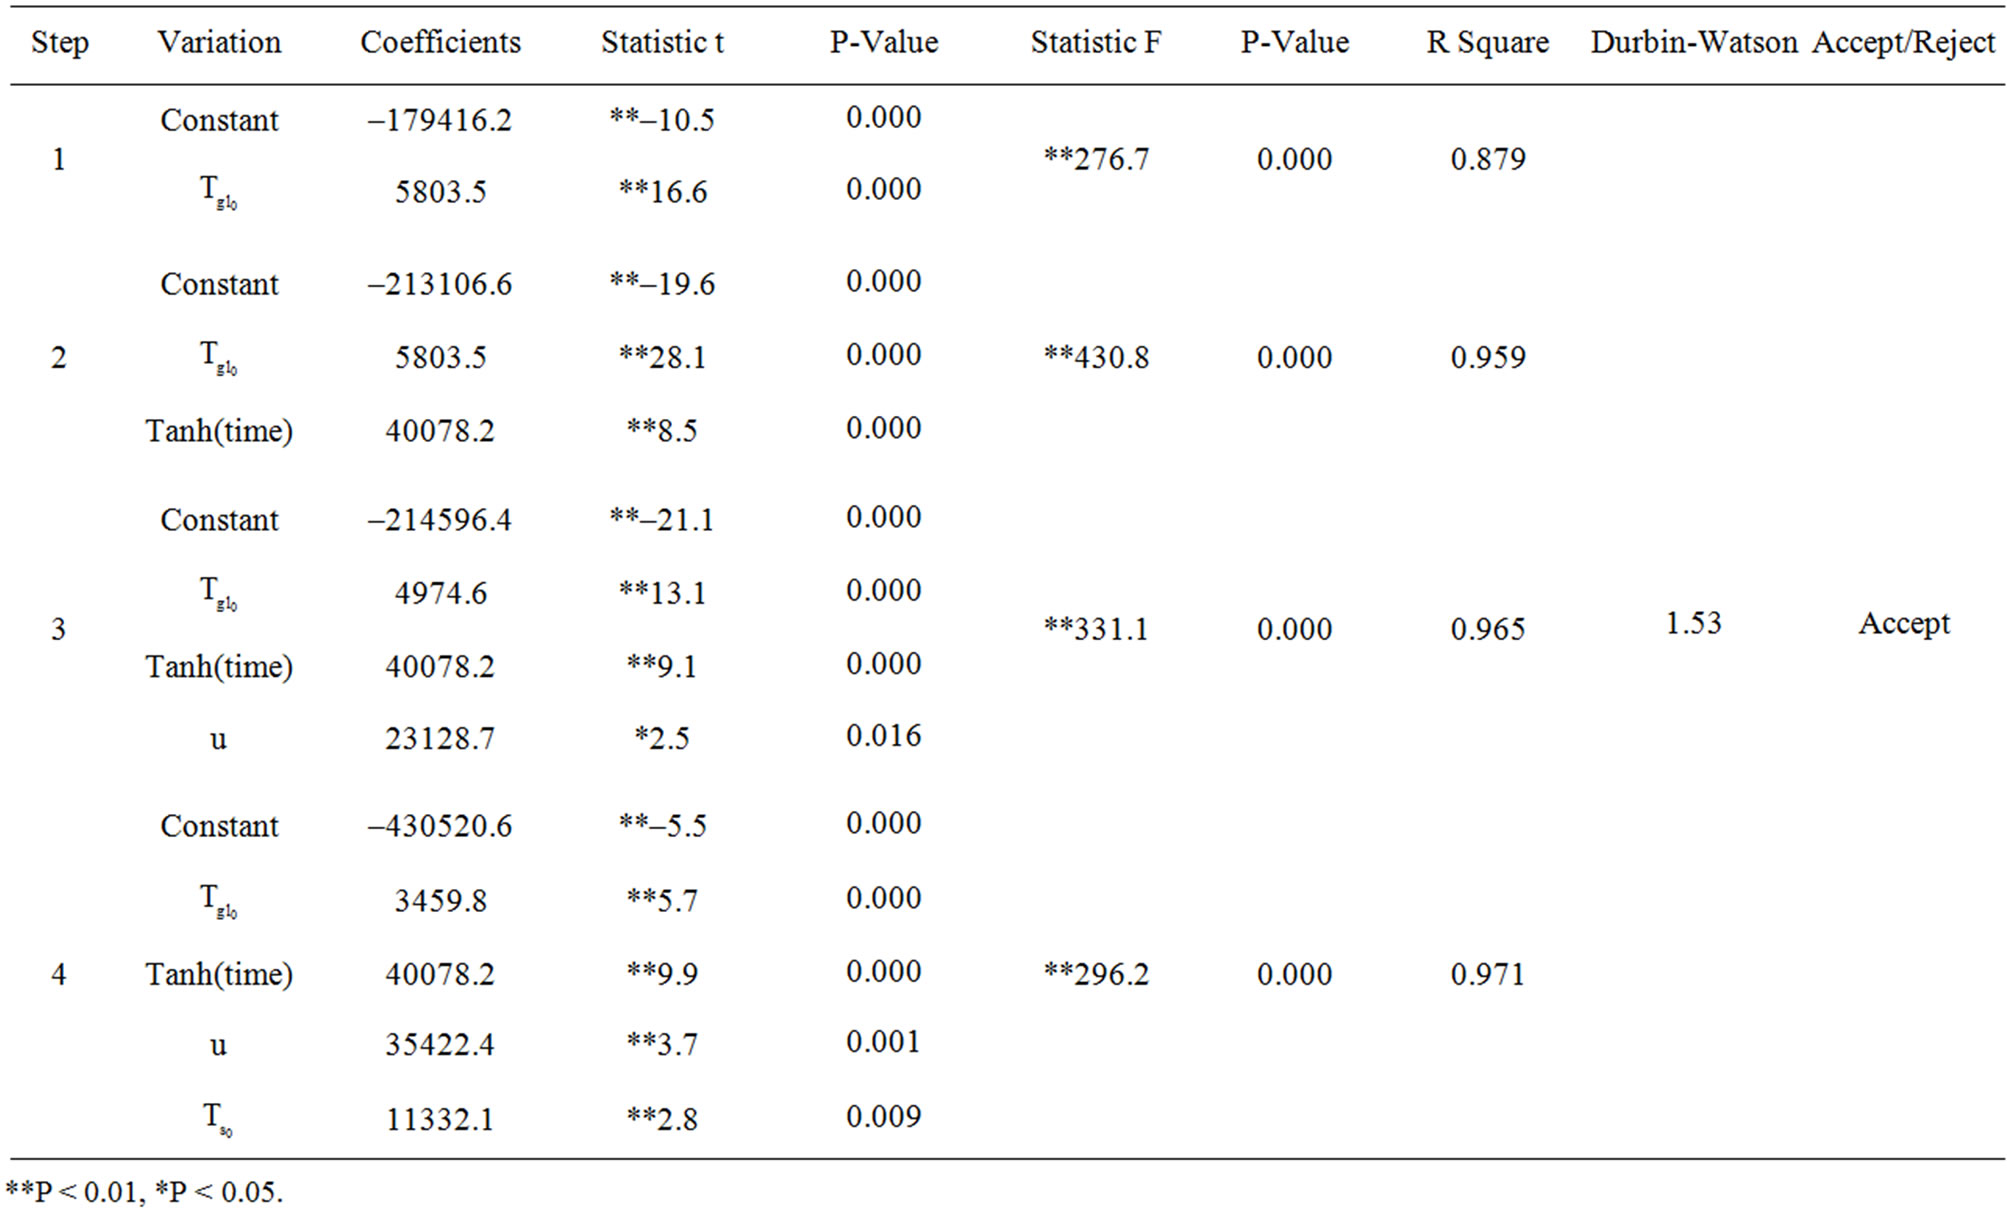
Table 6. Regression correlation between outlet gas temperature with initial parameter and time.
4. Conclusions
In this research we have used an experimental setup to evaluate initial parameters effects on temperature variation process in solid-gas fluidized bed dryers in which a fluidization regime is made by air and solid combination and 5 series of test performed to analyze bed internal temperature variation and in every test inlet gas temperature is kept steady with high precision and solid particles and outlet gas temperature were registered during time, then Regression method applied to analyze experimental data. Results obtained from this study shows: 1) The maximum solid particles temperature variation and outlet gas temperature variation occur at the beginning of fluidization which show high heat transfer in these kinds of dryers. 2) Because of high temperature variations curve declivity, exponential functions are used to predict temperature variation in Regression model. Equations precision is very high to the point Regression equation given for solid particles temperature variation bas 99% conformity with experimental data precisely and presented equation accuracy for outlet gas temperature is about 97%. 3) Solid particles temperature variation velocity during time is more than variations related to outlet gas. 4) After passage from unsteady condition, solid particles temperature and outlet gas temperature from bed inclined to each other. 5) The most effective parameter on heat transfer, is the inlet gas temperature to bed and solid particles primary temperature; and inlet gas velocity effect is lower.
REFERENCES
- K. Diazo and L. Octave, “Fluidization Engineering,” 2nd Edition, Butterworth, Heinemann, 1991.
- V. João, F. A. Biscaia Jr., C. Evaristo and M. Giulio, “Modeling of Biomass Drying in Fluidized Bed,” Proceedings of the 14th International Drying Symposium, São Paulo, 22-25 August 2004, pp. 1104-1111.
- H. Subramani, M. B. Mothivel and M. Lima, “Minimum Fluidization Velocity at Elevated Temperatures for Geldart’s Group-B Powders,” Experimental Thermal and Fluid Science, Vol. 32, No. 1, 2007, pp. 166-173.
- A. C. Rizzi Jr., M. L. Passos and J. T. Freire, “Modeling and Simulating the Drying of Grass Seeds (Brachiaria brizantha) in Fluidized Beds: Evaluation of Heat Transfer Coefficient,” Brazilian Journal of Chemical Engineering, Vol. 26, No. 3, 2009, pp. 545-554. doi: 10.1590/S0104-66322009000300010
- J. Khorshidi, H. Davari and F. Dehbozorgi, “Model Making for Heat Transfer in a Fluidized Bed Dryer,” Journal of Basic & Applied Sciences, Vol. 1, No. 10, 2011, pp. 1732-1738.
- S. Minaei and E. Hazbavi, “Determination and Investigation of Some Physical Properties of Seven Variety Rapeseed,” Iranian Journal of Food Science and Technology, Vol. 5, No. 4, 2008, pp. 21-28.
Nomenclature

NOTES
1Proportional-Integral-Derivative.