Journal of Biomedical Science and Engineering
Vol. 5 No. 12A (2012) , Article ID: 26260 , 9 pages DOI:10.4236/jbise.2012.512A108
Magnetic resonance spectroscopy in the diagnosis and follow-up of brain tumors*
![]()
1Department of Radiology and Medical Imaging, University Hospital of Fez, Fez, Morocco
2Department of Biophysics and Clinical MRI Methods, Faculty of Medicine, Fez, Morocco
Email: #sboujraf@gmail.com
Received 11 September 2012; revised 25 October 2012; accepted 13 December 2012
Keywords: Brain Tumour; Magnetic Resonance Spectroscopy; Assessment
ABSTRACT
Magnetic Resonance Spectroscopy (MRS) is nowadays considered as a main MRI investigation modality in the clinical routine jointly with conventional anatomical and functional magnetic resonance imaging for studying brain tumours. MRS provides complementary information about cellular metabolism. This allows differentiating the brain tumours from abscess, the diagnosis of the tumour type, characterization of brain tumours, as well as local study of the morphological abnormalities observed in conventional MRI. The MRS could be used in the therapeutic follow-up for evaluating the pathological active area of brain, and allows optimizing the guided biopsy as well as to differentiating recurrent tumour from a necrosis.
1. INTRODUCTION
The magnetic resonance spectroscopy (MRS) is mainly used in biology and in medicine, this investigation modality reports major information about the cellular metabolism. Indeed, tissues are constituted by specific metabolites with concentration varying according to their clinical conditions. In fact, this technique constitutes a unique non-invasive tool to detect and to quantify the anatomical cellular metabolic processes real time.
The MRS provides large information on the metabolic characteristics of brain tumors. The localized MRS identifies the global properties while the MR spectroscopic imaging used recently provides more information about the regional and metabolic heterogeneity within tumors. These MRS features would underline the considered importance of the magnetic resonance spectroscopy as a feasible investigation approach in clinical routine. Nowadays, this examination that is achievable in less than 15 minutes could offer valuable clinical information allowing more precise diagnosis. These includes: differentiating the brain tumors from abscesses [1-4], to define the tumoral characteristic of the investigated lesion and better characterization of brain tumors [5-9], and establishing an extended local assessment of within morphological abnormalities observed in conventional MRI [10-14].
MRS is also used by clinicians for the therapeutic follow-up to estimate the most active area in lesion, to guide and optimize the biopsy, and to differentiate the recurrent tumor a radionecrosis [15-18]. This technique is useful in radiosurgery as a criterion for indicating to increase or decreases the irradiation during tumor radiotherapy [19].
2. TECHNICAL ASPECTS OF MR SPECTROSCOPY SIGNAL
The MRS allows visualizing information expressed by proton resonance frequencies of metabolites, by eliminating signal resulting from water protons. It is a detailed analysis of the frequencies of echo of atom molecules of the same type in a different chemical environment.
The major technical difficulty of MR spectroscopy is obtaining a homogeneous magnetic field. Indeed, the accuracy of the MR spectra is directly dependent of the magnetic field homogeneity, the resonance spectra is larger an imperfect magnetic field homogeneity. The surface of each resonance spectra is proportional to the proton density, lager spectra has decreased intensity which produces reduced signal-to-noise ratio. Furthermore, larger resonance spectra lead to an overlapping of spectrum yielded by element with close chemical shifts. Therefore, it is difficult to homogenize the magnetic field within the volume of interest. Hence, the homogeneity of the magnetic field is a major critical component for the MR spectroscopy.
3. MAGNETIC RESONANCE SPECTROSCOPY IN PRACTICE
In MR spectroscopy, two main techniques are used:
The signal of monovoxel MR Spectroscopy is collected from the single voxel signal. This MR spectroscopy acquisition is lasting 2.30 to 3.40 minutes, and the spectra is immediately available at the end of the acquisition, the acquired data provides limited information about the fraction of the cerebral parenchyma included in the voxel.
The metabolic imaging is known also as chemical shift imaging (CSI). The acquired spectra can be two-or threedimensional coving all the tumor volume. This acquisition method consists of recording the magnetic resonance spectroscopic information from one or several slices. This acquisition method provides more valuable information compared to the monovoxel MR spectroscopy. However, the acquisition time is longer and lasts about 5 to 10 minutes. The recorded data has to be transferred to a console for offline post-processing. Afterwards, it is possible to combine the reference MR image data with MR spectra; hence visualizing the spectra of the region of interest suitable for the required study. It is also possible to calculate and display the metabolic result maps corresponding to the distribution of metabolites or metabolic ratio on high resolution MR image.
In the mean time, it is to mention that a complete examination with specific indication using MRS and MRSI is still lasting a relatively a long time varying between 5 and 45 minutes. In addition, claustrophobic and metal implants patients are difficult to admit for MRS and MRSI exploration.
4. THE MAIN METABOLITES VISIBLE IN PROTON MRS
Spectra are obtained in the human brain within an echo time lasting 135 to 288 ms and allow detecting several resonance elements [20-23]:
˗ N-Acetyl Aspartate (NAA) chemical shift is 2.02 ppm. The presence of this amino-acid within neuronal tissue (neuron bodies and axons) conjugated also to the absence in the pure glial tissue. The NAA is considered as a quantitative marker of neuronal suffering.
˗ Creatine/phosphocreatine (Cr), chemical shift is 3.02 ppm and it allows to follow the metabolism energy since it is a good marker of the global metabolism.
˗ Choline/phosphatidylcholine (Cho) chemical shift is 3.2 ppm. These metabolites are involved in the metabolism and structures of phospholipides membranes; they are considered as a marker of suffering membranes. They are increased in demyelinisation processes as well as during all cellular proliferation processes such as cellular death or of destruction of membranes.
˗ The lactate, (Lac) chemical shift is 1.35 ppm. It occurs with wider spectrum. Its concentration is very low in normal condition, and strongly raised in anaerobic conditions reflecting underlined ischemia or hypoxia phenomena.
˗ Free amino acids chemical shift is 0.9 ppm. The spectrum is observed in case of pyogenic abscess and in metabolic diseases such aminoacidopathies.
˗ The alanine is detected in 1.5 ppm. It reflects the intermediate metabolism disorder.
During the MRS acquisitions with short echo time ranging between 20 and 40 ms) the spectra become complicated and other metabolites are detected including:
˗ The glutamate (Glu) is excitatory neurotransmitter associated with Glutamine (Gln), they increase in the ammonium metabolism abnormalities. It has q chemical shift of 2.2 and 2.6 ppm respectively and situated on the left of the NAA spectrum.
˗ The myo-inositol has a chemical shift of 3.6 ppm. It is a sugar found only in the glia and is a glial suffering marker. It increases during process involving a glial activation or a gliosis.
˗ Free lipids (Lip) chemical shift is ranging between 0.9 and 1.3 ppm. They are associated with cellular necrosis, and making very important markers of brain tumors of high grade and also ischemic stroke.
˗ The taurine is an amino-acid involved in the osmoregulation and is detectable at 3.3 ppm.
˗ The alanine is detected with chemical shift of 1.48 ppm. Its occurrence is associated to the respective medulloblastoma and meningioma diagnoses.
5. THE DIFFERENTIAL DIAGNOSIS BETWEEN ABSCESS AND BRAIN TUMORS
Literature reports described the interesting role of diffusion MRI in the differential diagnosis between abscess and brain tumors [24-27]. Indeed, the abscess clearly assessed in the diffusion MRI of most cases of the tumoral necrosis; considering the pus high viscosity, the abscess appears with high signal intensity in diffusion images compared to malignant tumor associating lower apparent diffusion coefficient of (ADC). In MR spectroscopy, the abscess is differentiated from a tumor by the absence of elevated amount of Choline; and the presence of multiple revealing amines acids synthesized by bacteria with chemical shift centered on 0.9 ppm in long echo time acquisitions are arguments confirming the positive diagnosis of pyogenes abscess [27].
6. THE DIAGNOSIS AND CLASSIFICATION TUMOR TYPE
The high sensitivity of the MRS allows being the most specific technique for the positive diagnosis of brain tumors. Compared to healthy tissue, spectra of brain tumor are characterized by:
˗ Elevated Choline and Cho/Cr and Cho/NAA ratios reflecting suffering membranes and cellular proliferation. This increase of Choline is linearly correlated to the histological proliferation index Ki67 [28].
˗ A decreased NAA and NAA/Cr ratio are associated with neuronal losses.
An increased myo-inositol is translating a glial activation, especially in case of glial tumors of low grade and disappearing gradually with the progressive passage to anaplasia [29].
The presence of free lipids is associated to the brain tumor grade, and they dominate the spectra in case of high grade tumors and associated cellular necrosis.
7. THE CHARACTERIZATION OF BRAIN TUMORS
˗ Gliomatosis is translated in MRS by an important rise of myo-inositol and a light increase of the Creatine peak. However, the chemical shift of Choline and NAA remain almost unmodified allowing to discriminate infiltrating glioma [30].
 (a)
(a) (b)
(b) (c)
(c) (d)
(d)
Figure 1. (a) Oligoastrosytoma of grad II within the intra ventricular lesion of V4 with right cerebella invasion, the signal in T1 does not enhance after injection of gadolinium; (b) the lesion is characterized by high apparent diffusion coefficient (ADC); (c) the metabolic profile is showed by single voxel MRS with short TE of 35 ms demonstrating important increase of myo-Inositol/Creatine (mI/Cr = 1.3) associated to increase of Choline (Ch); (d) while the single voxel MRS with long TE of 144 ms demonstrated an increase of Choline (Ch), and moderate decrease of N-Acetyl-Aspartate (NAA) and Creatine (Cr).
 (a)
(a) (b)
(b) (c)
(c) (d)
(d)
Figure 2. An heterogeneous anaplastic glioma lesion enhanced in T1 image after gadolinium injection; The tumor is surrounded by a large edematous area (a) and presenting a moderate increase of the apparent diffusion coefficient (ADC = 1.21 × 10⁻³); (c) The metabolic profile is characterized in single voxel MRS with short TE of 35 ms by an increase of Choline/ Creatine (Cho/Cr = 3.56; Cho/NAA = 7.2) associated to moderate amount of free lipids (Lip); (d) While the single voxel MRS with long TE of 144 ms is showing marked increase of Choline (Ch), and a decrease of N-Acetyl-Aspartate (NAA), moderate decrease of Creatine (Cr) and presence of a small amount of Lactate (Lac) (d).
˗ The low grad Glioma (II according to WHO) is translated by a high myo-inositol, a declined NAA; and a moderate increase of Choline, Cho/Cr, Cho/NAA ratios with absence of free lipids (Figure 1). The detection of lactate within this type of tumors would translate an underlying evolving translating an accelerated anaerobic glycolysis [31].
˗ The spectra of glioma of grad III according to WHO is characterized by an important rise of the Choline peak that is well correlated linearly with histological proliferation index Ki67, a decrease of the peak of Creatine, and NAA, and a moderate presence of myoinositol and free lipids which don’t control the spectra (Figure 2).
˗ The glioma of grad IV according to WHO are assessed in MRS with an important abundance of Choline, a strong decrease of NAA and Cr, a significant increase of lipids associated to cellular necrosis, and decrease even a disappearance of the myo-inositol spectrum (Figure 3). Therefore, the remote spectra of the contrast remain abnormal with low free lipids reflecting the infiltration of tumors [32,33].
˗ The MR spectroscopy of lymphomas shows a raised Choline, a significant decrease of the NAA and Cr peaks (Figure 4), and clear continuous increased free lipids [34].
˗ In MR spectroscopy, metastases are translated by a significant abundance of free lipids, a moderate raised Choline peak and the very low even lack of NAA and Cr (Figure 5). The remote spectra contrast remains normal, demonstrating the non infiltrating character of the lesion [35].
8. THE EXTENDED ASSESSMENT WITHIN LOCAL ANATOMICAL ABNORMALITIES
A malignant tumor are generally visible in conventional MRI and demonstrates a shape of a necrotic-cystic lesion that is taking strongly the contrast agent, it is surrounded with a zone of hypersignal in T2/FLAIR images. Such appearance could correspond either to a vasogenic reacting edema or to a tumoral infiltration. Differentiating these two pathologies is achieved by MRS performance in the differential diagnosis between pure edema and tumoral infiltration [36]; in a pure vasogenic edema, spectrum remains normal, while in a tumoral infiltration the MR spectra appear to be abnormal and characterized by elevated choline and Cho/Cr and Cho/NAA ratios.
9. PRETHERAPEUTICAL ASSESSMENT
The precise demarcation of tumor limits allows specifying the required surgical gesture including total, subtotal or partial, hence defining the possible dimension of
 (a)
(a)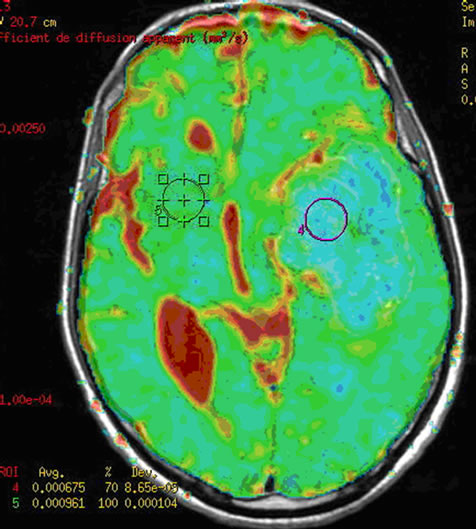 (b)
(b) (c)
(c)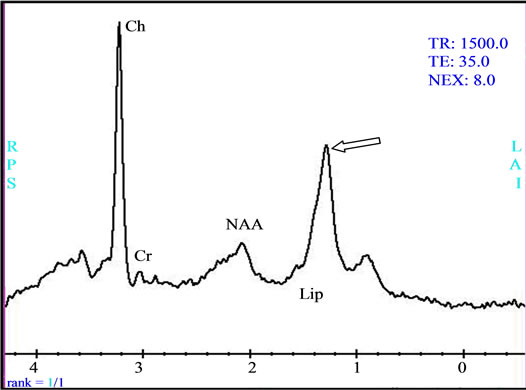 (d)
(d)
Figure 3. (a) The intra-parenchymatous Glioblastoma lesion showed left temporal hypo signal in T1 image and moderate signal T2/FLAIR images; (b) A heterogeneous enhancement is observed in Gadolinium-enhanced T1-weighted MR image merged with the ADC after contrast agent injection with lowered apparent diffusion coefficient (ADC = 0.675 × 10⁻³); (c) The metabolic profile is dominated in single voxel MRS with long echo time (144 ms) significant increase of Choline (Cho) and important decrease of N-Acetyl-Aspartate (NAA) and Creatine (Cr); (d) While the single voxel MRS with short echo time (35 ms) besides the presence metabolic abnormalities with long echo time, we found the presence of an important quantity of free lipids (Lip).
surgical exeresis of the lesion [37]. The combination MR spectroscopy, diffusion MRI and perfusion MRI in the pacification of stereotactic biopsy or radiotherapy allows defining more accurately the potential targets. This could be assessed by including tumor zones an important augmentation of Choline, elevated Choline/ NAA ration, an hyper vascular lesion with a lower apparent diffusion coefficient (ADC), tumor area without standard contrast media intensity of T1 MR images [38].
10. THERAPEUTICAL FOLLOW-UP
Earlier differentiation between tumor and radionecrosis in conventional MRI is difficult. However, the MR spectroscopy provides important results in this regards. The lesion persistence or evolvement is demonstrated by an increased Choline, whereas a radionecrosis is expressed by spectra where all metabolisms disappeared except free lipids [39].
 (a)
(a) (b)
(b) (c)
(c) (d)
(d)
Figure 4. (a) Lymphoma with deep hemispherical multiple intra parenchymatous lesions demonstrating an hyper signal in Gadolinium-enhanced T1 imag; (b) Homogeneous enhancement is observed after contrast injection associating lower apparent diffusion coefficient (ADC = 0.587 × 10⁻³); (c) The single voxel MRS with long echo time (TE = 144 ms) demonstrated a metabolic profile with important increase of the Choline/N-Acetyl-Aspartate ratio (Ch/NAA = 6.67), a remarkable decrease of Creatine (Cr) and NAA and a presence of lipids (Lip); (d) while the single voxel MRS with short TE (35 ms) we also found the presence of important quantity of lipids, and a moderate increase of the myo-Inositol (mI).
 (a)
(a)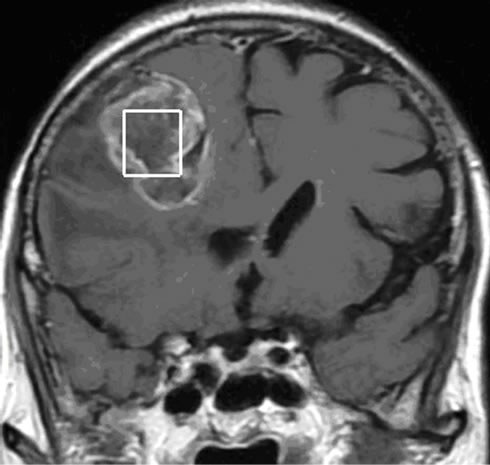 (b)
(b) (c)
(c) (d)
(d)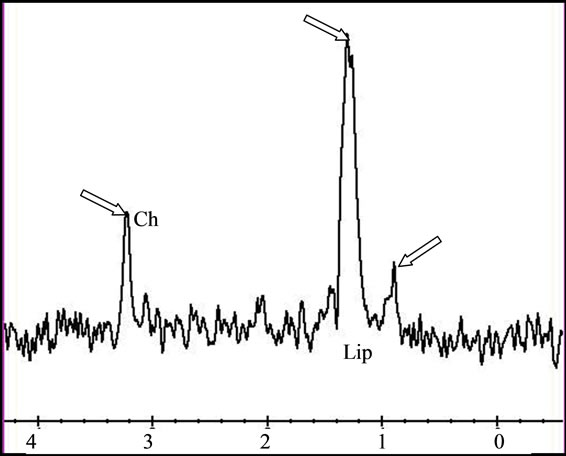 (e)
(e)
Figure 5. (a) The T2 image of brain metastasis is showing a heterogeneous lesion surrounded by a large edematous area, (b) with Gadolinium-enhanced T1 image and (c) presenting an increased apparent diffusion coefficient (ADC). (d) Free lipids (Lip) are the main component of the metabolic profile. Both single voxel MRS with short TE (35 ms) and (e) long TE (144 ms) demonstrated large amount of free lipids (Lip) associated to a global decrease of normal metabolites pointing a predominant necrotic lesion and global decrease of metabolites with persistence of Choline (Ch)related to cellular proliferation respectively. A residual lipid (Lip) peak is also observed.
The survival of tumor patients is improved by the radiotherapy; however most degenerating tumors have persistence within irradiated volumes. [40] It is probably associated to inaccurate definition of the targeted lesion and missed identification of radioresistant volume requiring elevated dose of radiations. Therefore, the MR spectroscopy constitutes a future method in radiotherapy allowing a better targeting of area with great recurrence potential. In the mean time, larger MRS and MRSI multicentre studies have to be achieved in order to have a better assessment of the survival estimation of each tumor category of patients
11. CONCLUSION
The MR spectroscopy has a great interest in the exploration and therapeutic strategies of brain tumors. It allows a better general combination and confrontation of functional metabolism and morphological studies. The technical development including multi-canals bird cage coils technology, stronger magnetic field gradients, and appropriate post-processing software should allow advanced and better involvement of MR spectroscopy in brain cancer studies.
REFERENCES
- Grand, S., Passaro, G., Ziegler, A. et al. (1999) Necrotic tumor versus brain abscess: Importance of amino acids detected at 1H MR spectroscopy initial results. Radiology, 213, 785-793.
- Lai, P.H., Ho, J.T., Chen, W.L. et al. (2002) Brain abscess and necrotic brain tumor: Discrimination with proton MR spectroscopy and diffusion-weighted imaging. American Journal of Neuroradiology, 23, 1369-1377.
- Poptani, H., Gupta, R.K., Roy, R., Pandey, R., Jain, V.K. and Chhabra, D.K. (1995) Characterization of intracranial mass lesions with in vivo proton MR spectroscopy. American Journal of Neuroradiology, 16, 1593-1603.
- Lai, P.-H., Hsu, S.-S., Ding, S.-W., Ko, C.-W. Fu, J.-H. Weng, M.-J., Yeh, L.-R., Wu, M.-T., Liang, H.-L., Chen, C.-K. and Pan, H.-B. (2007) Proton magnetic resonance spectroscopy and diffusion-weighted imaging in intracranial cystic mass lesions. Surgical Neurology, 68, S25-S36.
- De Edelenyi, F.S., Rubin, C., Esteve, F., et al. (2000) A new approach for analyzing proton magnetic resonance spectroscopic images of brain tumors: Nosologic images. Nature Medicine, 6, 1287-1289. doi:10.1038/81401
- Galanaud, D., Chinot, O., Metellus, P. and Cozzone, P. (2005) Apports de la spectroscopie par résonance magnétique dans l’exploration des gliomes. Bulletion of Cancer, 92, 327-331.
- Vion-Dury, J., Salvan, A.-M. and Cozzone, P.J. (1999) La spectrométrie de résonance magnétique du proton dans l’exploration non invasive du métabolisme cérébral humain: Applications cliniques actuelles et futures. Revista de Neurología, 155, 903-926.
- Galanaud, D., Nicoli, F., Figarella-Branger, D., Roche, P., Confort-Gouny, S., Le Fur, Y. and Cozzone, P.J. (2006) Spectroscopie par résonance magnétique des tumeurs cérébrales. Journal de Radiologie, 87, 822-832. doi:10.1016/S0221-0363(06)74090-2
- Galanaud, D., Chinot, O., Nicoli, F., et al. (2003) Use of proton magnetic resonance spectroscopy of the brain to differentiate gliomatosis cerebri from low-grade glioma. Journal of Neurosurgery, 98, 269-276. doi:10.3171/jns.2003.98.2.0269
- Herminghaus, S., Dierks, T., Pilatus, U., et al. (2003) Determination of histopathological tumor grade in neuroepithelial brain tumors by using spectral pattern analysis of in vivo spectroscopic data. Journal of Neurosurgery, 98, 74-81. doi:10.3171/jns.2003.98.1.0074
- Moller-Hartmann, W., Herminghaus, S., Krings, T., et al. (2002) Clinical application of proton magnetic resonance spectroscopy in the diagnosis of intracranial mass lesions. Neuroradiology, 44, 371-381. doi:10.1007/s00234-001-0760-0
- Galanaud, D., Nicoli, F., Confort-Gouny, S., Le Fur, Y., Ranjeva, J.P., Viola, A., Girard, N. and Cozzone, P.J. (2007) Spectroscopie par résonance magnétique du proton. Quelles indications neurologiques en 2007? Revue Neurologique, 163, 287-303. doi:10.1016/S0035-3787(07)90402-6
- Kimura, T., Sako, K., Gotoh, T., Tanaka, K. and Tanaka, T. (2001) In vivo single voxel proton MR spectroscopy in brain lesions with ring-like enhancement. NMR in Biomedicine, 14, 339-349. doi:10.1002/nbm.711
- Kimura, T., Sako, K., Tanaka, K., et al. (2004) Evaluation of the response of metastatic brain tumors to stereotactic radiosurgery by proton magnetic resonance spectroscopy, 201 TlCl single-photon emission computerized tomography, and gadolinium-enhanced magnetic resonance imaging. Journal of Neurosurgery, 100, 835-841. doi:10.3171/jns.2004.100.5.0835
- Yoshino, E., Ohmori, Y., Imahori, Y., et al. (1996) Irradiation effects on the metabolism of metastatic brain tumors: Analysis by positron emission tomography and 1Hmagnetic resonance spectroscopy. Stereotactic and Functional Neurosurgery, 66, 240-259. doi:10.1159/000099816
- Galanaud, D., Nicoli, F., Confort-Gouny, S., Le Fur, Y., Dormont, D., Girard, N., Ranjeva, J.P. and Cozzone, P.J. (2007) Spectroscopie par résonance magnétique cérébrale Journal de Radiologie, 88, 483-496. doi:10.1016/S0221-0363(07)89848-9
- Pirzkall, A. (2004) MR-Spectroscopy: Potential for brain tumor diagnosis and guiding therapy. In: Black, P. and Loeffler, J.S., Eds., Cancer of the Nervous System, Lippincott Williams &Wilkins, Philadelphia.
- Pirzkall, A., Li, X., Oh, J., Chang, S., Berger, M.S., Larson, D.A., et al. (2004) 3D MRSI for resected highgrade gliomas before RT: Tumor extent according to metabolic activity in relation to MRI. International Journal of Radiation Oncology & Biology &* Physics, 59, 126-137. doi:10.1016/j.ijrobp.2003.08.023
- Graves, E.E., Nelson, S.J., Vigneron, D.B., Chin, C., Verhey, L., McDermott, M., et al. (2000)A preliminary study of the prognostic value of proton magnetic resonance spectroscopic imaging in gammaknife radiosurgery of recurrent malignant gliomas. Neurosurgery, 46, 319-326. doi:10.1097/00006123-200002000-00011
- Ross, B. and Bluml, S. (2001) Magnetic resonance spectroscopy of the human brain. The Anatomical Record, 265, 54-84. doi:10.1002/ar.1058
- De Bazelaire, C. and Lewin, M. (2005) Points forts en oncologie au RSNA 2004. Journal de Radiologie, 86, 74-84. doi:10.1016/S0221-0363(05)81462-3
- Castilo, M., Kwock, L. and Mukherji, S.K. (1996) Clinical applications of proton MR spectroscopy. American Journal of Neuroradiology, 17, 1-15.
- Soaresa, D.P. and Law, M. (2009) Magnetic resonance spectroscopy of the brain: Review of metabolites and clinical applications. Clinical Radiology, 64, 12-21. doi:10.1016/j.crad.2008.07.002
- Grand, S., Ternier, J., Rousseau, N., Ashraf, A., Tropres, I., Remy, C. and Le Bas, J.F. (2004) Abcès cérébral: Aspects caraterisatiques en imagerie morphologique et fonctionnelle. Journal of Neuroradiology, 31, 145-147. doi:10.1016/S0150-9861(04)96982-9
- Leuthardt, E.C., Wippold, F.J., Oswood, M.C., Rich, K.M. (2002) Diffusion-weighted MR imaging in the pre-operative assessment of brain abscesses. Surgical Neurology, 58, 395-402. doi:10.1016/S0090-3019(02)00929-1
- Lai, P.H., Ho, J.T., Chen, W.L., Hsu, S.S., Wang, J.S., Pan, H.B., et al. (2002) Brain abscess and necrotic brain tumor: Discrimination with proton MR spectroscopy and diffusion-weighted imaging. American Journal of Neuroradiology, 23, 1369-1377.
- Ebisu, T., Tanaka, C., Umeda, M., Kitamura, M., Naruse, S., Higuchi, T., et al. (1996) Discrimination of brain abscess from necrotic of cystic tumor by diffusion-weighted echo planar imaging. Magnetic Resonance Imaging, 14, 1113-1116. doi:10.1016/S0730-725X(96)00237-8
- Schimitzu, H., Kumabe, T., Shirane, R. and, Yoshimoto, T. (2000) Correlation between choline level measured by proton MR spectroscopy and Ki-67 labeling index in gliomas. American Journal of Neuroradiology, 21, 659-665.
- Castillo, M., Smith, J.K. and Kwock, L. (2000) Correlation of myo-inositol levels and grading of cerebral astrocytomes. American Journal of Neuroradiology, 2, 1645-1649.
- Saraf-Lavi, E., Bowen, B.C., Pattany, P.M., et al. (2003) Proton MR Spectroscopy of gliomatosis cerebri: Case report of elevated myoinositol with normal choline levels. American Journal of Neuroradiology, 24, 946-951.
- Guillevin, R., Menuel, C., Duffau, H., et al. (2008) Proton magnetic resonance spectroscopy predicts proliferative activity in diffuse low-grade gliomas. Journal of NeuroOncology, 87, 181-187. doi:10.1007/s11060-007-9508-y
- Grand, S., Tropres, I., Hoffmann, D., Ziegler, A. and Le Bas, J.F. (2005) Apport de la spectroscopie 1H au diagnostic des processus tumoraux intra-parenchymateux cé- rébraux et leur suivi thérapeutique. Neurochirurgie, 51, 299-308. doi:10.1016/S0028-3770(05)83491-5
- Martin-Duverneuil, N., Guillevin, R. and Chiras, J. (2008) Imaging of gliomas. Cancer/Radiothérapie, 12, 669-675. doi:10.1016/j.canrad.2008.07.017
- Taillibert, S., Guillevin, R., Menuel, C., Sanson, M., Hoang-Xuan, K., Chiras, J. and Duffau, H. (2008) Brain lymphoma: Usefulness of the magnetic resonance spectroscopy. Journal of Neuro-Oncology, 86, 225-229. doi:10.1007/s11060-007-9468-2
- Law, M., Cha, S., Knopp, E.A., Johnson, G., Arnett, J. and Litt, A.W. (2002) High-grade gliomas and solitary metastases: Differentiation by using perfusion and proton spectroscopic MR imaging. Radiology, 222, 715-721. doi:10.1148/radiol.2223010558
- Pierot, L. (2005) RSNA 2004: Neuroradiologie. Journal de Radiologie, 86, 868-873. doi:10.1016/S0221-0363(05)81461-1
- Nelson, S.J., Graves, E., Pirzkall, A. et al. (2002) In vivo molecular imaging for planning radiation therapy of gliomas: An application of 1H MRSI. Journal of Magnetic Resonance Imaging, 16, 464-476. doi:10.1002/jmri.10183
- Laprie, A. (2009) Apport de l’imagerie de spectroscopie de résonance magnétique du proton et des autres imageries métaboliques à la définition des volumes cibles de radiothérapie des tumeurs gliales de l’adulte et de l’enfant. Cancer/Radiothérapie, 13, 556-561. doi:10.1016/j.canrad.2009.07.003
- Kimura, T., Sako, K., Gotoh, T., et al. (2001) In vivo single-voxel proton MR spectroscopy in brain lesions with ring-like enhancement. NMR in Biomedicine, 14, 339-349. doi:10.1002/nbm.711
- Park, I., Tamai, G., Lee, M.C., Chuang, C.F., Chang, S.M., Berger, M.S., et al. (2007) Patterns of recurrence analysis in newly diagnosed glioblastoma multiforme after three-dimensional conformal radiation therapy with respect to pre-radiation therapymagnetic resonance spectroscopic findings. International Journal of Radiation Oncology&Biology&Physics, 69, 381-389. doi:10.1016/j.ijrobp.2007.03.019
NOTES
*Both authors have equally contributed to this paper