Journal of Geoscience and Environment Protection
Vol.07 No.09(2019), Article ID:95413,14 pages
10.4236/gep.2019.79014
Effect of Geodynamic Activities on an Existing Dam: A Case Study of Ojirami Dam, Southern Nigeria
K. O. Ozegin1*, M. A. Bawallah2, S. O. Ilugbo2, A. A. Oyedele3, J. F. Oladeji4
1Department of Physics, Ambrose Alli University, Ekpoma, Nigeria
2Department of Applied Geophysics, Federal University of Technology, Akure, Nigeria
3Department of Physics, Ekiti State University, Ado-Ekiti, Nigeria
4Department of Applied Geology, Federal University of Technology, Akure, Nigeria

Copyright © 2019 by author(s) and Scientific Research Publishing Inc.
This work is licensed under the Creative Commons Attribution International License (CC BY 4.0).
http://creativecommons.org/licenses/by/4.0/


Received: August 17, 2019; Accepted: September 24, 2019; Published: September 27, 2019
ABSTRACT
Geodynamics is the study of the forces and their effects on motion and physics of the processes and the phenomena attending the steady evolution of the earth and the changes that are still going on. This study revealled the significance of electrical resistivity method on effect of geodynamic activities on an existing Dam monitoring at Ojirami Dam, Edo State, Nigeria. The electrical resistivity method involved three techniques: 2D Electrical Resistivity Tomography (ERT), Vertical Electrical Sounding (VES) and Horizontal Profiling (HP). 2D ERT using Dipole-Dipole electrode array with inter-station separation of 5 m and an expansion factor that varied from 1 to 5 with Nine (9) VES were carried out using Schlumberger array with current electrode spacing varying from 1.0 to 65.0 m and HP using Wenner array with an electrode spacing of 20 m and electrode movement at 5 meters. The 2-D imaging (Dipole-Dipole) gave information on the subsurface characteristic which section delineated five major geologic layers comprising of the topsoil, weathered basement, fractured zone, partly fractured basement and the fresh basement. The geoelectric sections identified three to four geoelectric/geologic subsurface layers along the traverse. The HP revealled the pattern of resistivity variations within the subsurface. The entire results correlate well with one another showing that all the techniques used were complemented. The combination of these techniques has proved effective and useful in geodynamic activities of the existing dam. Ojirami Dam is at a critical point of yielding to activities of geodynamic processes that may occur from the main axis, of major weak zones as observed between 75 to 95.00 m and 115 to 145.00 m. Hence, there is need to call government attention for further confirmatory test using other geophysical methods and subsequently putting in place remedial measures to prevent its future occurrence.
Keywords:
Periodic Monitoring, Seepage, Dipole-Dipole Pseudo-Section, Geoelectric Section

1. Introduction
Ojirami dam foundation stone was laid on the 26th of March 1971 and was commission on 20th of January 1974. The dam was constructed across River Onyami which flows into River Ose Akoko-Edo region. On 30th August 1980, the Ojirami dam failed and inundated the Akuku and Enwan communities (Lukman et al., 2011) . Before its reconstruction between 1980 and 1982, Ojirami Dam caused a very devastating setback in 1980. It swept part of Akuku community and other neighboring communities in the same local government. The source of water supply to the Dam is traceable to a big lake and other tributaries from the Kukuruku Mountain. It is located between Akuku and Ojirami communities in Akoko Edo local government area of Edo state. Ojirami Dam was constructed for the purpose of domestic, agricultural and industrial water supply to the neighbouring communities. A Dam is artificial lake fashioned to reserve water for a specific purpose. Dams can generally be divided into two groups: storage reservoirs designed to permanently impound water and single-purpose flood control structures designed to impound water for short duration of times during flood events. The reservoir is aging, with evidence of situation but relatively free of any anthropogenic activities. Geodynamic is a process that constantly and continuously taking place with time arising from stress and strains, temperature variations, internal and external pressure and gradual earth movement results from weathering, cracks, joining, fracturing and faulting (Isogun & Adepelumi, 2014) . Site investigations for existing dams require satisfying often conflicting objectives: the need to obtain information about the structure and the need to preserve its integrity. Most earthen dam failures are the result of seepage and internal erosion. Hence, early detection of seepage zones can help ensure that aging dams are properly maintained and that failures as a result of seepage are averted (Ogilvy et al., 1969; Foster et al., 2000; Ikard, 2013) . Several of those dams as the earthen dams around the world unfortunately suffer from common filtration or leakage problems. Water leakage in dam almost occurs either through the bedrock of dam’s lake or through the dam body foundations. The geological and tectonic features such as faults, fractures and karstic features are the main factors of the leakage causes in earthen dams (Boleve et al., 2011; Bedrosian et al., 2012) . Seepage through a dam is a slow discharge or escape of liquid that is supposed to be retained in the reservoir, through conduits (fracture/fault lines) to the flank of the dam. It reduces the expected quantity of water, weaken dam construction and damage dam gates. Certain soil can swell if they get saturated with the seeping water and when there is loss of water in them, they shrink drastically. These expansions and shrinkages of soils can result to cracks and collapse of the dam. Seepage is one of the major reasons for embankment dam failures and may constitute a significant potential social dislocation (displacement of people, loss of valuable life and properties) if not examined (Olasunkanmi et al., 2018) . Usually the cost of rebuilding a failed dam can be exasperating and absence of water supply may hamper the objective(s) of dam construction. Modern geophysical techniques in this context are considered as an effective tool in dam’s water leakage investigations. Recently, Electrical Resistivity method becomes one of the main geophysical methods wildly employed in hydrogeology and earth sciences applications. This technique has proven its performance in detecting the leakage path ways occurring in earthen dams through numerous works around the world (Zhu et al., 2011; Thompson et al., 2012; Ikard et al., 2014) . Therefore, this research aims at post construction monitoring of Ojirami Dam, Edo State, Nigeria with a special focus on the status of the structural trends, setting in term of its integrity and to raise awareness towards environmental safety in the area of periodic monitoring of existing Dams.
Description and Geology of the Study Area
Ojirami dam (Plate 1) is located in Ojirami-Dagbala village, 5 km east of Igarra town in Akoko-Edo Local Government area in the Northern part of Edo State, Southern Nigeria It lies within latitude 7˚17'52.41''N and longitude 6˚9'10.72''E. The western and eastern flank of the dam site is gently undulating along the traverses, with both sides sloping towards the river channel. The dam and spillway axes are oriented in WSW-ENE while the river flows in the NNW-SSW direction. The height of the dam is 3.9 m with a storage capacity of 45.3 million∙m3, the dam is intended to provide municipal water supplies sixteen adjoining communities in Akoko-Edo which include: Ojirami (Ojirami Petesi, Ojirami Afekunu), Dagbala, Uneme-Eturu, Akuku, Enwan, Igarra, Okpe, Ugboshi, Ibillo, Uneme-Osu, Ojah, Ayetoro, Makeke, Ososo, Uneme-Aruru, Uneme-Enekwa at an output capacity of 24 hours per day, at the construction of the dam. It is also intended to provide irrigation services to the adjoining farmland in dry seasons. Ojirami dam is in Igarra Schist belt which is underlain by the crystalline basement complex of southwestern Nigeria. It is described by Odeyemi (1988) as a polycyclic terrain which contain some of the oldest rocks in West Africa. The Igarra schist belt belongs to the younger metasediment and it trends NNW with a length of 50 km and in the west is joined to the NW trending Owo belt. It is underlain by porphyritic-granite and quartzites.
2. Research Methodology
Two traverses of about 170 m were established in an approximate E-W direction (Figure 1). It was considered on the basis of two flanks made up of the main dam axis and its extension refers to as traverse 1 and transverse 2 respectively.
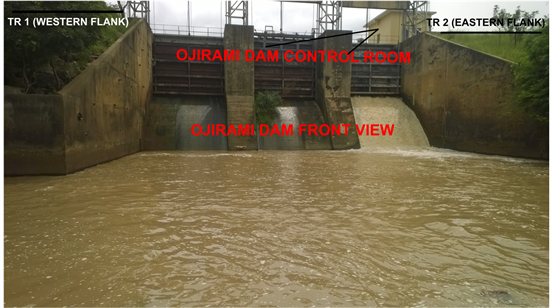
Plate 1. Ojirami dam.

Figure 1. Data acquisitions map of the study area.
The main dam axis cover a distance of 250 m on transverse 1 on which 200 m was considered as major point of interest. While the transverse 2 (extension) covering a distance of 100.00 m was also considered. Measurements were carried out east to west on the basis of eastern flank and western flank of the dam axes. In this case, the eastern flank is considered as the extension.
The electrical resistivity method utilised 2D Electrical Resistivity Tomography (ERT), the Vertical Electrical Sounding (VES) and the Horizontal Profiling (HP) techniques. 2-D electrical imaging of the subsurface was obtained using dipole-dipole configuration. The inter-electrode spacing of 5 m was adopted while inter-dipole expansion factor (n) was varied from 1 to 5 to determine the lateral and vertical variation in apparent resistivity of the subsurface beneath the two established traverses. The dipole-dipole array places the A and B electrodes to one side with a spacing between them denoted as “a”. The M and N electrode pair with equal a-spacing are placed collinearly a distance “na” away from A and B. A distance equal to an integer multiple of “a” is denoted “na”. As measurements are taken at various n’s, that is, the pairs of electrodes are moved apart, a sounding is obtained. If the electrodes are moved across the surface, a profile of comparative values is generated. Thus the dipole-dipole method produces a combination sounding-profiling set of data if measurements are taken at various values of n along a profile. Figure 2 depicts dipole-dipole configuration including electric field lines and resultant equipotential surfaces (Ogungbe et al.,

Figure 2. Dipole-dipole configuration, including electric field lines (solid) and resultant equipotential surfaces (dashed) (Modified from Ogungbe et al., 2010 ).
2010) . Apparent resistivity applying dipole-dipole array can be written in the form:
(1)
where ∆V is the potential difference and I is the electric current.
The VES involved the use of Schlumberger array. Nine (9) sounding stations were occupied along the two established traverses, and the current electrode spacing (AB/2) was varied from 1 to 65.00 m. This can be attained by passing electrical current into the ground through the current electrodes A and B and the resulting potential difference will be measured through the other two potential electrodes M and N. Four electrodes are placed along a straight line on the Earth surface in the same order; A M N B (Figure 3). The separation between the potential electrodes is kept small compared to the current electrode separation usually with AB ≥ 5 MN. For any linear symmetric array A M N B of electrodes, the apparent resistivity (ρa) applying Schlumberger array where AM is the distance on the Earth surface between the positive current electrode A and the potential electrode M. When two current (I) electrodes A and B are used and the potential difference (ΔV) is measured between two measuring electrodes M and N, the apparent resistivity can be written in the form:
(2)
The horizontal profiling utilising Wenner electrode configuration of station separations and electrode spacing of 20 m and 5 m respectively were used for both traverses. This is a co-linear array in which all four electrodes are arranged in a straight line with the potential electrodes (C, D) inside the current electrodes (A, B) (Figure 4). This inter-electrode spacing (a) is constant and all electrodes are moved simultaneously when resistivity measurements are being acquired (Ozegin & Oseghale, 2012) . The apparent resistivity applying Wenner array can be written in the form:

Figure 3. Schlumberger configuration (modified from Ozegin & Oseghale, 2012 ).

Figure 4. Wenner configuration (Keller & Frischknecht, 1996) .
(3)
where: ρa is the apparent resistivity, 2πa is the geometric factor (K), ∆V is the potential difference and I is the electric current.
Resistivity values were obtained by using the R50 resistivity meter. The dipole-dipole data were inverted into 2-D subsurface images using the DIPPRO™ 4.0 inversion software (Dippro for Windows, 2000) . In order to process the electrical resistivity data, the apparent resistivity values were plotted against the electrode spread (AB/2). This was subsequently interpreted quantitatively using the partial curve matching method and computer-assisted 1-D forward modeling with WinResist 1.0 version software (Vander Velpen, 2004) . While the horizontal profiling data were plotted on excel work sheet. The results from the three techniques were integrated in order to determine the consequences of the differential settlement and their degree of correlation.
3. Results and Discussion
The results of the study were presented as pseudosection, Sounding curves, geoelectric sections and graphs.
3.1. Dipole-Dipole Pseudosection
3.1.1. The Main Dam Axis (Western Flank) along Transverse 1
The 2D imaging of this flank (Figure 5(a)) revealled three (3) distinct structural features that are of major interest which were considered as zone A, zone B and zone C respectively. The zone A of this flank is considered to exist from 1 to 75.00 m. The information obtained from this zone indicated the presence of a competent basement rock occurring from near surface with increasing bedrock competence with depth from a distance of 1 to 45.00 m while between 45 to 75.00 m, a structural features was observed, a near surface weak zone underlain basement material in form of a dyke resting upon weathered basement materials of lesser competence. From this zone, presence of structural defect were noticed,
 (a)
(a) (b)
(b)
Figure 5. (a) Dipole-Dipole Pseudosection of the main dam axis (western flank) along transverse One; (b) Dipole-Dipole Pseudosection of the dam extension axis (Eastern flank) along transverse Two.
that overtime may bring about rapid and continuous weathering activities, which may subject the stability of the Dam into a precarious situation.
Zone B of the main Dam axis covers a distance of 20.00 m (75 to 95.00 m). A structural feature indicative of a major structural trend was observed. The weak zone manifested from the near surface to a depth of about 25.00 m and beyond. This implication of this weak zone is very significant to this study, considering the fact that seepage, age of the Dam coupled with the dynamics of temperature and pressure. The increasing tendency for weathering activities that may allow for continuous seepage and further weakening of the Dam, can possibly expands the weak zones along the Dam axis in a rapid and dynamic process in such a way that may bring about future failure.
In zone C, structural trend of interest with three distinct features were also observed. Near surface competent materials that occurred from the surface to a depth of 5.00 m, followed by weathered layer materials whose layers competency increases with depth especially between 100 to 115.00 m and towards the end, between 140 to 180.00 m. However, towards the centre of this zone, i.e. between 115 to 145.00 m, another major anomaly of interest was observed forming dyke like or Dome like structure. The resistivity parameters of this area indicated that the weakness of this area increase with depth from the near surface of about 3 m and the information obtained from this part of the study area indicated the presence of a major weak zone suspected to be a fracture occurring at a depth of about 20 m.
3.1.2. The Dam Extension Axis (Eastern flank) along Transverse 2
Three major structural features were observed from the 2D imaging on this flank (Figure 5(b)) near surface features: a near surface feature was observed at between 12 to 18.00 m, 52 to 78.00 m and 86 to 95.00 m occurring to a depth of 0.8 to 5.00 m. This weak zone may not constitute any major treat to the dam’s existence, since it is a very near surface weak zone, not majorly distributed and can only allow for pocket of near surface water run way especially during rainfalls. The second structural feature that was noticed occurred between 5 to 50.00 m. This zone is partly weathered especially from the near surface to depth between 8 to 10.00 m, is considered as partly competent or resistive, as the resistivity parameter indicated that the resistance of the underlying rock increases with depth. Furthermore, the third structural feature that was observed along this flank occurred at a distance between 51 m to the end of this flank. This zone of the dam extension were noticeable three distant features, i.e. a near surface porous or weak zone, partially 5 m, underlain by a competent fresh basement; there are no major structural feature that may constitute source of concern either now or in the near future from this flank of the dam (extension) in view of the information obtained from the geophysical investigation.
3.2. Vertical Electrical Sounding
3.2.1. Characteristic of the VES Curves
Curves types identified ranges from H and KH varying between three to four geo-electric layers. The H curve type predominating. Typical curve types in the area are as shown in Figure 6(a) and Figure 6(b).
3.2.2. Geoelectric and Lithological Characteristic along the Two Traverses (Western and Eastern Flank)
The geoelectric sections were represented by the 2-D view of the geoelectric
 (a)
(a)
 (b)
(b)
Figure 6. (a) Typical H sounding curve; (b) Typical KH sounding curve.
parameters (depth and resistivity) derived from the inversion of the electrical resistivity sounding data. The geoelectric section along Traverse 1 (Figure 7(a)) correlates the geoelectric sequence across the study area. The geoelectric sections identified four geoelectric/geologic subsurface layers. The topsoil comprising of clayey sand, sandy clay and sand with the resistivity values ranges from 272 to 820.00 Ωm with its thickness varies from 1.0 to 3.20 m, the lateritic layer resistivity values range from 389 to 660.00 Ωm and thickness ranges from 3.7 to 13.00 m while the weathered/fractured basement resistivity varies from 101 to 278.00 Ωm with its thickness varies from 3.20 to 24.00 m. The fresh basement has a resistivity values ranged from 580 to 860.00 Ωm with depth to basement ranging from 9 to 24.00 m.
On Traverse 2 (Figure 7(b)) along Eastern flank, four subsurface geologic layers were also delineated along this traverse. From the geoelectric section, the top soil, weathered layer and fractured/fresh basement were determined. The topsoil comprising of clayey sand sandy clay and sand with the resistivity values ranges from 169 to 349.00 Ωm with its thickness varies from 1 to 1.40 m, the weathered layer resistivity values range from 25 to 116.00 Ωm and thickness ranges from 3.7 to 4.90 m while the fractured basement resistivity varies from 450 to 2018.00 Ωm with depth to basement ranging from 3.7 to 4.90 m.
3.3. Horizontal Profiling
3.3.1. Horizontal Profiling of Main Dam Axis along Traverse One
In addition to the Dipole-Dipole measurement, Wenner profiling was carried out along traverse one which cover a distance of 180 m with electrode spacing a = 20 m and electrode movement at 5 m. Figure 8(a) illustrates two zones of
 (a)
(a) (b)
(b)
Figure 7. (a) Geoelectric Section of the main dam axis (western flank) along transverse One; (b) Geoelectric Section of the dam extension axis (Eastern flank) along transverse Two.
major anomaly with resistivity reducing from 600.00 Ωm to as low as below 100.00 Ωm between 80 to 90.00 m and between 120 to 140.00 m which effectively correlation with the information obtained from the 2D imaging of this main flank of the Dam axis.
3.3.2. Horizontal Profiling of Dam Extension Axis along Traverse Two
A lateral resistivity profiling was also carried out at the flank of the Dam extension covering a distance of about 100.00 m and taken along East to West orientation (Figure 8(b)). The information obtained also revealled that except for a distance between 0 to 20.00 m which has a resistivity of about 100 Ωm at a 200 m, all area beyond this point along the profile reveals some level of stability and layer competency as resistivity remain high from about 350 to 450.00 Ωm throughout the rest of the study area. This also showed effective correlation with information obtained from the 2D imaging of this flank of the Dam.
4. Synthesis of Results
Figure 9 displays the correlation of result obtained from the geophysical techniques. The Wenner profiling observed at a distance 80 to 90.00 m and 120 to 140.00 m demonstrated weak zones with apparent resistivity value ranging from 90 to 100 Ωm which coincides with the low resistivity zones observed on the
 (a)
(a) (b)
(b)
Figure 8. (a) Horizontal profiling of the main dam axis (western flank) along transverse One; (b) Horizontal profiling of the dam extension axis (Eastern flank) along transverse Two.
dipole-dipole pseudo-section at a distance between 75 to 95.00 m and 115 to 145.00 m. This also coincides with the geoelectric section at a distance 50 to 140.00 m along the main dam axis (western flank). From the eastern flank (Dam extension) the Wenner profiling has a low resistivity varying from 100 to 200.00 Ωm at a distance between 0 to 20.00 m which coincides with the pocket of low resistivity zone observed on the dipole-dipole pseudosection between the same ranges and also with geoelectric section. But beyond this point along the dam extension reveals some level of stability and layer competency as resistivity remain high from about 350 to above 450 Ωm throughout the area which also coincides with dipole-dipole pseudosection and geoelectric section. These results reveal that the electrical resistivity techniques used for this study are complimentary.
5. Conclusion
The study has revealled the significance of electrical resistivity method on effect

Figure 9. Correlation of Dipole-Dipole pseudosection, geoelectric section with horizontal profiling along Traverse one (Western flank) and Traverse two (Eastern flank) of the study area.
of geodynamic activities in Dam monitoring design investigation. Geophysics, consequently, remains a very fundamental tool which can be applied in civil engineering works. It’s imperative that the geodynamic of the Dam may be considered to be in serious danger owing to the fact that the existence of a major weak zone has been established along the main Dam axis and over time, this is expected to widen up as a result of stress and strain, temperature variation, internal and external pressure, river and sea rise and many a time gradual earth movements resulting from weathering, cracks, joining, fracturing and faulting. Therefore, Ojirami Dam could have experienced any of these processes as the zones of major weakness observed from this study may not have existed forty five years ago when the Dam was constructed to meet standard. If the weak zone existed, it could have been negligible in nature and sudden change in the structural trend may be attributed to a major weak zone after forty five years. There is the need to carry out periodic monitoring test of this nature at least once in every forty to fifty years over existing major structures such as bridge, high rise buildings and major Dams. There is no doubt that Ojirami Dam is at a critical point of yielding to activities of geodynamic processes that may occur from the main axis of major weak zones as observed between 75 to 95.00 m and 115 to 145.00 m. Hence, there is a need to call Government attention to this, for further confirmatory test using other geophysical methods and subsequently putting in place remedial measures to prevent its future failure. This research is also intended to stimulate further interest on the effects of geodynamic activities in the basement complex region of Nigeria, especially as it affects structures/foundation given the spate of structural failures.
Conflicts of Interest
The authors declare no conflicts of interest regarding the publication of this paper.
Cite this paper
Ozegin, K. O., Bawallah, M. A., Ilugbo, S. O., Oyedele, A. A., & Oladeji, J. F. (2019). Effect of Geodynamic Activities on an Existing Dam: A Case Study of Ojirami Dam, Southern Nigeria. Journal of Geoscience and Environment Protection, 7, 200-213. https://doi.org/10.4236/gep.2019.79014
References
- 1. Bedrosian, P. A., Burton, B. L., Powers, M. H., Minsley, B. J., Phillips, J. D., & Hunter, L. E. (2012). Geophysical Investigations of Geology and Structure at the Martis Creek Dam, Truckee, California. Journal of Applied Geophysics, 77, 7-20.
https://doi.org/10.1016/j.jappgeo.2011.11.002 [Paper reference 1] - 2. Boleve, A., Janod, F., Revil, A., Lafon, A., & Fry, J. (2011). Localization and Quantification of Leakages in Dams Using Time-Lapse Self-Potential Measurements Associated with Salt Tracer Injection. Journal of Hydrology, 403, 242-252.
https://doi.org/10.1016/j.jhydrol.2011.04.008 [Paper reference 1] - 3. Dippro for Windows (2000). Dippro TM Version 4.0 Processing and Interpretation Software for Dipole Dipole Electrical Resistivity Data. Daejon, South Korea: KIGAM. [Paper reference 1]
- 4. Foster, M., Fell, R., & Spannagle, M. (2000). The Statistics of Embankment Dam Failures and Accidents. Canadian Geotechnical Journal, 37, 1000-1024.
https://doi.org/10.1139/t00-030 [Paper reference 1] - 5. Ikard, S. (2013). Geoelectric Monitoring of Seepage in Porous Media with Engineering Applications. Dissertations & Theses Gradworks. [Paper reference 1]
- 6. Ikard, S. J., Revil, A., Schmutz, M., Karaoulis, M., Jardani, A., & Mooney, M. (2014). Characterization of Focused Seepage through an Earth Fill Dam Using Geoelectrical Methods. Groundwater, 52, 952-965.
https://doi.org/10.1111/gwat.12151 [Paper reference 1] - 7. Isogun, M. A., & Adepelumi, A. A. (2014). The Review of Seismicity of Central Mid-Atlantic Fracture Zone. International Journal of Scientific and Engineering Research, 5, 1309-1316. [Paper reference 1]
- 8. Keller, G. V., & Frischknecht, F. C. (1996). Electrical Methods in Geophysical Prospecting. Oxford: Pergamon [Paper reference 1]
- 9. Lukman, S., Otun, J. A., Adie, D. B., Ismail, A., & Oke, I. A. (2011). A Brief Assessment of a Dam and Its Failure Prevention. Journal of Failure Analysis and Prevention, 11, 97-109.
https://doi.org/10.1007/s11668-010-9420-1 [Paper reference 1] - 10. Odeyemi, I. B. (1988). Lithostratigraphy and Structural Relationship of the Upper Precambrian Metasediment in Igarra Area, Southwestern Nigeria. In P. O. Oluyide, W. O. Mbonu, A. E. O. Ogezi, I. G. Egbuniwe, A. C. Ajibade, & A. O. Umeji (Eds.), Precambrian Geology of Nigeria (pp. 111-125). Kaduna South: Geological Survey of Nigeria Publication. [Paper reference 1]
- 11. Ogilvy, A. A., Ayed, M. A., & Bogoslovsky, V. A. (1969). Geophysical Studies for Water Seepages from Reservoirs. Geophysical Prospecting, 17, 36-62.
https://doi.org/10.1111/j.1365-2478.1969.tb02071.x [Paper reference 1] - 12. Ogungbe, A. S., Olowofela, J. A., Da-Silva, O. J., Alabi, A. A., & Onori, E. O. (2010). Subsurface Characterization Using Electrical Resistivity (Dipole-Dipole) Method at Lagos State University (LASU) Foundation School, Badagry. Advances in Applied Science Research, 1, 174-181. [Paper reference 3]
- 13. Olasunkanmi, N. K., Aina, A., Olatunji, S., & Bawalla, M. (2018). Seepage Investigation on an Existing Dam Using Integrated Geophysical Methods. Journal of Environment and Earth Science, 8, 6-16. [Paper reference 1]
- 14. Ozegin, K. O., & Oseghale, A. O. (2012). Fundamentals of Active Methods of Geophysical Prospecting. In J. E. A. Osemenikhian (Ed.), Oshio Prints, a Division of Osabeat Computers (pp. 34-78). Nigeria: Benin City. [Paper reference 2]
- 15. Thompson, S., Kulessa, B., & Luckman, A. (2012). Integrated Electrical Resistivity Tomography (ERT) and Self-Potential (SP) Techniques for Assessing Hydrological Processes within Glacial Lake Moraine Dams. Journal of Glaciology, 58, 849-858.
https://doi.org/10.3189/2012JoG11J235 [Paper reference 1] - 16. Vander Velpen, B. P. A. (2004). WinRESIST Version 1.0 Resistivity Depth Sounding Interpretation Software. Delf, the Netherland: ITC. [Paper reference 1]
- 17. Zhu, J., Currens, J. C., & Dinger, J. S. (2011). Challenges of Using Electrical Resistivity Method to Locate Karst Conduits—A Field Case in the Inner Bluegrass Region, Kentucky. Journal of Applied Geophysics, 75, 523-530.
https://doi.org/10.1016/j.jappgeo.2011.08.009 [Paper reference 1]