Journal of Environmental Protection
Vol.4 No.6(2013), Article ID:33394,11 pages DOI:10.4236/jep.2013.46071
Assessment of Heavy Metals, pH, Organic Matter and Organic Carbon in Roadside Soils in Makurdi Metropolis, Benue State, Nigeria
![]()
Department of Chemistry, University of Maiduguri, Maiduguri, Nigeria.
Email: *joechemakan@yahoo.com
Copyright © 2013 Joseph Clement Akan et al. This is an open access article distributed under the Creative Commons Attribution License, which permits unrestricted use, distribution, and reproduction in any medium, provided the original work is properly cited.
Received March 25th, 2013; revised April 28th, 2013; accepted May 25th, 2013
Keywords: Heavy Metals; pH; Organic Matter; Organic Carbon; Roadside Soil; Makurdi; Benue
ABSTRACT
Roadside soil samples were collected from four sites (heavy traffic area (Wurukum); industrial site (Gboko road); residential area (Federal Lowcost) and Federal Medical Center (Wadata) representing different activities across the Benue Metropolis. At each of the sample site, roadside soils were collected at different distance from the edge of the main road (2, 10, 30, 40 and 60 meters). In each of the distance, roadside soil were collected at three depth of 0 - 1 cm, 2 - 4 cm and 4 - 6 cm for the determination of pH, organic matter, organic carbon, Cu, Cd, Fe, Pb, As, Mn, Zn, Cd and Ni. pH, electrical conductivity (EC), organic matter and organic carbon were determined using standard procedures, while heavy metals were determined using Perkin-Elmer Analyst 300 Atomic Absorption spectroscopy (AAS). Zinc was observed to show the higher levels in all the sampling sites, such higher level can be related back to the wear-and-tear of vehicle components as a result of the stop-start traffic patterns and brake pads. The concentrations of all the metals in the four sampling sites decreased exponentially with distance from the edge of the road and dropped to the minimum levels at about 60 meters. Similarly, mean concentrations of Cu, Fe, Pb, As, Mn, Zn, Cd and Ni were significantly higher around the industrial area (Gboko road) and heavy traffic (Wurunkum) areas than other sampling areas followed an increasing trend with the increase in depth. The vertical movement of all the metals, exhibited predominant association with soil pH and organic carbon. From the results of this study, the pH of the roadside soils from all the sampling points ranged from 4.56 to 7.71, which enhances increased of heavy metals down the soil profiles. Organic carbon content ranged of 0.27% to 5.44% across all the sampling points appears to increase the mobility of all the metals to a depth 6 cm. The values of the heavy metals suggest that automobiles and traffic activities are a major source of these metals in the roadside soil within the study area. Also, with the exception of Pb, Fe and Cd, the levels of Cu, As, Mn, Zn and Ni in the present study were lower as compared with results found by other researcher in various countries worldwide.
1. Introduction
Urban soils act as a sink for heavy metals and other pollutants, possible sources of which are mainly from anthropogenic activities such as vehicular emissions [1], waste water sludges and industrial wastes [2]. Uncontrolled development and urbanization has also resulted in accelerating input of heavy metals in urban soils. In the last few decades, anthropogenic activities like industrial and energy production, construction, waste disposal, domestic heating system and motor vehicles are continuously contributing towards and increase in the level of heavy metals in urban soils [3]. Heavy metal contents in soil are highly dependent on geochemical nature of parent material, their presence in the soil is due to natural weathering of parent rock material and pedogenic processes. Conversely, their accumulation in the soils is of considerable important because they are persistent, nonbiodegradable and toxic to biodats, if it exceeds threshold value [4].
The Soil forms chief component of an ecosystem and is the most endangered due to influence of various human activities related to Industrial, Agricultural, and Urban development [5]. Urban Soils vary spatially due to soil composition [6]. Urban areas are expanding all over the world utilizing more and more agricultural and natural areas [7] changes in land use and land cover are gaining wide recognition as a key driver responsible for environmental change [8]. In the last two decades, reduction of land cover is attributed to accelerated rate of urbanization along with explosive economic growth [9]. Land converted to urban land use such as housing, parks, industrial and disposal sites has resulted in loss of cultivated green land and arouses special attention [10,11]. Reviewed the global significance of land use which indicates that although in short term, modern land use practices have given increased supplies of material goods. They have also undermined many ecosystem services in the long term. Additional input of waste materials, landscaping and rapid change of land use also contribute towards an unpredictable modification of soil properties and poor soil structure increasing concentrations of heavy metals [12]. Change in land use has important consequences for many biological, chemical and physical processes in soils and indirectly to its environment due to land use changes, soil pollution has become important environmental issue in developing countries [13].
Air pollution can cause health problem, it can also damage the environment and property. It causes the thinning of the protective ozone layer of the atmosphere thus leading to climate changes. Air pollution results from a variety of causes not all of which are within human control. Probably the most important natural sources of air pollution are dust storms for desert areas and volcanic activity which sometimes pour large amount of ash and toxic chemical and particulates into the atmosphere. Globalization and civilization have led to air getting more and more polluted over the years. Air pollution is caused by both natural and man made sources. Major man made sources of ambient air pollution include industries, automobiles and power generation in indoor environment, tobacco smoke and combustion of solid fuel for cooking and heating are the most significant sources. Fuel combustion is the primary source of a large number of health damaging air pollutants including fine and respirable particulates matter, carbon monoxide (CO), Suphur dioxide (SO2), nitorgen oxides (NOx), volatile organic compounds (VOCs), Ozone (O3) and atmosphere lead. Some of these pollutants are directly by products of fuel combustion, but others such as ozone are formed in the air through chemical reaction with other agent in the atmosphere.
Heavy metals are natural component of the earth crust unlike organic pollutants, which are broken down to greater or lesser extent depending on their activity, metals degraded and will remain in the soil permanently unless they are re-suspended and relocated by wind or leached out.
Soil pH is an indication of the acidity or alkalinity of the soil and is measured in pH units. Soil pH is defined as the negative logarithm of the hydrogen concentration. The pH scale goes from 0 to 14 with pH 7 as the neutral point. As the amount of hydrogen ions in the soil increase the soil pH decreases thus becoming acidic. From pH 7 to 0 the soil is increasingly more acidic and from PH 7 to 14 the soil is increasingly more alkaline or basic. One of the most important Pb sources in an urban environment is vehicle emission. In recent years, numerous studies have assessed the influence of traffic emissions on the levels of Pb. [14-16] shows that the combustion of leaded gasoline was the primary source of Pb, in addition some workers have reported a positive correlation between Cu, Zn and Pb and have interpreted it as derivation of the same source of contaminants [17,18]. Similarly, the environmental chemistry of chromium has been widely studied [19]. The two common oxidation states of Cr present in the environment that is Cr(III) and Cr(VI) are drastically different in charge. Chromium(III) is considered to be a trace element essential for the proper functioning organisms opposing party. Chromium(VI) exerts toxic effects or biological systems. The mobility and bioavailability of Cr depend fundamentally on its oxidation state. Chromium(VI) compounds are usually highly soluble, mobile and bioavailable compared to sparingly soluble trivalent Cr species. [20,21] have reported an anomalous occurrence of Cr in soil samples surrounding the industrial zone. These studies are in agreement about the Cr(III)/Cr(VI) proportion in these samples being the dominant species Cr(III) and in a lower proportional Cr(VI). An exact quantification of each species rather than the total Cr level is required to properly evaluate physiology and toxicological effects of Cr and its distribution and transport in the environment.
Makurdi, capital of Benue state located between latitude 7˚44'0"N and longitude 8˚32'0"E it occupies a land area of about 34,059 square km with an estimated population of about 5,181,642. Makurdi has a distinct season. The rainy season which runs from the month of April to October and dry season from the month of November through the end of April. The temperature ranges from 43˚C to 24˚C during the dry season and in the rainy season temperature ranges from 28˚C to 32˚C. There are some industries that greatly pollute the environment through gaseous emission. Markurdi Metropolis is polluted by both vehicular and industrial activities which might contain heavy metals that can affect humans upon inhalation. Hence, the need for this study.
2. Materials and Methods
2.1. Sample Collection Point
Samples were collected in Makurdi located in Benue State, Nigeria. Samples were collected from heavy traffic area (Wurukum); industrial site (Gboko Road); residential area (Federal Lowcost) and Federal Medical Center (Wadata) in Makurdi, Benue State, Nigeria. At each of the sampling site, samples were collected at different distance from the edge of the main road (2, 10, 30, 40 and 60 meters). In each of the distance, soil samples were collected at three depth (0 - 1 cm, 2 - 4 cm and 4 - 6 cm), by using spiral auger of 2 - 5 cm diameter in all cases, roadside soil samples were place in clean plastic bags and transported to the laboratory.
2.2. Sample Preparation
All roadside soil samples were dried and ground, using a pestle and mortar, to ensure homogeneity; the samples were sieved through 2 mm mesh sieve. The samples were then place in clean plastic bags and sealed pending digestion and analysis.
2.3. Digestion of Soil Samples for Heavy Metals Determination
Two grammes of the oven dried roadside soil samples were weighed into a led washed glass beaker. Soil samples were digested by the addition of 20 cm3 of aqua regia mixture of HCl and HNO3, ratio 3:1) and 10 cm3 of 30% H2O2. The H2O2 was added in small portions to avoid any possible over flow leading to loss of material from the beaker. The beakers were covered with watch glass, and heated over a hot plate at 90˚C for two hours. The beaker wall and watch glass were washed with distilled water and the samples were filtered out to separate the insoluble solid from the supernatant liquid. The volume was adjusted to 100 cm3 with distilled water.
2.4. Elemental Analysis of Samples
Determination of Cu, Cd, Fe, Pb, As, Mn, Cd and Ni were made directly on each final solution using Perkin— Elmer Analyst 300 Atomic Absorption spectroscopy (AAS).
2.5. Calibration Solution
Standard solution of each sample Cu, Cd, Fe, Pb, As, Mn, Cd and Ni were prepared according to the manufacturer procedure for atomic absorption spectroscopy to be used. Known 1000 mg/L concentration of the metal solution were prepared from their salts.
2.6. Determination of pH and Organic Matter
The pH was measured using 1:2 soil, water ratio [22] with the pH meter. Organic matters were determined using Anne method (modified walkey-Black method) [23].
2.7. Data Handling
Data collected were subjected with one-way analysis of variance (ANOVA) to assess whether heavy metals varied significantly between location and distances from the road, possibilities less than 0.05 (p < 0.05) will be considered statistically significant.
3. Results
3.1. Concentrations of Heavy Metals in Roadside Soil Samples
The concentrations of some heavy metals with respect to depth and distances from the road within Gboko Road (industrial area) in Benue Metropolis are as presented in Figure 1. The mean levels of Cu with respect to distance
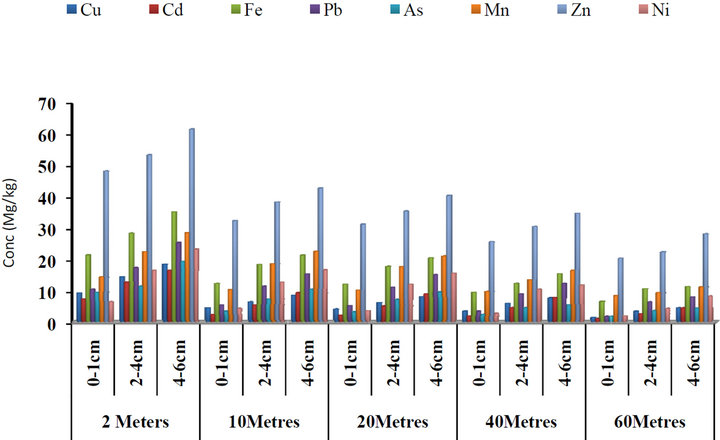
Figure 1. Concentrations of some heavy metals in roadside soils around Gboko road (industrial area) with respect to depth and distance from the road, Benue State.
from the road and depth ranged from 1.43 to 18.45 μg/g and Cd concentrations ranged from 1.05 to 16.45 μg/g; 6.54 to 35.11 μg/g Fe; 1.78 to 25.34 μg/g Pb; 1.77 to 19.34 μg/g As; 8.45 to 28.12 μg/g Mn; 20.21 to 61.56 μg/g Zn and 4.34 to 23.23 μg/g Ni. The highest concentrations of all the metals were observed at a distance of 2 meters close to the road and at depth a 4 - 6 cm, while the lowest concentrations were detected at 60 meters away from the road. Figure 2 present the concentrations of some heavy with respect to depth and distances from the road within Federal Medical Centre in Benue Metropolis. The concentrations of Cu ranged from 1.03 to 21.34 µg/g; 0.89 to 13.23 μg/g Cd; 3.22 to 27.34 μg/g Fe; 1.11 to 17.34 μg/g Pb; 1.12 to 14.34 μg/g As; 4.23 to 22.34 μg/g Mn; 10.34 to 63.54 μg/g Zn and 0.32 to 28.45 μg/g Ni. Figure 3 present the concentrations of some heavy metals with respect to depth and distances from the road within Federal Lowcost Housing (residential area). The concentrations of Cu ranged from 0.11 to 8.02 µg/g; 1.34 to 8.74 μg/g Cd; 0.43 to 26.12 μg/g Fe; 0.22 to 5.28 μg/g Pb; 0.16 to 3.77 μg/g As; 2.10 to 91.21 μg/g Mn; 3.23 to 60.21 μg/g Zn and 0.11 to 6.21 μg/g Ni. The mean concentrations of some heavy metals with respect to depth and distances from the road within Wurukum junction (Heavy traffic area) in Benue Metropolis are as presented in Figure 4. Cu concentrations ranged from 1.23 to 44.21 µg/g; 0.34 to 28.64 μg/g Cd; 2.34 to 48.54 μg/g Fe; 44.31 to 155.44 μg/g Pb; 0.15 to 25.43 μg/g As; 1.22 to 36.05 μg/g Mn; 6.32 to 90.43 μg/g Zn and 0.34 to 28.45 μg/g Ni.

Figure 2. Concentrations of some heavy metals in roadside soils around Federal Medical Centre with respect to depth and distance from the road, Benue State.
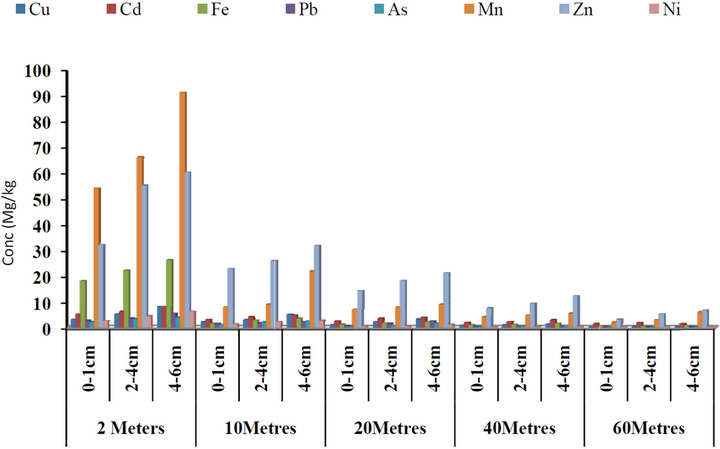
Figure 3. Concentrations of some heavy metals in roadside soils around Federal Lowcost housing (residental area) with respect to depth and distance from the road, Benue State.

Figure 4. Concentrations of some heavy metals in roadside soils within Wurukum junction (heavy traffic area) with respect to depth and distance from the road, Benue State.
3.2. Concentrations of pH, Electrical Conductivity (EC), Organic Carbon and Organic Matter
Roadside Soil Samples
The mean concentrations of pH, electrical conductivity (EC), organic carbon and organic matter with respect to depth and distances from the road within Gboko Road (industrial area) in Benue Metropolis are as presented in Figure 5. The concentrations of pH ranged between 4.98 and 7.45; 14 and 172 µS∙cm−1 Conductivity; 0.27% and 5.44% organic carbon and 0.33% and 3.19% organic matter. Figure 6 present the concentrations of pH, electrical conductivity (EC), organic carbon and organic matter with respect to depth and distances from the road within Federal Medical Centre in Benue Metropolis. The mean concentrations of pH ranged between 4.56 and 6.77; 28 and 87 µS∙cm−1 Conductivity; 0.94% and 2.98% organic carbon and 0.47% and 3.62% organic matter. Figure 7 present the concentrations of pH, electrical conductivity (EC), organic carbon and organic matter with respect to depth and distances from the road within Federal Lowcost Housing (residential area) in Benue Metropolis. The mean concentrations of pH ranged between 5.34 and 6.64; 9.23 and 154.80 µS∙cm−1 Conductivity; 0.78% and 4.17% organic carbon and 0.12% and 3.53% organic matter. For Figure 8, the levels of pH from Wurukum junction (industrial area) ranged between 6.21 and 7.72; 21.07 and 98.91 µS∙cm−1 Conductivity; 0.45% and 4.34% organic carbon and 0.51% and 3.79% organic matter.
4. Discussion
4.1. Heavy Metals in Roadside Soil Samples
4.1.1. Copper (Cu)
It is known that Cu is an essential element, yet it may be toxic to both humans and animals when its concentration exceeds the safe limits, and its concentration in some human tissues such as thyroid can be changed depending on the tissue state. The highest Cu concentration of 44.21 µg/g was detected at Wurukum junction (heavy traffic area), which is located at the major commercial area with high vehicular activities, while the lowest concentration of 3.22 µg/g was observed at the Federal lowcost housing area. The reason for the presence concentrations of Cu in the roadside soil samples might be due to corrosion of metallic parts of cars derived from engine wear, thrust bearing, brushing, and bearing metals [24]. Cu concentrations found in this study are lower than that of dust samples reported by other literatures such as 80.2 mg/kg in Karak, Jordan [24], 1902.73 mg/kg in Delhi [25]. Copper exhibited high levels of at a distance of 2 meters closer to the highway and decreases with distance from the highway.
The concentrations of copper in all the sampling points’ increases with increased in depth. Copper mobility down to 15 cm has been detected in roadside soil by [26], while [27] in their study on roadside soil observedincreased Cu down to a depth of 160 cm. In the present study, the high levels of Cu (8.32 to 44.21) were noted down to 6 cm. This result is in accordance with the findings of [28]. [29] observed significant Cu levels beyond 10 cm depth, while
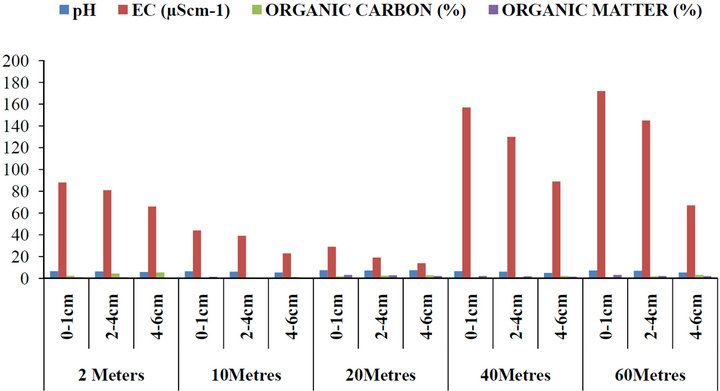
Figure 5. Concentrations of pH, EC, organic carbon and organic matter in roadside soils around Gboko road (industrial area) with respect to depth and distance from the road, Benue State.
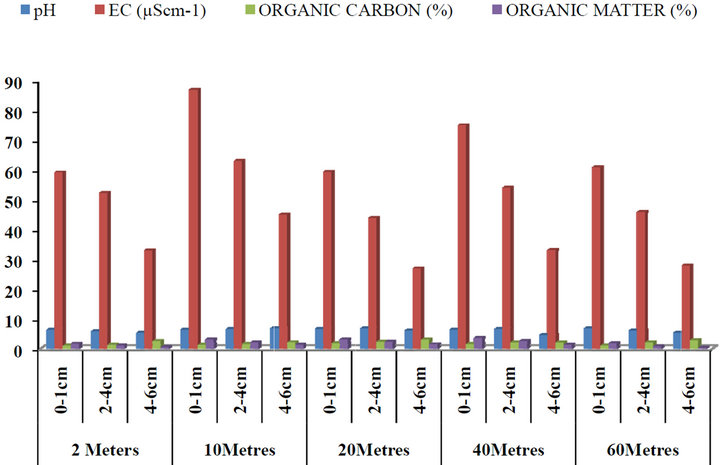
Figure 6. Concentrations of pH, EC, organic carbon and organic matter in roadside soils around Federal Medical Centre with respect to depth and distance from the road, Benue State.
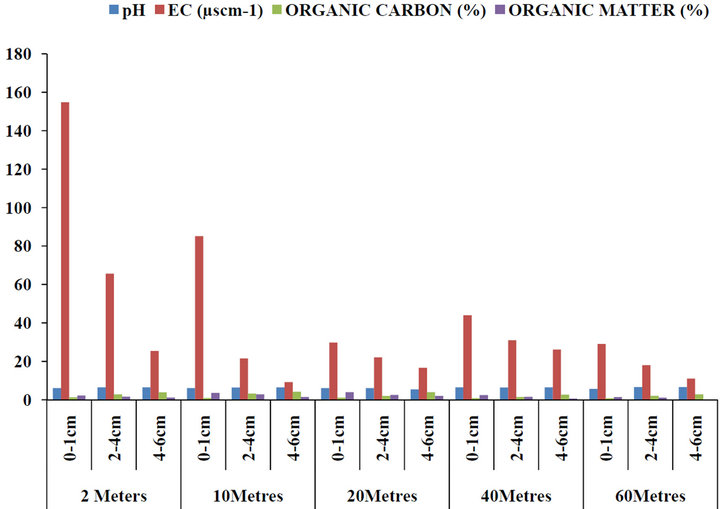
Figure 7. Concentrations of pH, EC, organic carbon and organic matter in roadside soils around Federal Lowcost housing (residential area) with respect to depth and distance from the road, Benue State.

Figure 8. Concentrations of pH, EC, organic carbon and organic matter in roadside soils within Wurukum junction (heavy traffic area) with respect to depth and distance from the road, Benue State.
[30] recorded predominant Cu level to a depth of 15 cm. [26] in their study observed increase in Cu from 0 to 2 cm to 6 to 8 cm depth. Data from the present study however consistently demonstrated maximum Cu with increase in depth. This suggests subsurface percolation and mobility within the soil body. However, the concentrations of Cu in the current study were lower to those recorded in soils samples of Torino (171 μg/g) [31]; Guangdong (576.5 μg/g) [32] and Palermo (82.27 μg/g) [33]. Except for Wurukum (heavy traffic area) at a distance of 2 meters which is closer to the road, the results of this study also indicated relatively lower concentrations of Cu as compared to results reported in Beijing (23.7 µg/g) [34] and Xuzhou (38.2 µg/g) [35].
4.1.2. Cadmium (Cd)
Cadmium is mostly encountered in cadmium-nickel battery production, although it continues to be used in paints as well as in plastic production where it is an effective stabilizing agent. Occupational exposure to cadmium can occur through metal refining processes, where cadmium is often associated with copper and can be released into the atmosphere during heating. Individuals exposed to cadmium can develop osteoporosis, anemia, eosinophilia, emphysema, and renal tubular damage. Long-term cadmium toxicity can produce Itai-Itai disease, in which individuals suffer from bone fractures, severe pain, proteinuria, and severe osteomalacia [3]. The highest Cd concentration of 28.64 µg/g was detected at wurukum junction (heavy traffic area), this area is located at the major commercial area with high vehicular activities. Cd concentrations found in this study are higher than dust samples reported by other literature such as 2.9 mg/kg in Aqaba, Jordan [36]. Cd exhibited high levels at a distance of 2 meters which is closer to the highways, and decreases Data from the present study however consistently demonstrated maximum Cd concentrations with increase in depth. The highest levels of Cd in the roadside soil closer to the highways within all the sampling points could pose a serious health risk in urban environments. This is because the small particle sizes have the potential to be taken up by the lungs. Although the wear-and-tear of tyres is recognized as a major source of cadmium alongside roadways, this study suggests that the combustion of fuel (especially diesel) and oil/lubricants, which are known to contain trace levels of cadmium, may be a significant source of Cd as found in roadside soil within the present study. It was reported that the cadmium level in car tires is in the range of 20 to 90 µg/g as associated with Cd contamination in the process of vulcanization [37]. However, results detected in the present study shows that Cd was higher than those found in Baltimore (1.06 µg/g) [38]. Beijing (0.14 µg/g) [34] and Aviles, Spain 2.16 µg/g [39]. Cadmium and Zinc are found in lubricating oils as part of many additives.
4.1.3. Iron (Fe)
Iron was found to be the dominant metals as compared with other heavy metals in the roadside soil. Iron is vital for almost all living organisms, participating in a wide variety of metabolic processes, including oxygen transport, DNA synthesis, and electron transport. It is known that adequate iron in a diet is very important for decreasing the incidence of anemia. High concentration of Fe (48.54 µg/g) in the soil samples was observed at the wurunkum junction (heavy traffic area), while Federal Lowcost housing (residential area) shows the lowest value. The variations of Fe in all the sampling points might be due to the differences in traffic density. The possible source of iron in the roadside soil samples might be brake lining material. Results of analysis of variance (ANOVA) confirmed a significant difference in the concentrations of Fe within the sampling points. [26] noted increase in Fe from 0 to 2 cm to 6 to 8 cm depth. Data from the present study however consistently demonstrated maximum Fe with increase in depth. However, the concentrations of Fe in the current study were higher than those recorded in soils samples of Xuzhou (3.38 µg/g) and Aviles, Spain (3.36 µg/g) [39].
4.1.4. Lead (Pb)
Lead is a nondegradable and toxic element [40]. Pb inputs in urban soils probably come from vehicles that use gasoline additives [41]. The highest Pb concentration of 155.44 µg/g was detected at wurunkum junction (heavy traffic area), which is located at the center of MarkurdiMetropilis with huge vehicular activities. Lead, which is the most concern in environmental heavy metal pollution exhibited high levels as we got closer to the highway. The most probable source of lead is the lead particulate matter emitted from gasoline vehicles which settles not far from the highway. As the distance from the road increased, the Pb levels in all the sampling points fell sharply to lower levels. However, some investigators found that lead contamination of soil may reach 100 m from the main road [42]. Lead emitted to the environment is associated with human activity [43]. [10] reported lower concentration of Pb in urban soils of Galway in comparison to present study, also lower concentrations of Pb (17 and 3.6 μg/g) were found in surface soils of Damuscus and Vietnam [44,45].
4.1.5. Manganese (Mn)
The deficiency of manganese in the human body can produce severe skeletal and reproductive abnormalities in mammals. High doses of manganese produce adverse effects primarily on the lungs and on the brain. The highest Mn concentration in the roadside soil samples was observed at the Wurukum junction (heavy traffic area), follow by Gboko road (industrial area), while the lowest Mn concentrations was detected at the Federal lowcost housing (residential area). Results of analysis of variance (ANOVA) confirmed a significant difference in the Mn content within the sampling points. Mn concentrations found in this study are lower than the value of 107 µg/g reported in Aqaba, Jordan [36].
4.1.6. Zinc (Zn)
Zinc, in the roadside soil close to the highway, exhibited elevated levels of all the sampling point studied. The highest Zn concentration of 90.43 µg/g was detected at Wurukum sampling point. The traffic situation in this area of study might be regarded as a source of zinc in the roadside soil. Wear and corrosion of vehicle parts (brakes, tyres, radiators, body and engine parts) might also be one of the potential sources of Zn in this area of study. Zn values in the roadside soil samples from the wurukum and Gboko sampling points were found to be higher than other sampling points. Generally, the major sources of Zn are probably the attrition of motor vehicle tire rubber exacerbated by poor road surfaces, and the lubricating oils in which Zn is found as part of many additives such as zinc dithiophosphates. The concentrations of Zn found in the present study are lower than that of roadside dust samples reported by other literature such as 499.20 mg/kg in Delhi [42], 123.2 mg/kg in Karak, Jordan [24], Torino 182 µg/g [31].
4.1.7. Nickel (Ni)
Nickel has many common industrial uses due to its unique chemical properties. Industrially, it is used in electroplating, electroforming, in circuitry, and in nickel-cadmium batteries. Metallic nickel is noncarcinogenic to humans; however, all other nickel compounds, such as nickel sulfides, oxides, and silicates, and other soluble salts are known carcinogens. Carcinogenic nickel exposure is greatest through the inhalation of nickel containing particulates. The burning of fossil fuels as well as the refining of metals such as copper introduces considerable amounts of nickel into the atmosphere [3]. The highest Ni concentration of 28.45 µg/g in the roadside soil samples was found at the Wurukum sampling point, while Federal lowcost housing sampling point shows the lowest value. This trend may be the result of high traffic density within the wurukum area. Results of analysis of variance (ANOVA) confirmed a significant difference in the Ni content in all the sampling points. Ni concentrations found in this study are lower than of dust samples reported by other literature such as 115 mg/kg in Aqaba, Jordan [24].
4.2. Mobility of Heavy Metals in Relation to pH and Organic Carbon
The pH of roadside soil in all the sampling points is in the acidic range. Organic mattervaried from 0.12% to 3.79%; 9.24 to 154.80 µS∙cm−1 and decreases with increased in depth (Figures 5-8). Organic carbonalso increased with depth. The effect of pH on heavy metal availability to plants has been reported by many researchers and it is accepted that as pH decreases, the solubility of cationic forms of metals in the soil solution increases and, therefore, they become more available to plants [46]. [46] explained that pH has a major effect on metal dynamics because it controls adsorption and precipitation, which are the main mechanisms of metal retention to soils. Metal solubility in the solution depends on the solubility product of the solid phase (precipitate) containing the metal. Since organic matter plays an important role in metal binding, some researchers have tested whether organic carbon (OC) compounds influence metal leaching. [47] reported that metals such as Cd, Ni and Zn may be influenced in their solubility characteristics from the presence of OC. They found a significant movement of Cd, Ni, Pb and Zn to a depth of 10 cm. Also [48] reported that heavy metals had a uniform distribution in the soil profile to a depth of 5 cm, due to their movement. Results such as these tend to agree with the present study, were movement of heavy metals down the soil profile (leaching) to a depth of 6 cm were observed through out the sampling points. pH is one of the factors which influence the bioavailability and the transport of heavy metal in the soil and according to [48] heavy metal mobility decreases with increasing soil pH (8 and above) due to precipitation of hydroxides, carbonates or formation of insoluble organic complexes. In the present study, it was observed that heavy metals increased significantly due to the acidic nature of the soil pH. The soil electrical conductivity (EC) also differed significantly among sampling points (P < 0.05). By comparism, [48] classified EC of soils as: non saline < 2; moderately saline 2 - 8; very saline 8 - 16; extremely saline > 16. From the result of the study, the EC is classified as extremely saline. The amount of heavy metals mobilized in soil environment is a function of pH, properties of metals, redox conditions, soil chemistry, organic matter content, cation exchange capacity [49]. Heavy metals are generally more mobile at pH < 7 than at pH > 7. From the results of this study, the pH of the roadside soils from all the sampling points ranged from 4.56 to 7.71, which enhances increased of heavy metals down the soil profiles. Organic carbon content ranged of 0.27% to 5.44% across all the sampling points appears to increase the mobility of all the metals to a depth 6 cm. [50] showed low solubility of Pb, Zn, Cd, and Cu at pH 6 to 6.5 and an increase by several orders at pH 2. Similarly, Pb, Cd, and Zn exhibited weak solubilities at slightly alkaline condition (pH 8), while at pH 3.3 solubility were higher [51]. In light of the above, the acidic nature of pH in the present study did not show any complexation of heavy metals with organic carbon, thereby resulting in the mobility of heavy metals down the soil profiles to a depth of 6 cm.
5. Conclusion
In all the sampling points, Fe and Zn show the highest concentrations in the roadside soil. The concentrations of all the metals in the four sampling sites decreased exponentially with distance from the edge of the road and dropped to the minimum levels at about 60 meters. Similarly, mean concentrations of Cu, Fe, Pb, As, Mn, Zn, Cd and Ni were significantly higher around the industrial area (Gboko road) and heavy traffic area (Wurunkum) than the residential area followed an increasing trend with the increase in depth. From the results of this study, the pH of the roadside soils from all the sampling points ranged from 4.56 to 7.71, which give rise to metal solubility down the soil profiles. The values of the metals in the present study suggest that automobiles and traffic activities are a major source of these metals in the roadside soil. Also, with exception of Pb, Fe and Cd, the levels of Cu, As, Mn, Zn and Ni in the present study were lower as compared with results found by other researcher in various countries worldwide.
REFERENCES
- R. A. Sutherland, “Bed Sediment Associated Trace Metals in an Urban Stream, Oaho, Hawaii,” Environmental Goelogy, Vol. 39, No. 6, 2000, pp. 611-627. doi:10.1007/s002540050473
- C. W. Jin, S. J. Zhang, Y. F. He, G. D. Zhou and Z. X. Zhou, “Lad Contamination in Tea Garden Soils and Factors Affecting Its Bioavialibility,” Chemosphere, Vol. 59, 2005, pp. 1151-1159.
- P. Lee, Y. Yu, S. Yun and B. Mayer, “Metal Contamination and Solid Phase Partitioning of Metals in Urban Roadside Sediments,” Chemosphere, Vol. 60, No. 5, 2005, pp. 672-689. doi:10.1016/j.chemosphere.2005.01.048
- I. Massas, S. Ehaliotis, S. Gerontids and E. Sarris, “Elevated Heavy Metal Concentrations in Top Soils of an Aegean Islan Town (Greece): Total and Available Forms, Origin and Distribution,” Environmental Monitoring and Assessment, 2008.
- M. Coskun, E. Stieness, M. V. Frontasyeva, E. Sjobakk and S. Demkina, “Heavy Metal Pollution of Surface Soil in the Thrace Region, Turkey,” Environmental Monitoring and Assessment, Vol. 119, No. 1-3, 2006, pp. 545-556. doi:10.1007/s10661-005-9042-3
- W. Burghardt, XVII Proceedings of Congres of International Soil Sicnecesoeicety, Bangkok, 2002, pp. 14-21.
- S. Norra and D. Stuben, “Global Soils,” Germany Journal of Soil and Sediments, Vol. 3, No. 4, 2003, pp. 230-233.
- J. Imberion, “Pattern and Development of Land Use Changes in the Kenyan Highlands Since the 1950’s,” Agriculture, Ecosystems and Environment, Vol. 76, No. 1, 1999, pp. 67-73.
- J. Chen, “Rapid Urbanization in China: Areal Challenge to Soil Protection and Food Security Cateria,” Vol. 69, 2007, pp. 1-15.
- N. M. Zhang, B. G. Li and K. L. Hu, “The Spatial Variation Characteristics of Lead and Cadmium in the Soil of the Sewage Irrigation Area,” Actapedologicasinica, Vol. 40, No. 1, 2003, pp. 152-154.
- J. A. Foley, A. Defries, G. P. Anser, G. Barford, G. Bonan and S. R. Capenter, “Global Consequences of Land Use,” Science, 2005, Vol. 309, No. 5734, pp. 570-574. doi:10.1126/science.1111772
- K. G. Tilller, “Urban Soil Contamination in Australia,” Australian Journal of Soil Research, Vol. 30, No. 6, 1992, pp. 937-957. doi:10.1071/SR9920937
- D. C. Adriano, “Trace Elements in Terrestrial Environments,” Biogoechemsitry, Bioavailability and Risks of Metals, Pringer, New York, 2001, pp. 45-65. doi:10.1007/978-0-387-21510-5
- F. Monna, M. Poujol, R. Losno, J. Dominik, H. Annegarn, and H. Coetzeee, “Origin of Atmosphere Lead in Johannesburn, South Africa,” Atmospheric Environment, Vol. 40, No. 34, 2006, pp. 6554-6566.
- Y. Sun, G. Zhuang, W. Zhang, Y. Wang and Y. Zhaung, “Charactersitics and Sources of Lead Pollution Afterpharsing out Leaded Gaoline in Beijing,” Atmospheric Environment, 2006, Vol. 40, No. 16, pp. 2973-2985. doi:10.1016/j.atmosenv.2005.12.032
- R. A. Ligero, M. Casas-Ruiz, M. Barrera, F. Lopez-Aguayo, D. Sales and D. Garcıa, “Environmental Impact of Unleaded Gasolines in the Bay of Ca´diz (Spain),” Environment International, Vol. 30, No. 1, 2004, pp. 99-104. doi:10.1016/S0160-4120(03)00152-1
- N. Sezgin, H. K. Ozcan, G. Demir, S. Nemlioglu and C. Bayat, “Determination of Heavy Metal Concentrations in Street Dust in Istanbul E-5 Highway,” Environment International, Vol. 29, No. 7, 2003, pp. 979-985. doi:10.1016/S0160-4120(03)00075-8
- R. Garcia and E. Millan, “Assessment of Cd, Pb and Zn Contamination in Roadside Soils and Grasses from Gipuzkoa (Spain),” Chemosphere, Vol. 37, No. 8, 1998, pp. 1615-1625. doi:10.1016/S0045-6535(98)00152-0
- F. Richard and A. C. M. Bourg, “Aqueous Geochemictry of Chromium a Review,” Water Research, Vol. 25, No. 7, 1991, pp. 807-816. doi:10.1016/0043-1354(91)90160-R
- M. A. Armienta, R. Rodrıguez, N. Ceniceros, F. Juarez and O. Cruz, “Distribution, Origin and Fate of Chromium in Soils in Guanajuato, Mexico,” Environmental Pollution, Vol. 91, No. 3, 1996, pp. 391-397. doi:10.1016/0269-7491(95)00040-2
- B. Isıklı, T. A. Demir, S. M. Urer, A. Berber, T. Akar and C. Kalyoncu, “Effects of Chromium Exposure from a Cement Factory,” Environmental Research, Vol. 91, No. 2, 2003, pp. 113-118. doi:10.1016/S0013-9351(02)00020-8
- C. Mathieu and F. Pieltain, “Chemical Analysis of Soils,” Selected Methods, France, 2003, p. 387.
- E. O. McLean, “Soil pH and Lime Requirement,” Keeney, Ed., Methods of Soil Analysis, Chemical and Microbiological Properties, 2nd Edition, American Society of Agronomy, Madison, 1982, pp. 199-224.
- O. A. Al-Khashman, “Heavy Metal Distribution in Dust, Street Dust and Soils from the Work Place in Karak Industrial Estate,” Jordan, Atmospheric Environment, Vol. 38, No. 39, 2004, pp. 6803-6812. doi:10.1016/j.atmosenv.2004.09.011
- E. Miguel, J. F. Llamas and E. Chacon, “Origin and Patterns of Distribution of Trace Elements in Street Dust: Unleaded Petrol and Urban Lead,” Atmospheric Environment, Vol. 31, No. 17, 1997, pp. 2733-2740. doi:10.1016/S1352-2310(97)00101-5
- A. S. Marsh and T. G. Siccama, “Use of Formerly Plowed Land in New England to Monitor the Vertical Distribution of Lead, Zinc and Copper in Mineral Soil,” Water Air Soil Pollution, Vol. 95, No. 1-4, 1997, pp. 75-85. doi:10.1007/BF02406157
- N. Yassoglou, C. Kosmas, J. Asimakopoulos and C. Kallianou, “Heavy Metal Contamination of Roadside Soils in the Greater Athens Area,” Environmental Pollution, Vol. 47, No. 4, 1987, pp. 293-304. doi:10.1016/0269-7491(87)90149-7
- A. M. Francek, “Soil Lead Levels in Orchard and Roadsides of Mission Peninsula, Michigan,” Water Air Soil Pollution, Vol. 93, No. 3-4, 1997, pp. 385-392.
- D. H. Khan and B. Frankland, “Effects of Copper, Cadmium and Lead on Plants with Particular Reference to Movement of Metals through Soil Profile and Plant,” Plant and Soil, Vol. 70, No. 3, 1983, pp. 335-345. doi:10.1007/BF02374890
- F. Beavington, “Contamination of Soil with Zinc, Copper, Lead and Cadmium in the Wollongong City Area,” Australian Journal of Soil Research, Vol. 11, No. 1, 1973, pp. 27-31. doi:10.1071/SR9730027
- M. Biasioli, H. Grcman, T. Kralj, F. Madrid, B. Diaz and F. Ajmone-Marsan, “Potentially Toxic Elements Contamination in Urban Soils: A Comparison of Three European Cities. ASA, CSSA and SSSA,” Journal of Environmental Quality, Vol. 36, No. 1, 2007, pp. 70-79. doi:10.2134/jeq2006.0254
- F. Zhou, H. Guo and Z. Hao, “Spatial Distribution of Heavy Metals in Hong Kong’s Marine Sediments and Their Human Impacts: A GIS Based Chemometric Approach,” Marine Pollution Bulletin, Vol. 54, No. 9, 2007, pp. 1372-1384. doi:10.1016/j.marpolbul.2007.05.017
- D. S. Manta, M. Angelone, A. Bellanca, R. Neri and M. Sprovieri, “Heavy Metals in Urban Soils: A Case Study from the City of Palermo (Sicily), Italy,” Science of Total Environment, Vol. 300, No. 1-3, 2002, pp. 229-243. doi:10.1016/S0048-9697(02)00273-5
- Y. M. Zheng, T. B. Chen and J. Z. He, “Multivariate Geostatistical Analysis of Heavy Metal Intopsoils from Beijing, China,” Journal of Soil and Sediments, Vol. 8, No. 1, 2008, pp. 51-58. doi:10.1065/jss2007.08.245
- X. Wang and Y. Qin, “Spatial Distribution of Metals in Urban Top Soils of Xuzhou (China): Controlling Factors and Environmental Implications,” Environmental Geology, Vol. 49, No. 6, 2006, pp. 905-914. doi:10.1007/s00254-005-0122-z
- O. A. Al-Khashman and R. A. Shawabkeh, “Metals Distribution in Soils around the Cement Factory Insouthern Jordan,” Environmental Pollution, Vol. 140, No. 3, 2006, pp. 387-394. doi:10.1016/j.envpol.2005.08.023
- Z. R. Nan, X. Wenqung and C. Y. Zhao, “Spatial Distribution of Selected Trace Metals in Urban Soils of Lanzhou City, Gansu Province, Northwestern of China,” IEEE International Conference on Geoscience and Remote Sensing Symposium, July 31-Aug 4.
- R. Y. Pouyat, I. D. Yesilonis, J. Russel-Anelli and N. K. Neerchal, “Soil Chemical and Physical Properties That Differentiate Urban Land-Use and Cover Types,” Soil Science Society of America Journal, Vol. 71, No. 3, 2007, pp. 1010-1019. doi:10.2136/sssaj2006.0164
- A. Ordonez, J. Loredo, E. De Miguel and S. Charlesworth, “Distribution of Heavy Metals in the Street Dusts and Soils of an Industrial City in Northern Spain,” Environmental Contamination and Toxicology, Vol. 44, No. 2, 2003, pp. 160-170. doi:10.1007/s00244-002-2005-6
- M. H. Arsalan, S. J. H. Kazmi and M. R. Mehdi, “A GIS Appraisal of Heavy Metals Concentration in Soil, GIS Development,” Land Information System, 2004, pp. 76- 81.
- X. D. Li, S. L. Lee, S. C. Wong, W. Z. Chi and I. Thornton, “The Study of Metal Contamination in Urban Soils of Hionk Using a GIS Based Approach,” Environment Pollution, Vol. 129, No. 1, 2004, pp. 113-124. doi:10.1016/j.envpol.2003.09.030
- A. D. K. Banerjee, “Heavy Metal Levels and Solid Phase Speciation in Street Dusts of Delhi, India,” Environmental Pollution, Vol. 123, No. 1, 2003, pp. 95-105. doi:10.1016/S0269-7491(02)00337-8
- G. Abrahim and R. Parker, “Heavy Metal Contamination in Tamaki Estuary: Impact of City Development and Growth, Auckland, New Zealand,” Environmental Geology, Vol. 42, No. 8, 2002, pp. 883-890.
- A. Möller, H. W. Muller, A. Abdullah, G. Abdelgawad and J. Uttermann, “Urban Soil Pollution in Damascus, Syria: Concentrations and Patterns of Heavy Metals in the Soils of the Damascus Ghouta,” Geoderma, Vol. 124, No. 1-2, 2005, pp. 63-71. doi:10.1016/j.geoderma.2004.04.003
- H. T. T. Thuy, H. J. Tobschall and P. V. An, “Distribution of Heavy Metals in Urban Soils a Case Study of Danang-Hoian Area (Veitnam),” Environmental Geology, Vol. 39, No. 6, 2000, pp. 603-610. doi:10.1007/s002540050472
- L. J. Evans, G. A. Spiers and G. Zhao, “Chemical Aspects of Heavy Metal Solubility with Reference to Sewage Sludge-Amended Soils,” International Journal of Environmental and Analytical Chemistry, Vol. 59, No. 2-4, 1995, pp. 291-302. doi:10.1080/03067319508041335
- A. Fotovat, R. Naidu and J. M. Oades, “The Effect of Major Cations and Ionic Strength on Desorption of Native Heavy Metals in Acidic and Sodic Soils,” The 1st International Conference on Contaminants in the Soil Environment, Adelaide, 1996, pp. 193-194.
- S. R. Smith and K. E. Giller, “Effective Rhizombium leguminosarum biovar Trifolii Present in Five Soils Contaminated with Heavy Metals from Long-Term Applications of Sewage Sludge or Metal Mine Spoil,”Soil Biology and Biochemistry, Vol. 24, No. 8, 1992, pp. 781-788. doi:10.1016/0038-0717(92)90253-T
- S. Sauve, H. W. Enderson and H. E. Allen, “Solid-Solution Portioning of Metals in Contaminated Soils: Dependence on pH, Total Metal Burden, and Organic Matter,” Environmental Science & Technology, 2000, pp. 1125- 1131.
- N. Ram and M. Verloo, “Effect of Various Organic Materials on the Mobility of Heavy Metals in Soil,” Environmental Pollution Series B, Vol. 10, No. 4, 1985, pp. 241- 248.
- M. C. Chaun, G. Y. Shu and J. C. Liu, “Solubility of Heavy Metals in a Contaminated Soil: Effects of Redox Potential and pH,” Water, Air and Soil Pollution, Vol. 90, No. 3-4, 1996, pp. 543-556. doi:10.1007/BF00282668
NOTES
*Corresponding author.