Agricultural Sciences
Vol.05 No.11(2014), Article ID:50119,9 pages
10.4236/as.2014.511110
Antimicrobial Potential and Phytochemical Content of Six Diverse Sources of Quinoa Seeds (Chenopodium quinoa Willd.)
Margarita Miranda1, José Delatorre-Herrera2, Antonio Vega-Gálvez1,3, Evelyn Jorquera1, Issis Quispe-Fuentes1, Enrique A. Martínez3*
1Department of Food Engineering, Universidad de La Serena, La Serena, Chile
2Department of Agriculture of Desert and Biotechnology, Facultad de Recursos Naturales Renovables, Universidad Arturo Prat, Iquique, Chile
3Centro de Estudios Avanzados en Zonas Áridas (CEAZA), Facultad de Ciencias del Mar, Universidad Católica del Norte, Coquimbo and La Serena, Chile
Email: *enrique.a.martinez@ceaza.cl
Copyright © 2014 by authors and Scientific Research Publishing Inc.
This work is licensed under the Creative Commons Attribution International License (CC BY).
http://creativecommons.org/licenses/by/4.0/


Received 8 July 2014; revised 16 August 2014; accepted 20 September 2014
ABSTRACT
Antimicrobial potential of quinoa seeds from six diverse seeds, grown in three distinctive geographical zones of Chile, was correlated with their total phenolic content (TPC), total flavonoid content (TFC) and total saponin content (TSC). The six seeds were Ancovinto, Cancosa, Cahuil, Faro, Regalona and Villarrica. A significant influence of quinoa source on chemical composition of seeds was observed. Extracts of all quinoa samples showed antimicrobial activity in the range of 8.3 - 14.8 mm inhibition zone for E. coli and 8.5 - 15.0 mm inhibition zone for S. aureus. Cancosa seeds had the highest antimicrobial action. The TPC and TFC ranged from 3.71 to 16.55 mg GA/100 g d.m. and 7.77 to 14.37 mg QE/100 g d.m., respectively. TSC varied from 1.78 to 3.08 g/100 g d.m. A correlation between TFC and antimicrobial activity was found. In conclusion, the six types of quinoa seeds were identified as potential sources of antioxidant compounds and antimicrobial activity.
Keywords:
Quinoa, Antimicrobial Activity, Phenols, Flavonoids, Saponin

1. Introduction
In recent years, there has been a dramatic increase in the number of reported poisoning outbreaks caused by food-borne pathogenic bacteria. Consequently, there has been considerable interest in preventing food contamination by food-borne pathogens. Traditionally, various methods, such as heating, reducing water activity, smoking, fermentation, UV radiation and adding antimicrobial agents, have been used to prevent spoilage of foods. The addition of antimicrobial agents has been a particularly effective method for controlling microbial contamination [1] .
A renewed interest has occurred to search for phytochemicals of native and naturalized plants for pharmaceutical and nutritional purposes [2] [3] . Plants produce a multitude of organic compounds that have antimicrobial activity. The compounds are found in various plant parts such as stems, roots, leaves, bark, flowers or fruits and seeds and include alliin/allicins, isothiocyanates, plant pigments, hydrolytic enzymes, proteins, essential oils and phytoalexins or phenolic compounds [3] . However, few reports refer to antimicrobial compounds in seeds although many of these chemical compounds are present in seeds or seed coats, including alkaloids, lectins, and phenolic compounds such as lactones, tannins and flavonoids for which strict standards are required [4] . These compounds probably function in the protection of seeds from microbial degradation until conditions are favorable for germination [3] [5] [6] .
Cultivated Quinoa (Chenopodium quinoa Willd.) was originated some seven thousand years ago from South America, in today’s countries such as Peru, Bolivia, Chile, Ecuador, Colombia and Argentina. This crop constitutes a great potential for agronomic demands because it can adapt to produce high grain yields under adverse or stressing conditions [7] [8] and it has been indicated by the FAO as one of the crops that could better fight hunger and poverty [9] . The major groups of main components that make effective antimicrobials include saponins, flavonoids, carvacrol, thymol, citral, eugenol, linalool, terpenes, and their precursors [10] . Phenolics, flavonoids and saponins have been identified as bioactive components from quinoa seeds [11] - [13] .
At present, the food industry is facing a tremendous pressure from consumers for increasing security what has provoked higher use of chemical preservatives to prevent the growth of food-borne and spoiling microbes. Then, reducing or eliminating chemically synthesized additives from foods is a current demand worldwide. A new approach to prevent the proliferation of microorganisms or to protect food from oxidation is the use of natural compounds as preservatives [14] .
The objective of this present investigation is to evaluate the antimicrobial potential of quinoa seeds (Chenopodium quinoa Willd.) from the three ancestral production areas of Chile and to correlate such potential with their phytochemical content.
2. Material and Methods
2.1. Origin of Quinoa Seeds and Preparation of Samples
The quinoa seeds (Chenopodium quinoa Willd.) were harvested from the three ancestral production areas of Chile from small-scale farmers that do not use chemicals such as pesticides (North Highlands at 19˚S, Center at 34˚S and Southern Chile at 39˚S). Six sources of quinoa were chosen (seeds belonging to the harvest season of 2010). The two north Highlands seeds were Ancovinto and Cancosa (two localities around 19˚S). The two center sources were Cahuil and Faro (both around 34˚S) and the two southern sources were La Regalona (official variety) and Villarrica (a locality around 39˚S). The samples were analyzed without a dehusking treatment, so that they were only inspected visually to discard contaminant particles or impurities. Analytical determinations were carried out on ground quinoa seeds using a grinder (MC0360, UFESA,
2.2. Proximate Analysis
The moisture content was determined by AOAC method n˚. 934.06 [15] . The crude protein content was determined using the Kjeldahl method with a conversion factor of 6.25 (AOAC n˚. 960.52). The lipid content was analyzed gravimetrically following Soxhlet extraction (AOAC n˚. 960.39). The crude fiber was estimated by acid/alkaline hydrolysis of insoluble residues (AOAC n˚. 962.09). The crude ash content was estimated by incineration in a muffle furnace at 550˚C (AOAC n˚. 923.03). The available carbohydrate was estimated by difference. All methodologies followed the recommendations of the Association of Official Analytical Chemists [15] . The results were expressed as g/100 g dry matter (d.m.).
2.3. Preparation of Extracts
Ten-gram of quinoa seeds finely ground of each source with 50 mL of absolute ethanol (99.0%, Sigma-Aldrich, Steinheim, Germany) were mixed. The mixtures were then left in the dark, at room temperature for 24 h with orbital shaker (Boeco OS-20,
2.4. Antimicrobial Activity
Extracts from seeds were tested for antimicrobial activity against two microorganisms, Staphylococcus aureus (ATCC 25923) (Gram-positive) and Escherichia coli (ATCC 25922) (Gram-negative), using the disk diffusion assay technique [3] [16] . All the bacterial strains were provided by the Chilean Institute of Public Health (Instituto de Salud Pública de Chile, ISP).
Disk Diffusion Assay
Petri plates were prepared with 20 ml of sterile Mueller-Hinton agar (Fluka, St. Louis, MO, USA) for bacteria and allowed to dry for 10 min [16] . The test organisms S. aureus and E. coli were grown at 37˚C on blood agar and MacConkey agar (Fluka, St. Louis, MO, USA), respectively. After 18 to 20 h incubation, each microorganism was diluted in sterile double distilled water to an approximate optical density of 0.5 using a MacFarland standard (1 × 10⁸ cfu/mL) [4] . Mueller-Hinton agar plates were swabbed on three axes with a sterile swab dipped in the freshly prepared diluted culture. 60 μL of each quinoa extract were individually applied to 6 mm sterile disks. Negative control was prepared using respective solvent (pure ethanol). When negative control disks were dry, all disks with extracts were transferred to Mueller-Hinton plates. Amoxicillin 100 μg/mL was used as positive control. Analyses were run in quadruplicate. The plates were inverted and incubated at 37˚C for 18 h. Inhibition zone measurements were reported as an average of the replicates showing antimicrobial activity [3] [16] .
2.5. Determination of Total Phenolic Content (TPC)
TPC was determined colorimetrically using Folin-Ciocalteau reagent (FC) according to Chuah et al. [17] with modifications. A 0.5 mL aliquot of the quinoa extract solution was transferred to a glass tube; 0.5 mL of reactive FC were added after 5 min; and 2 mL of Na2CO3 solution (200 mg/mL) were added and shaken. The sample was then mixed on a vortex mixer and the reaction proceeded for 15 min at ambient temperature. Then, 10 mL of ultra-pure water were added and the formed precipitate was removed by centrifugation during 5 min at 4000 rpm. Finally, the absorbance was measured in a spectrophotometer (Spectronic® 20 GenesysTM131,
2.6. Determination of Total Flavonoid Content (TFC)
TFC was determined according to the method of Zhishen et al. [18] and Liu et al. [19] with modifications. An aliquot (0.5 mL) of each extract or standard solution was mixed with 2 mL of dd H2O (deionised) and 0.15 mL of 5% NaNO2 solution. After 5 min, 0.15 mL of 10% AlCl3*10 H2O solution were added. After 6 min, 1 mL of 1 M NaOH solution was added and then the total volume was made up by 1.2 mL with dd H2O. Following thorough mixing of the solution, the absorbance against blank was determined at 415 nm. Quercetin (QE) (Sigma- Aldrich, Steinheim, Germany) was used for establishing the standard curve. The results were expressed as mg QE/100 g d.m.
2.7. Determination of Total Saponin Content (TSC)
TSC was analyzed based on the reverse-phase high-performance liquid chromatography (HPLC) procedure described by Madl et al. [20] and San Martin and Briones [21] with some modifications. First, 3 g of ground sample were extracted with an aqueous solution of ethanol 50% v/v (ratio 1:13) for 2 h under constant stirring on an orbital shaker (Boeco germany, OS-20) at 200 rpm. The extract was then removed by centrifugation (Centrifuge 5804R, Germany) for 25 min at 5000 rpm and the supernatant was dried at 50˚C for 20 h. HPLC analysis was conducted on an Agilent 1200 Series HPLC system which included a DAD set at 210 nm and an automatic injector. The separation was carried out using a ZORBAX Eclipse XDB-C18 column (4.6 × 150 mm , 5 μm) at 20˚C. The mobile phase consisted of an aqueous solution of 0.1% formic acid (A) and acetonitrile (B). A gradient system was applied, starting from a ratio of A:B of 75:25 (v/v) to a ratio of 65:35 (v/v) during 12 min with a constant flow rate of 0.7 mL/min. Then, the ratio was changed to 55:45 (A:B; v/v) and after a run time of 25 min flow rate was changed to 1.0 mL/min with isocratic elution until a total run time of 30 min. The injected sample volume was 5 μL with a concentration of 5 mg/mL of dry extract. A purified extract of total saponin (78% w/w) was used as standard and total saponins concentration in samples was expressed in g/100g d.m. All solvents were of HPLC grade (Merck, Darmstadt, Germany).
2.8. Statistical Analysis
Proximate analysis, TPC, TFC and TSC were applied in triplicate. All data were expressed as mean ± standard deviation (SD). Analysis of data was performed using Statgraphics Centurion XV (Statistical Graphics Corp.,
3. Results and Discussion
3.1. Proximate Analysis
The nutritional composition of six quinoa sources from the three different zones (Table 1) showed significant differences from the three geographic zones (p < 0.05). As expected, lower moisture content was observed for the northern drier zone as compared to the center-southern zones. The moisture content of the six sources ranged between 7.81 g/100 g d.m. (Ancovinto) and 15.20 g/100 g d.m. (Villarrica). Similar values were previously reported by Wright et al. [11] and other authors [22] [23] with moisture values between 8.2 to 16.6 g/100 g d.m. The highest ash and crude fiber contents were found in the southern zone, being Villarrica the one with highest values (3.74 and 2.88 g/100 g d.m of ash and crude fiber, respectively). Similar contents were reported by other studies [11] [24] . Protein content was also high in all quinoa sources and it ranged between 11.51 g/100 g d.m and 16.24 g/100 g d.m. (Table 1). Repo-Carrasco-Valencia et al. [22] working with quinoa from Perú found similar values between 11.32 and 14.72 g/100 g d.m. Interestingly, protein content of quinoa from all the zones was higher compared to the flours of cereals like rice, maize, and rye (containing 8 to 11 g/100 g d.m. [7] . The Cahuil type has a significantly higher content of fat (7.31 g/100 g d.m.) as compared to the other five sources (<6.7 g/100 g d.m.), with similar values to those reported for different quinoa sources by Miranda et al. [23] and Wright et al. [11] . The main component of all six sources was carbohydrates, which was calculated by difference; the variation in carbohydrate contents for different sources is attributed to the differences in the contents of other constituents.
3.2. Antimicrobial Activity
Two microorganisms were tested for their sensitivity to six different extracts of quinoa. The antimicrobial potential was initially determined by the agar disk-diffusion method. Table 2 presents diameters of inhibition zones (clear zones around disks) exerted by quinoa extracts towards tested microorganisms. All the extracts investigated displayed relevant antimicrobial activity (Table 2). Similar diameters of inhibition zones for E. coli and S. aureus were reported by Oliveira et al. [25] : > 9 mm (S. aureus) and < 1 mm (E. coli) working with aqueous extracts of walnut green husks from different cultivars Borchardt et al. [3] reported 7 - 20 mm (S. aureus)

Table 1. Proximal analysis of six quinoa ecotypes from three geographical zones of Chile.
All data are expressed as g/100 g d.m. Values are expressed as mean ± standard deviation (n = 3). Different letters denote significant differences among ecotypes (p < 0.05).
Table 2. Inhibition zones for extracts of quinoa seeds from diverse ecotypes.
Values are expressed as mean ± standard deviation (n = 4). Different letters denote significant differences among ecotypes (p < 0.05). 1Pure ethanol. 2Amoxicillin (100 μg/mL).
and 7 - 14 mm (E. coli) working with crude seed extracts from plants found in the Mississippi River Basin; Al-Zoreky [26] reprted 13 and 16 mm (S. aureus) and 16 mm (E. coli) working with pomegranate peel extracts; Khoobchandani et al. [16] reported 6 - 33 mm (S. aureus) working with Eruca sativa extracts and seed oil; Zeng et al. [27] reported 24.7 mm (S. aureus) and 19.5 mm (E. coli) working with water-soluble extract from pine needles and Keskin and Toroglu [28] reported 7 - 12 mm (S. aureus) and 7 - 14 mm (E. coli) working with extract of different species. Difference in the activity of quinoa extracts among studies could be partially explained by variations in bioactive agents of extract and strains sensitivity. The seeds that showed the highest bacterial inhibition zone were those of the Northern localities (Ancovinto and Cansosa) with an inhibition percentage higher than 62% for E. coli and higher than 51% for S. aureus. For both bacteria studied, Cancosa seeds had the highest antimicrobial action. The Gram-positive bacteria (S. aureus) were more sensitive to the quinoa antimicrobial action than the Gram-negative bacteria (E. Coli) as observed in Table 2. Khoobchandani et al. [16] reported that most of the Gram-negative bacteria are more resistant than the Gram-positive against antibiotics. Hence the excellent performance of the seed extract with Gram-negative (E. coli), as well as with Gram-positive (S. aureus), was particularly interesting.
3.3. Total Phenolic Content and Total Flavonoid Content
Polyphenols are bioactive secondary plant metabolites that are widely present in commonly consumed foods of plant origin. The three main types of polyphenols are flavonoids, phenolic acids and tannins, which act as powerful antioxidants in vitro [22] . There is very little information concerning polyphenols and antioxidant activity in Andean grains such as quinoa. Figure 1 shows TPC and TFC of the six seed types of quinoa studied (p < 0.05). TPC in quinoa extracts was different according to the seeds. Cahuil and Faro seeds showed the highest amount of these compounds, with 16.55 and 16.32 mg GA/100 g d.m., respectively, being 2 - 5-fold higher than

Figure 1. Total phenolic content and total flavonoid content of the six ecotypes of quinoa studied. Columns belonging to the same set of data with different letters are significantly different (p < 0.05).
for other seeds. The lowest amounts were obtained for Villarrica extracts with 3.72 mg GA/100 g d.m. (Figure 1). TPC values in the present study are lower than the values found in the literature. Miranda et al. [29] for seeds of quinoa from Elqui Valley, Chile, reported values of 28.41 mg GA/100 g d.m. and Alvarez-Jubete et al. [12] reported that the total phenolics content of quinoa from Bolivia were 71.7 mg/100 g d.m. Polyphenols are hydrophilic phytochemicals and thus more hydrophilic extractants are better solvents for their recovery from plants [30] . The mechanism responsible for phenolic toxicity to microorganisms is related to reaction with sulfhydryl groups of proteins and unavailability of substrates to microorganisms [30] .
Flavonoids are bioactive compounds that are found in the form of pigments in plant parts, such as fruits and flowers [10] . These are synthesized by plants as a response to environmental stress and microbial infections, and are known to have antioxidant, anti-inflammatory and also antimicrobial properties [31] . In this study, all quinoa extracts showed different TFC according to the seeds, as shown in Figure 1. TFC values ranged from 14.37 to 7.77 mg QE/100 g d.m. for Ancovinto (North-dry zone) and Villarrica (South-humid zone) seeds, respectively. Repo-Carrasco-Valencia et al. [22] reported that the total flavonoids content of quinoa from Peru was 11.6 - 55.5 mg QE/100 g which was higher than that found in this study. The antimicrobial activity of flavonoids is largely due to their ability to penetrate biological membranes [10] .
The antimicrobial constituents, e.g. phenolics and flavonoids, were present in all quinoa extracts and they might explain its broad-spectrum activity against microorganisms (Figure 1). Similar observations were reported by [30] regarding the correlation between total phenolics and the antibacterial activity of various plant extracts. Similarly, Zeng et al. [27] working with water-soluble extract from pine needles, which is rich in phenolic compounds and flavonoids, showed a broad spectrum of antimicrobial activity against gram-positive and gram-negative bacteria.
3.4. Total Saponin Content
Saponins are naturally occurring glycosides in many plants, such as Solanum and Allium spp., oats, soya, clover, and a variety of herbs and seeds [10] . In general, many saponins are also considered natural antimicrobial compounds making up part of plants’ defense systems [13] . TSC for all quinoa extracts was different according to the seeds (Figure 2). Cahuil seed showed the highest amount of these compounds, with 3.08 g/100 g d.m., being between 10% - 40% higher than for other seeds. The lowest amounts were obtained for Ancovinto seed with 1.79 g/100 g d.m. (Figure 1). Antimicrobial activities of saponins have been found against a wide range of microorganisms, such as P. fluorescens, E. coli, and Salmonella typhi [10] , since saponins interact with sterols and fatty acids on microbial membranes [10] . In a recent study, Quillaja Saponin-rich extracts also had antimicrobial activity against S. aureus [13] . In addition, Hassan et al. [13] suggest that saponins from various sources, extracted using different procedures, differ in their biological activities, most likely due to different chemical struc- tures. Although some saponins are mainly used as emulsifiers and flavoring agents in food and beverages, they
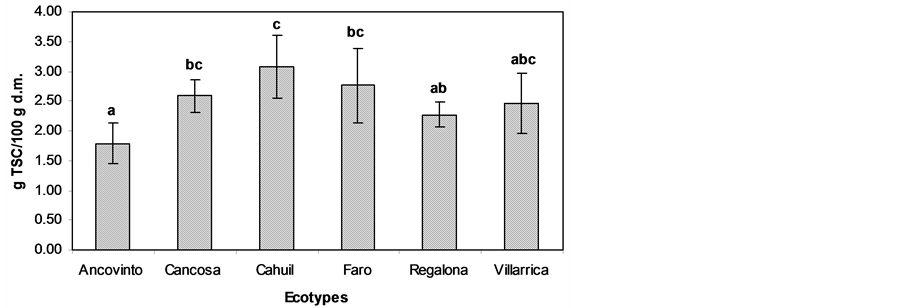
Figure 2. Total saponin content of quinoa seeds from different ecotypes. Columns belonging to the same set of data with different letters are significantly different (p < 0.05).
have potential for use as natural antimicrobials and preservatives for foods [10] .
3.5. Correlations between TPC, TFC, TSC and Antimicrobial Activity
Few literary sources are available on the relationship between TPC, TFC, TSC and antimicrobial activity. In the present study, a moderate and positively significant (p < 0.05) correlation between TPC and TSC (r = 0.60) was observed (Table 3). TSC showed a low and negative correlation (r = −0.17) for E. coli, but a positive correlation (r = 0.02) for S. aureus. The relationship between TFC and antimicrobial activities against E. coli and S. aureus was found moderate (r = 0.60 and 0.43, respectively) but positively significant (p < 0.05) for E. coli, indicating that flavonoid compounds might contribute to the antimicrobial activities against E. coli and S. aureus; while a weak and negative correlation was observed between TPC and antimicrobial activity against E. coli and S. aureus (r = −0.34 and −0.30, respectively) (Table 3). Although antimicrobial activity was observed with the extracts, it was not as high as the activity obtained with the antibiotics used as control (Table 2).
The overall analyzed dataset (Inhibition zones, TPC, TFC and TSC) in this study was used to plot the first and second main axis of the Principal Component Analysis (Figure 3). The first two principal components of the analysis explained 78.55% of the total variation of the variable-standardized data. It was possible to observe in the biplot that cold-temperate and arid environments were distributed and well separated between the left and right side of the central axis of PC1. The environment-induced relationship among variables and previous genotypes characterization [32] matched well in each quadrant of the biplot. Thus, describing positive correlation when vectors from the origin to each variable marker (white circle) presented an acute angle and a negative correlation when this was obtuse. This analysis gave a clear separation among the three geographical and genetic sources of quinoa used in this study.
According to the PCA for inhibition zones (Figure 4), the compounds that mainly contributed to the antimicrobial activity for both E. coli as S. aureus were TFC. Similar behavior was observed in Pearson’s coefficient correlations (Table 3).
4. Conclusion
Quinoa seeds from Chile contain important phenolic, flavonoid and saponin concentrations, showing to be very rich in bioactive compounds and having antioxidant and antimicrobial activity. A significant influence of the diverse quinoa seeds on chemical composition and phytochemical content was also observed (p < 0.05). All quinoa seeds have inhibitory activity against both gram-negative and gram-positive bacteria. Cancosa seed had the highest antimicrobial action. According to Pearson’s test and Principal Component Analysis, the compounds (TPC, TFC and TSC) that mostly contributed to the antimicrobial activity against both E. coli as S. aureus were TFC. Further studies are needed to characterize quinoa extracts and to identify the molecules responsible for this bioactivity. In addition, seeds of quinoa were identified as potential sources of antioxidant compounds and antimicrobial activity.
Table 3. Pearson’s coefficient correlations between TPC, TFC, TSC and inhibition zone of six quinoa ecotypes from three geographical zones of Chile.
a,bSignificant correlation at p < 0.05.

Figure 3. Loading plot of the Principal Component Analysis (PC1 × PC2) of diverse quinoa ecotypes and the relationship with the individual compounds present in the extract, where open ovals enclose the three main geographical origins: Squares represent High Plateau (two localities AN: Ancovinto, CA: Cancosa), triangles represent Central Chile (two localities FA: Faro, CH: Cahuil) and circles represent Southern Chile (Locality VI: Villarrica, RE: Regalona hybrid variety).
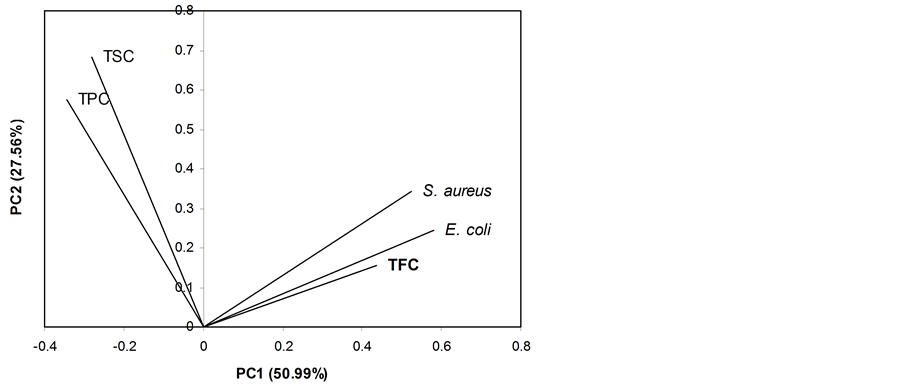
Figure 4. Plot of component weights of antimicrobial potential of the six ecotypes of quinoa studied.
Acknowledgements
The authors gratefully acknowledge the financial support of Project FONDECYT 1100638 and Research Department of Universidad de
References
- Kabuki, T., Nakajima, H., Arai, M., et al. (2000) Characterization of Novel Antimicrobial Compounds from Mango (Mangifera indica L.) Kernel Seeds. Food Chemistry, 71, 61-66. http://dx.doi.org/10.1016/S0308-8146(00)00126-6
- Wangensteen, H., Samuelsen, A.B. and Malterud, K.E. (2004) Antioxidant Activity in Extracts from Coriander. Food Chemistry, 88, 293-297. http://dx.doi.org/10.1016/j.foodchem.2004.01.047
- Borchardt, J.R., Wyse, D.L., Sheaffer, et al. (2009) Antioxidant and Antimicrobial Activity of Seed from Plants of the Mississippi River Basin. Journal of Medicinal Plants Research, 3, 707-718.
- Quan, C., Yao, H. and Hou, C. (2013) Certification and Uncertainty Evaluation of Flavonoids Certified Reference Ma- terials. Agricultural Sciences, 4, 89-96. http://dx.doi.org/10.4236/as.2013.49B016
- Cai, Y., Luo, Q., Sun, M., et al. (2004) Antioxidant Activity and Phenolic Compounds of 112 Traditional Chinese Me- dicinal Plants Associated with Anticancer. Life Sciences, 74, 2157-2184. http://dx.doi.org/10.1016/j.lfs.2003.09.047
- Komutarin, T., Azadi, S., Butterworth, L., et al. (2004) Extract of the Seed Coat of Tamarindus indica Inhibits Nitric Oxide Production by Murine Macrophages in Vitro and in Vivo. Food and Chemical Toxicology, 42, 649-658. http://dx.doi.org/10.1016/j.fct.2003.12.001
- Comai, S., Bertazzo, A., Bailoni, L., et al. (2007) The Content of Proteic and Nonproteic (Free and Protein-Bound) Tryptophan in Quinoa and Cereal Flours. Food Chemistry, 100, 1350-1355. http://dx.doi.org/10.1016/j.foodchem.2005.10.072
- Gely, MC. and Santalla, E. (2007) Moisture Diffusivity in Quinoa (Chenopodium quinoa Willd.) Seeds: Effect of Air Temperature and Initial Moisture Content of Seeds. Journal of Food Enginnering, 78, 1029-1033. http://dx.doi.org/10.1016/j.jfoodeng.2005.12.015
- Ruiz, K.B, Biondi, S., Oses, R., et al. (2013) Quinoa, Its Biodiversity and Crop Sustainability as Key Contributions towards World Food Security in the Face of Climate Change. Agronomy for Sustainable Development, 34, 349-359. http://dx.doi.org/10.1007/s13593-013-0195-0
- Juneja, V.K., Dwivedi, H.P. and Yan, X. (2012) Novel Natural Food Antimicrobials. Annual Review of Food Science and Technology, 3, 381-403. http://dx.doi.org/10.1146/annurev-food-022811-101241
- Wright, K.H., Pike, O.A., Fairbanks, D.J. and Huber, C.S. (2002) Composition of Atriplex hortensis, Sweet and Bitter Chenopodium quinoa Seeds. Journal of Food Science, 67, 1383-1385.
- Alvarez-Jubete, L., Wijngaard, H., Arendt, E.K. and Gallagher, E. (2010) Polyphenol Composition and in Vitro Antioxidant Activity of Amaranth, Quinoa, Buckwheat and Wheat as Affected by Sprouting and Baking. Food Chemistry, 119, 770-778. http://dx.doi.org/10.1016/j.foodchem.2009.07.032
- Hassan, S.M., Haq, A.U., Byrd, J.A., Berhowd, M.A., Cartwrightb, A.L. and Bailey, C.A. (2010) Haemolytic and Anti- microbial Activities of Saponin-Rich Extracts from Guar Meal. Food Chemistry, 119, 600-605. http://dx.doi.org/10.1016/j.foodchem.2009.06.066
- Deba, F., Xuan, T.D., Yasuda, M. and Tawata, S. (2008) Chemical Composition and Antioxidant, Antibacterial and Antifungal Activities of the Essential Oils from Bidens pilosa Linn. var. Radiata. Food Control, 19, 346-352. http://dx.doi.org/10.1016/j.foodcont.2007.04.011
- AOAC (1990) Official Method of Analysis. 15th Edition, Association of Official Analytical Chemists, Washington DC.
- Khoobchandani, M., Ojeswi, B.K., Ganesh, N., Srivastava, M.M., Gabbanini, S., Matera, R., et al. (2010) Antimicro- bial Properties and Analytical Profile of Traditional Eruca sativa Seed Oil: Comparison with Various Aerial and Root Plant Extracts. Food Chemistry, 120, 217-224. http://dx.doi.org/10.1016/j.foodchem.2009.10.011
- Chuah, A.M., Lee, Y.C., Yamaguchi, T., Takamura, H., Yin, L.J. and Matoba, T. (2008) Effect of Cooking on the Antioxidant Properties of Coloured Peppers. Food Chemistry, 111, 20-28. http://dx.doi.org/10.1016/j.foodchem.2008.03.022
- Jia, Z., Tang, M. and Wu, J. (1999) The Determination of Flavonoid Contents in Mulberry and Their Scavenging Effects on Superoxide Radicals. Food Chemistry, 64, 555-559. http://dx.doi.org/10.1016/S0308-8146(98)00102-2
- Liu, S.C., Lin, J.T., Wang, C.K., Chen, H.Y. and Yang D.J., (2009) Antioxidant Properties of Various Solvent Extracts from Lychee (Litchi chinenesis Sonn.) Flowers. Food Chemistry, 114, 577-581. http://dx.doi.org/10.1016/j.foodchem.2008.09.088
- Madl, T., Sterk, H., Mittelbach, M. and Rechberger, G.N. (2006) Tandem Mass Spectrometric Analysis of a Complex Triterpene Saponin Mixture of Chenopodium quinoa. Journal of the American Society for Mass Spectrometry, 17, 795- 806. http://dx.doi.org/10.1016/j.jasms.2006.02.013
- Martín, R.S. and Briones, R. (2000) Quality Control of Commercial Quillaza (Quillaja saponaria Molina) Extracts by Reverse Phase HPLC. Journal of the Science of Food and Agriculture, 80, 2063-2068.
- Repo-Carrasco-Valencia, R., Hellströmb, J.K., Pihlavac, J.M. and Mattila, P.H. (2010) Flavonoids and Other Phenolic Compounds in Andean Indigenous Grains: Quinoa (Chenopodium quinoa), Kañiwa (Chenopodium pallidicaule) and Kiwicha (Amaranthus caudatus). Food Chemistry, 120, 128-133. http://dx.doi.org/10.1016/j.foodchem.2009.09.087
- Miranda, M., Vega-Gálvez, A., Quispe-Fuentes,
- Jancurová, M., Minarovicová, L. and Dandár, A. (2009) Quinoa-A Review. Czech Journal of Food Science, 27, 71-79.
- Oliveira, I., Sousa, A., Ferreira, I., Bento, A., Estevinho, L. and Pereira, J.A. (2008) Total Phenols, Antioxidant Potential and Antimicrobial Avtivity of Walnut (Juglans regia L.) Green Husks. Food and Chemical Toxicology, 46, 2326- 2331. http://dx.doi.org/10.1016/j.fct.2008.03.017
- Al-Zoreky, N.S. (2009) Antimicrobial Activity of Pomegranate (Punica granatum L.) Fruit Peels. International Journal of Food Microbiology, 134, 244-248. http://dx.doi.org/10.1016/j.ijfoodmicro.2009.07.002
- Zeng, W.C., Jia, L.R., Zhang, Y., Cen, J.Q., Chen, X., Gao, H., et al. (2011) Antibrowning and Antimicrobial Activities of the Water-Soluble Extract from Pine Needles of Cedrus deodara. Journal of Food Science, 76, C318-C123.
- Keskin, D. and Toroglu, S. (2011) Studies on Antimicrobial Activities of Solvent Extracts of Different Species. Journal of Environmental Biology, 32, 251-256.
- Miranda, M., Vega-Gálvez, A., López, J., Parada, G., Sanders, M., Aranda, M., et al. (2010) Impact of Air-Drying Temperature on Nutritional Properties, Total Phenolic Content and Antioxidant Capacity of Quinoa Seeds (Chenopodium quinoa Willd.). Industrial Crops and Products, 32, 258-263. http://dx.doi.org/10.1016/j.indcrop.2010.04.019
- Shan, B., Cai, Y.Z., Brooks, J. and Corke, H. (2007) The in Vitro Antibacterial Activity of Dietary Species and Medici- nal Herb Extracts. International Journal of Food Microbiology, 117, 112-119. http://dx.doi.org/10.1016/j.ijfoodmicro.2007.03.003
- Kalogeropoulos, N., Konteles, S.J., Troullidou, E., Mourtzinos, I. and Karathanos, V.T. (2009) Chemical Composition, Antioxidant Activity and Antimicrobial Properties of Propolis Extracts from Greece and Cyprus. Food Chemistry, 116, 452-461. http://dx.doi.org/10.1016/j.foodchem.2009.02.060
- Fuentes, F., Martínez, E. A., Hinrichsen, P., Jellen, E.N. and Maughan, P.J. (2009) Assessment of Genetic Diversity Patterns in Chilean Quinoa (Chenopodium quinoa Willd.) Germplasm Using Multiplex Flourescent Microsatellites Markers. Conservation Genetics, 10, 369-377. http://dx.doi.org/10.1007/s10592-008-9604-3
NOTES

*Corresponding author.