American Journal of Plant Sciences
Vol.10 No.08(2019), Article ID:94631,6 pages
10.4236/ajps.2019.108099
The Effect of Calcium to Maize Seedlings under Drought Stress
Diwen Fan
The Experimental High School Attached to Beijing Normal University, Beijing, China

Copyright © 2019 by author(s) and Scientific Research Publishing Inc.
This work is licensed under the Creative Commons Attribution International License (CC BY 4.0).
http://creativecommons.org/licenses/by/4.0/


Received: July 18, 2019; Accepted: August 24, 2019; Published: August 27, 2019
ABSTRACT
Global warming brings a series of problems, including the worsening of drought stress worldwide. This paper aims to find optimal Calcium-using strategies in realistic events of drought stress. Maize seedlings were grown in solutions with differing Ca2+ concentrations, and PEG6000 was used to simulate drought stress. Several physiological indexes were measured to determine the effect of Calcium ions on maize seedlings under drought stress. Results show that a calcium concentration of 10 mM yields best results under both normal and drought conditions, but the lower calcium concentration of 2 mM may be more favorable in short-term drought stress situations.
Keywords:
Maize Seedlings, Drought Stress, Calcium-Using Strategies

1. Introduction
Calcium is an essential element for plants, functioning as a second messenger in cells, and can influence aquaporins on membrane structures, helping plants resist many kinds of environmental stress [1] . Maize is an extremely important crop worldwide, and it possesses the relatively efficient C4 pathway for photosynthesis, which many staple crop species lack. In the foreseeable future, drought stress will only become more severe due to population growth and global climate change, threatening large areas of maize farmland [2] . Thus, research concerning the drought resistance of maize seedlings is significant. It is widely accepted academically that Calcium ions can facilitate plants resist drought stress [3] . However, research concerning the effects of different concentrations of Calcium on maize seedlings under drought stress is relatively lacking. Immersing maize seeds in solutions containing Calcium ions can help them resist drought stress, but this method would very likely encounter problems in practice. It may be hard for peasants to correctly make the solution, and if seed sellers immerse the seeds themselves, the seeds will quickly begin to germinate, creating difficulties for transportation and storage. Based on these reasons, maize seedlings were used as the experimental subject, and the influence of different Calcium solutions on maize seedlings under drought stress is explored with the goal of finding a strategy that works best in real-world situations.
2. Materials and Methods
Healthy, non-infected B73 maize seeds were used for the experiment. They are first sterilized for 25 min with 10% H2O2 solution, and then rinsed in clear water five times. The seeds are put in a lightproof tray with moist paper for germination. The seedlings are separated into 6 groups, with 25 plants per group. All saplings are grown in the same room at 23˚C and 40% humidity under a 100 W LED light. Calcium treatment starts after most seedlings enter the three-leaf phase. 6 different Calcium concentrations are applied to the roots of each group: 0 mM, 2 mM, 5 mM, 10 mM, 20 mM, and 40 mM. 15% PEG6000 is added to the root nutrient solution of all groups after 12 days to simulate drought stress. Several groups of data are taken. It is hypothesized that the values would follow a curve with one peak and become lower farther away from the peak.
Leaf length and width are measured by a ruler. Leaves are spread out flat and one end of the ruler is aligned with the bases of leaves. The lengths from the base to the furthest point where leaves are still green are used. The growth rates of leaves were calculated through dividing the product of the amount of change in leaf length and width by the value of leaf length and width, which is further used to calculate the mean leaf growth rate of every group. SPAD value is measured with equipment after PEG is added. The SPAD values of the tips, middle section and bases of each fully grown leaf on every seedling were measured, and their mean is used to represent the mean SPAD value of their respective groups.
3. Results and Analysis
The mean leaf length and width of each group is shown in Graph 1 and Graph 2. After Ca2+ is added and before drought stress is simulated, the 10 mM group produced the highest mean leaf length and width in all groups, and this value is significantly higher than the values of the other groups. After drought stress is simulated, the 10 mM group still expressed the highest mean leaf length in all groups, and its mean leaf width is only slightly lower than that of the 2 mM group. The 5 mM group expressed extremely low leaf length and width, lower than both the 0 mM group and the 2 mM group. The 2 mM group’s leaf length and width are surprising; instead of following the pattern and being low, the mean leaf length is near to that of the 10 mM group, and the mean leaf width is slightly higher than the 10 mM group. In contrast to the 2 mM group, the 5 mM group displayed strangely low leaf width and length, even lower than the 0 mM group, before PEG was added.
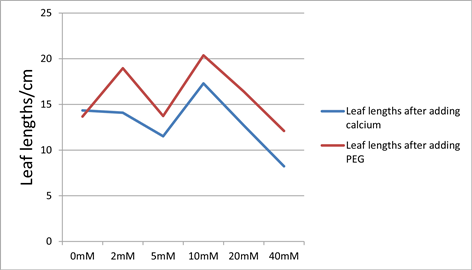
Graph 1. The mean leaf length of every group. Blue lines represent values measured 12 days after Ca2+ ions are added. Red lines represent values measured 6 days after PEG is added. The mean leaf width of the groups did not differ significantly before adding Ca2+ ions.
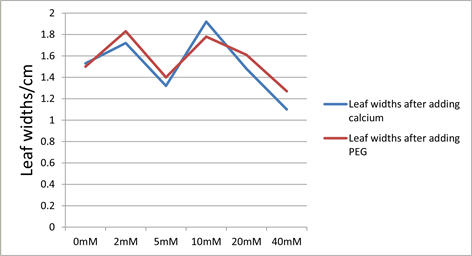
Graph 2. The mean leaf width of every group. Blue lines represent values measured 12 days after Ca2+ ions are added. Red lines represent values measured 6 days after PEG is added. The mean leaf length of the groups did not differ significantly before adding Ca2+ ions.
The mean SPAD values of every group are shown in Graph 3. Under simulated drought conditions, the 10 mM group expressed the highest mean SPAD value in all the groups. The mean SPAD values of the 40 mM group and the 0 mM group are lowest among the groups. The 2 mM group showed no abnormalities in mean SPAD value: Its mean SPAD value followed the pattern of distribution with a peak value at a certain Calcium concentration and the values of other concentrations getting progressively lower as the concentrations differ from the peak concentration.
4. Discussion
Leaf length and width are important plant physiological indexes, directly reflecting how healthy a plant is, and greatly influencing the rate of photosynthesis and the amount of products made from photosynthesis. Under drought conditions,
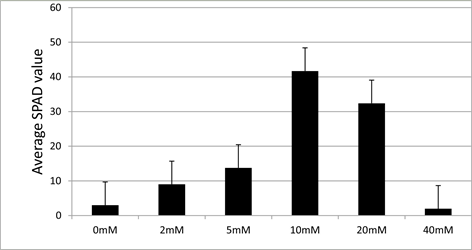
Graph 3. The mean SPAD values of every group. All values are measured 6 days after PEG is added to simulate drought stress.
plants’ growth is inhibited due to lack of water and membrane damage, and leaf length and width were lowered. In this experiment, the 10 mM group had the highest leaf length and width both before and after the simulated drought stress.
The 2 mM group also demonstrated relatively good growth, but this is due to drought-induced growth and recovery mechanisms [4] . The photosynthetic components of cells within the growth zone are up-regulated due to drought stress, resulting in chlorophyll accumulation in the elongation zone, but the net effect on photosynthesis is inhibitive in mature cells [4] . Comparing the mean leaf lengths of the 2 mM group to the 10 mM group before the simulated drought stress, the 10 mM group went through more growth and is thus more mature, which causes plants in this group to be affected less by the drought-induced growth and recovery mechanisms. This accounts for the relatively high leaf length and width of the 2 mM group after adding PEG.
The 5 mM group displayed very irregular data. Assuming the data is not erroneous, the reasons for this are unknown. Many aquaporins are directly or indirectly controlled by Ca2+ [1] . Thus, I hypothesize that certain related mechanisms might be triggered by a Calcium concentration between 2 mM and 5 mM in maize, activating at 2 mM but not at 5 mM, resulting in better growth in the 2 mM group, but this is not validated by experimentation.
In addition, even before PEG is added, it is observed that the growth of the seedlings in the 40 mM group is poor, expressing mean leaf length and width significantly lower than all the other groups, much more yellow and unhealthy leaves, and generally weak, short plants with high death rate. These are typical characteristics of poisoning from high metal ion concentration. In this case, the metal ion is clearly Ca2+. Comparing this set of data to the data of low calcium group, the harm from salt poisoning is much greater than the negative effects of Calcium deficiency under drought stress.
SPAD value reveals the photosynthetic rate of plant leaves. Photosynthesis is one of the most important biochemical processes in plants, providing them with many kinds of organic matter and energy. Under simulated drought stress, the mean SPAD value of the 10 mM group is the highest in all groups, meaning that this group’s rate of photosynthesis is higher than any of the other groups. Drought stress causes stomata to close more, giving the plant less CO2 for photosynthesis. Drought stress also causes membrane damage, which can be severe enough to lead to plant death [5] . Furthermore, drought stress increases the oxidative stress on plants [4] . All of these affect photosynthesis negatively. Thus, the mean SPAD value of a group can be used to examine its resistance to drought stress: the higher the mean SPAD value is, the more resistant the plant is to drought stress. As Graph 3 shows, the relatively less affected groups shifted from the 2 mM group and the 10 mM group before the simulated drought stress, to the 10 mM group and the 20 mM group after the simulated drought stress. This means that an increase in Calcium concentration may facilitate maize seedlings withstand drought stress. However, the effects of 20 mM Calcium seem to be less than that of 10 mM Calcium, suggesting that contrary to common knowledge, higher than normal Calcium concentrations may have little effect helping maize seedlings resist drought stress.
To sum up, the ideal Calcium concentration under normal circumstances is 10 mM in this experiment, and it is shown to best alleviate the negative effects of drought stress on maize seedlings. However, a greater strategy to deal with short-term drought stress is to administer lower Calcium concentrations near 2 mM, which leads to normal or even better than normal growth in the short term and conserves resources. Calcium levels that are higher than the normal optimum concentration can have better effects than lower concentrations in the event of long-term drought stress, but the overall effect is not as good as the normal optimum concentration. Rather than increasing the amount of Calcium given to maize seedlings through fertilizers, continuing to give them the amount of Calcium that ensures good growth under normal conditions is perhaps the best thing to do in the event of drought stress. This experiment used aquaculture to control all ions available to the plants; in realistic situations, soil itself contains Calcium, so the exact optimum values for any specific situation cannot be determined easily, and the final results may vary.
Acknowledgements
Many thanks to Dr. Wenbin Zhou and the members of his research group at the Chinese Academy of Agricultural Sciences. I did the experiments in the labs here as a member of the team and received many helpful comments, data and ideas from them.
Conflicts of Interest
The author declares no conflicts of interest regarding the publication of this paper.
Cite this paper
Fan, D.W. (2019) The Effect of Calcium to Maize Seedlings under Drought Stress. American Journal of Plant Sciences, 10, 1391-1396. https://doi.org/10.4236/ajps.2019.108099
References
- 1. Kapilan, R., Vaziri, M. and Zwiazek, J.J. (2018) Regulation of Aquaporins in Plants under Stress. Biological Research, 51, Article No. 4. https://doi.org/10.1186/s40659-018-0152-0
- 2. Leng, G. and Hall, J. (2019) Crop Yield Sensitivity of Global Major Agricultural Countries to Droughts and the Projected Changes in the Future. Science of the Total Environment, 654, 811-821. https://doi.org/10.1016/j.scitotenv.2018.10.434
- 3. Kong, X., Lv, W., Jiang, S., et al. (2013) Genome-Wide Identification and Expression Analysis of Calcium-Dependent Protein Kinase in Maize. BMC Genomics, 14, Article No. 433. https://doi.org/10.1186/1471-2164-14-433
- 4. Avramova, V., AbdElgawad, H., Zhang, Z., et al. (2015) Drought Induces Distinct Growth Response, Protection, and Recovery Mechanisms in the Maize Leaf Growth Zone. Plant Physiology, 169, 1382-1396. https://doi.org/10.1104/pp.15.00276
- 5. Guadagno, C.R., Ewers, B.E., Speckman, H.N., et al. (2017) Dead or Alive? Using Membrane Failure and Chlorophyll a Fluorescence to Predict Plant Mortality from Drought. Plant Physiology, 175, 223-234. https://doi.org/10.1104/pp.16.00581