Technology and Investment
Vol.4 No.4(2013), Article ID:38743,11 pages DOI:10.4236/ti.2013.44025
Blue Economy Innovation Impact Assessment with the GMR-Europe Model*
1Department of Economics and Regional Studies, Faculty of Business and Economics, University of Pécs, Pécs, Hungary
2MTA-PTE Innovation and Economic Growth Research Group, Faculty of Business and Economics, University of Pécs, Pécs, Hungary
Email: vargaa@ktk.pte.hu
Copyright © 2013 Attila Varga et al. This is an open access article distributed under the Creative Commons Attribution License, which permits unrestricted use, distribution, and reproduction in any medium, provided the original work is properly cited.
Received May 6, 2013; revised June 6, 2013; accepted June 15, 2013
Keywords: GMR Model; Blue Economy; Computable General Equilibrium Models; TFP; Innovation
ABSTRACT
This paper introduces and applies a model system that is suitable for the impact assessment of Blue Economy innovations. Our contribution to the literature is threefold. First, we build a multi-sector computable general equilibrium (CGE) model, which provides the theoretical frame for studying the economic impacts of using waste as a production input. Second, we create an empirical methodology through which new technologies of Blue Economy can be concretely accounted for in regional input-output tables. Since Blue Economy innovations are largely built on local inputs, their effects are primarily local. Given that interregional spillovers of local impacts might also be significant, through interregional trade or migration, we applied a modelling approach that is able to follow complex spatial processes. The broader model framework chosen is the GMR-Europe model.
1. Introduction
In his book entitled “The Blue Economy” [1], Gunther Pauli introduces several environmental innovations that serve the market at lower costs, and at the same time they do not produce waste and are also profitable for firms. Compared to traditional, “green” environmentally friendly technologies, Blue Economy innovations require lower costs and offer a positive return already in the short run. The subtitle of Pauli’s book (“10 years, 100 innovations, 100 million jobs”), though it does not lack a marketing trick that is still acceptable in case of a popular publication, makes the economist think. Might these innovations indeed have such a large impact? Besides protecting the environment, are they indeed more effective economically? How can we estimate the economic impacts of these innovations more precisely? These questions motivated the modelling approach introduced in this study.
Typical types of innovations recommended by Pauli [1] are technological novelties that turn a by-product usually treated as waste into a raw material of another economic activity. Perhaps the most popular example is the innovation that produces edible mushroom on coffee-grounds, which is otherwise considered mass-produced garbage. Such technologies mitigate environmental pollution and waste production on the one hand, and lower the demand for natural resources, on the other. Consequently, Blue Economy innovations fundamentally change the relationships among economic sectors, since a material that has been unutilized turns into a raw material of another sector after the introduction of the innovations.
Modelling Blue Economy innovations poses a threefold challenge for the economic analyst. The first challenge is the development of a model framework that is able to handle the effects owing to the transformation of waste into a useful material. The second challenge is the representation of new technologies in a way that makes the “translation” of a new technology into the structure of an empirical economic model possible. The third challenge is related to the method of estimating the geographical impacts of an innovation. Though the effect will clearly be stronger at the geographical area where the implementation of the new technology takes place one cannot neglect those spillover effects that indirectly arise in other regions through for example trade or migration. It would also be important to measure the magnitude of the effects of Blue Economy innovations on the nation’s economy as a whole.
Methodologies available in the literature have only limited relevance for resolving the modelling challenges set by Blue Economy innovations. The first group of models dealing with waste management, respectively recycling focuses only on the determination of the quantity of waste produced, but it lacks an explicit waste management sector [2]. The second group of models already explicitly includes waste management and processing. In the three sector equilibrium model of [3] one of the sectors is responsible for processing of waste, thus the cost of waste management is endogenously determined. Speck [4] introduces a six “sector” model where four sectors describe the technologies optionally available for the economy, the fifth sector can be interpreted as waste management that reduces environmental pollution, while the sixth sector catches the waste decomposer capability of nature. The sector in charge of waste management reduces the environmental burden through spending, but the model does not take into consideration the opportunity to utilize waste as a raw material. Different technologies use different mixes of interim products, labour, capital and natural resources. The optimal technology under given circumstances is determined by the society based on a social welfare function. The disadvantage of this solution is the difficulty related to the estimation of technologies that change over time.
Though the models described above already endogenously include the cost of waste management, they do not consider recycled waste as a raw material. The problem investigated by Baumgärtner [5] stands closest to the types of innovations analysed in our study. The author studies recycling of garbage paper as a raw material that can be reused in paper production. Garbage paper can be valued positively as a secondary resource, but in an excessive quantity it is a harmful waste that burdens the environment. This view is strengthened by empirical observations showing that the price of garbage paper is positive in some periods, while negative in others. To underpin this, Baumgärtner [5] analyses a two sector economy where the by-product of one sector is either utilized by the other one as a raw material or must be processed as a waste that induces costs on the company’s side. The costs of waste processing are exogenously given in the model. The author points out that the price of garbage paper is negative and equals to the cost of waste processing if the waste is not utilized in its full quantity. However, Baumgärtner’s [5] solution is a partial equilibrium one, since it does not model the wasteprocessing sector. The cost of waste processing is exogenously given.
Each of the three types of models introduced in the above categorization plays an important role in our solution. We aim at the development of a model that explicitly enables the utilization of waste as a raw material, similarly to that of Baumgärtner’s [5] solution, but it does so in a general equilibrium framework that endogenously includes the price of waste management, like in Miyata’s [3] model.
This study introduces and applies a system of models that is suitable for the impact assessment of Blue Economy innovations. Our contribution to the literature is threefold. First, we build a multi-sector computable general equilibrium (CGE) model, which provides the theoretical frame for studying the economic impacts of using waste as a production input. Second, we create an empirical methodology through which new technologies of Blue Economy can be concretely accounted for in regional input-output tables. Since Blue Economy innovations are largely built on local inputs, their effects are primarily local. Given that interregional spillovers of local impacts might also be significant, through interregional trade or migration, we applied a modelling approach that is able to follow complex spatial processes. The broader model framework chosen is the GMR-Europe model.
This paper is structured as follows. The second chapter introduces the structure of the GMR-Europe model. In the third chapter this model is extended and developed further to make it suitable for the study of Blue Economy innovation impact assessment. Following this the estimated effects of a selected Blue Economy innovation are introduced. Summary concludes the paper.
2. The GMR-Europe Model
The quantification of the impacts of Blue Economy innovations was carried out in the frame of the GMR (Geographic Macro and Regional) model. This model is able to take into consideration the national and regional impacts of different economic interventions. The model is frequently used for the impact assessments of interventions targeting R&D and human capital, and that of the EU cohesion policy both for the European Union [6-8], and for Hungary [9,10].
The GMR (“Geographic Macro and Regional”) approach is an economic development policy impact-modeling framework. GMR models provide ex-ante and expost evaluation of development policies such as promotion of R&D activities, human capital advancement or improved physical accessibility. The models simulate macroand regional economic impacts while taking into account geography effects such as regional innovation system features, agglomeration, migration and costs of transportation. The intention of the GMR research program is to develop efficient and relatively simple model structures, which fit to the generally weak quality of regional data.
The GMR model consists of three blocks: the regional productivity (Total Factor Productivity, TFP), the Spatial Computable General Equilibrium (SCGE), and the macroeconomic (MACRO) model blocks. The effect of interventions (e.g. R&D support, infrastructure, investments) on total factor productivity is determined in the TFP block, the equations of which are estimated by econometric methods. The detailed technical description of the block’s structure can be found in the papers of Varga et al. [6,11] and Varga and Törmä [8].
Changes in the values of the main economic variables (output, employment, prices etc.) induced by the effects of changing TFP are determined in the SCGE model block for each region. Thus the aim of the model block is to evaluate the economic impacts of different economic policy interventions at the regional level. In a short run equilibrium demand of and supply for products and factors are equal to each other however wages might differ among regions. Wage differences might induce migration from lower wage regions. Resulting from migration wages are equalized among regions in the long run. Thus in the long run not only each region but also the whole spatial system reaches equilibrium.
The SCGE model block takes into consideration those geographical impacts that reinforce centripetal forces, that is spatial concentration through the change of regional productivity as well as the impacts mitigating centrifugal effects such as increasing congestion and costs of transportation. Regions are connected by interregional trade and by migration of capital and labour. The SCGE block is a static one, the dynamism of the system is ensured by the TFP model and macroeconomic block.
The macroeconomic block of the GMR-Europe model includes QUEST III [12] a dynamic stochastic general equilibrium (DSGE) model developed by the European Commission. MATLAB software is used to jointly run the TFP, the SCGE and the MACRO model blocks.
The present investigation is the first use of the GMR system for a particular case when external shocks enter the model in form of a special environmental innovation. To be able to estimate regional and macro level effects of Blue Economy innovations, we restructured the CGE model of one region (the Hungarian Southern Transdanubian region) in the GMR-Europe model in order to make it suitable for the aim of our investigation. Since this transformation affects the SCGE block the next section focuses primarily on this block.
3. Modelling Blue Economy Innovations with the GMR-Europe Model
The GMR-Europe model analyses the spatial effects of various economic policy interventions within a mutually connected (by means of interregional trade, geographic and knowledge network spillovers, migration of labour and capital) regional model system of 144 European regions. The present investigation transforms a selected region of this complex system to make it suitable for the modelling of Blue Economy innovations. Regional models belonging in the SCGE block of the GMR-Europe model are one-sector models that consider one aggregate product: regional GDP. However, the evaluation of the impacts of Blue Economy innovations requires a multisector approach. Thus we extended one region (in the particular example the Southern Transdanubian region) of the SCGE model block into a multi-sector one. This multi-sectorally extended regional model is called the “BLUE” regional model hereinafter.
Besides the above-mentioned change in the GMREurope model, many special amendments were also needed in the structure of the sectorally divided regional model to make it suitable for the analysis of Blue Economy-type innovations. Special attention was devoted to the transformed role of waste, since after the introduction of a Blue Economy innovation waste works as a production input, thus creates value. Besides this it is important to emphasize that waste is a by-product, which means that the production of a good and the supply of its recyclable waste are not independent. The rest of this section discusses the alterations we made in the GMR-Europe model in detail.
3.1. Modelling Waste-Recycling in the Sectorally Detailed Region—The Structure of the BLUE Model
1) Firms The waste management sector plays an outstanding role in the multi-sector model, since the quantity of waste to be processed largely depends on the quantity of waste recycled owing to the introduction of the innovation. Thus there are m sectors differentiated in the model, n of which behave similarly, while the waste processing sector is signed with a separate index, w.
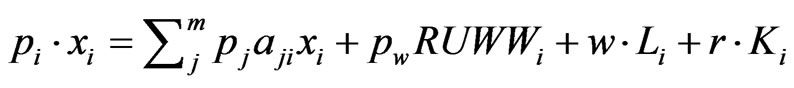
In their production companies use two primary resources (capital and labour) and respectively intermediate products produced by other sectors. Primary resources are assumed to be perfectly mobile among the sectors, thus having the same price in each sector. Value added is produced with primary resources following a Cobb-Douglas technology while the use of intermediate factors is characterized by a Leontief technology. Every company emits waste during production that is transported and processed by the specialized waste management sector. Waste generated can be separated into two parts: a recyclable one that can be sold as a raw material according to the new Blue Economy technology, and a non-recyclable part. The non-recyclable share of waste is linearly proportional to the output of the company. The company’s demand for waste processing equals to awi of each unit of production. On the other hand, the share of potentially recyclable waste that is actually treated as a waste (RUWWi) varies as it depends on the reutilized quantity of the total recyclable waste produced. Thus the production function of firms has the following form:

where xi is the gross output of firms belonging to sector i, Xji is the quantity of product produced by sector j and used in sector i, and RUWWi represents the quantity of waste transported and potentially reused. ruwwi shows the quantity of by-products dispatched as waste. However, contrary to the demand of ordinary raw materials this is not constant, but variable. Owing to the introduction of Blue Economy innovations companies can use an additional raw material besides the products of other sectors: recyclable waste. RUWDi shows the quantity of recycled waste used in sector i, while τi represents the demand for recycled waste per unit of output in sector i. Li and Ki signal the quantity of labour and capital used in the sector, αi and Ai are parameters of the Cobb-Douglas production function, while bi is the value added per unit of gross output.
The demand functions of companies for capital and labour are the followings:
 (1)
(1)
 (2)
(2)
where w is the wage rate, r is interest on capital, while the other notations follow the above described interpretation. During the production of their main products, companies also create by-products that can potentially be used as raw materials after the introduction of the innovation. We assume that the quantity of recyclable waste generated is linearly proportional to the output, thus:
 (3)
(3)
where RUWTi stands for the total quantity of recyclable waste produced, while ρi is recyclable waste per unit of output.
Blue Economy innovations make it possible for firms to utilize by-products (previously being treated as waste) as raw materials. The demand for recyclable waste is described by the following function:
 (4)
(4)
We assume that companies producing by-products approve to provide recyclable waste for free because they do not have to bear the costs of transporting and processing of waste anymore. Thus the quantity of a byproduct utilized equals to the demand of those companies utilizing it as raw material. The demand is proportionally distributed among the sectors. As a consequence, the quantity of recyclable waste that can be used as raw material is supplied by sector i according to the following:
 (5)
(5)
where RUWSi shows how much is offered for recycling from the total by-product by company i. The remaining recyclable waste must be processed by the waste management sector. Its value cannot be negative, thus the maximum amount what a company can offer as waste for recycling is what it has produced.
 (6)
(6)
The quantity of the by-product transported as waste per unit of output can be calculated by the following ratio:

Assuming perfect competition, the zero profit condition must be met in case of each company, thus
 (7)
(7)
where pi stands for the price of the product of sector i, while w and r represent the price of labour and capital.
2) Households Consumer behaviour is modelled by a representative household. Households consume the products of all sectors and their utility is described by the following utility function

where Ci is the consumption of the household from product i, and αHi is the parameter of the Cobb-Douglas utility function.
The household spends its entire income on buying consumption goods, thus

where Y represents the income of the household.
The utility maximizing demand function of the household is the following:
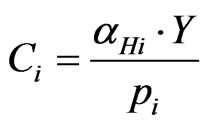 (8)
(8)
The primary resources are owned by the households thus their income equals to the products of the prices and supplied quantities of primary resources.
 (9)
(9)
where LS and KS represent the supply of labour and capital.
3.2. Market Equilibrium Conditions in the Multi-Sector (BLUE) Model
In case of equilibrium on the labour and capital markets factor demand of companies equals to the supply of households, thus
 (10)
(10)
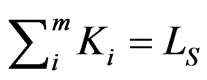 (11)
(11)
The households’ supply of labour and capital is exogenously given in a certain period, but it can change in the long run owing to interregional migration.
Equilibrium of product markets necessitates that gross production equals to the demand by companies and households. In case of the traditionally behaving n sector this can be described as follows:
 (12a)
(12a)
In case of the waste management sector (12a) is complemented by a further element that represents the quantity of recyclable waste thrown out as garbage.
 (12b)
(12b)
The model includes a total of 9m + 3 equations and 9m
+ 3 variables, but these equations are not independent, since one of the equations can be expressed by using the others, so it can be dropped. To get a regular system of equations again, we fix the price of one of the resources that of capital and this fills in the role of the numeraire.
3.3. Integrating the Multi-Sector BLUE Model into the Aggregated SCGE Environment
In accordance with the logic of the SCGE model block we search for the regionally different factor prices (ws, and rs) that ensure the equilibrium of demand and supply for factors at the regional level. The same holds for the Southern Transdanubian region, however, the demand for labour and capital is not aggregately determined since the sectorally disaggregated BLUE model comes into work in case of this single region. Thus the SCGE model block includes aggregate Southern Transdanubia, while the BLUE model block provides its sectoral details and the current values of variables are corresponded to each other one by one. The details can be studied in Figure 1.
Since the factor prices are sectorally identical the value of w is the same in the BLUE model as in the aggregate Southern Transdanubian segment of the SCGE model. The same holds for r. Both model blocks can be calculated by optionally choosing w and r, but most likely this does not lead to the equilibrium on the factor markets initially. Thus we search for factor prices at which the demand for labour equals to its supply (Ldem = Ls) and the demand for capital equals to capital supply (Kdem = Ks). Factor demands are sectorally (Ldem,sec és Kdem,sec) calculated in the BLUE model and they are influenced not only by prices, but also by the sectoral
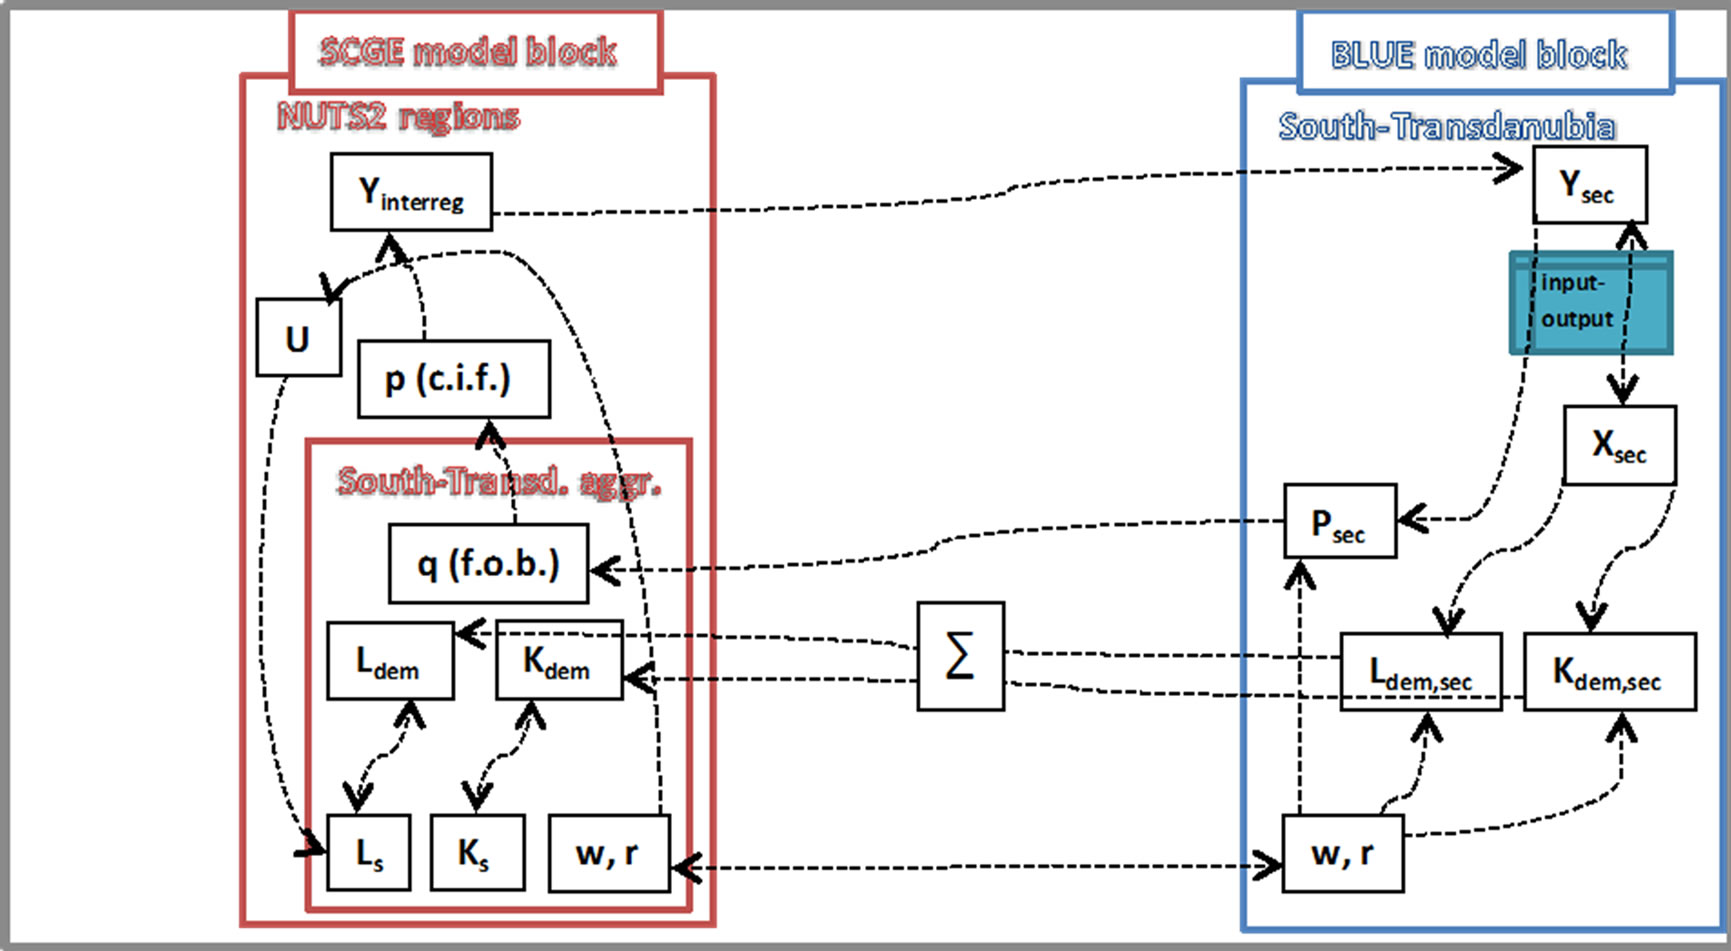
Figure 1. The BLUE model in a one-sector environment.
value added figures based on sectoral outputs (Xsec). On top of this sectoral product prices (Psec) are also influenced by the factor prices.
The sectoral structure of prices and value added evolving in the BLUE model determines the aggregate “f.o.b.” (excluding transportation costs) product price of the region through which Southern Transdanubia participates in interregional trade. By adding transportation costs we get the “c.i.f” (p) price by which Southern Transdanubia competes on the different regional markets including its domestic market as well. Through modelling interregional trade we get the aggregate demand (Cinterreg) for the products of each region, including Southern Transdanubia. However in case of this region aggregate demand is also sectorally determined within the BLUE model block (Csec). Sectoral input-output relationships establish the connection between sectoral demand for final products of Southern Transdanubia and sectoral outputs. At this point we close the circle in Figure 1 thus at any pairs of factor prices (w, r) and sectoral outputs the sum of sectoral factor demands provides the aggregate factor demands of the region. In case of the “proper” choice of factor prices, factor demands must be equal to factor supplies. These equilibrium factor prices are determined by an algorithm, which is followed in solving the system of equations assuming constant factor supply in the short run. This is why we call this solution as the short run equilibrium that applies for one period of time. The results are substituted into the utility function (U) of the SCGE model block that helps to calculate the migration of labour force so in the long run also the supply of labour (Ls) will change.
3.4. Impact Mechanisms in the GMR-Europe Model System
Figure 2 shows how the different parts of the model are connected. Our intervention goes through the different blocks of the GMR model as follows. In the first the new input-output table representing a Blue Economy innovation is inserted into the regional SCGE model. At the same time the original, unmodified TFP values from the TFP block are also inputted. Following the modified input-output tables, the quantity of capital, labour and production, wages, interests on capital and the prices of products are calculated for each region and each time period.
Differences in utility among the regions induce labour migration and capital flows, which cause a change in the TFP of the regions. In the third step the new regional TFP values are calculated and inserted in the macro block. Finally, owing to the effect of the new TFP values, current values of the macro variables are determined for every period. In the fourth step, the changes of capital and labour calculated in the macro block will be distributed among the regions based on the pattern of regional TFP changes generated by the intervention for each time period. In the fifth step, the SCGE model block runs again with the modified quantities of capital and labour and the new quantities and prices will be calculated for each region and for each time period.
Thus we compare the impacts on certain macroeconomic and regional variables (such as output, employment, investment, prices, etc.) calculated with the new I-O table representing a Blue Economy innovation (the

Figure 2. Impact mechanisms of Blue Economy innovations in the GMR-Europe model.
“scenario”) with variables calculated without this innovation (the “baseline”). Differences in the values of the variables between the baseline and the scenario are considered as the impacts of the introduction of an innovation. In the following section we apply the model system for simulating the likely effects of a blue economy innovation introduced in the Southern Transdanubian region.
4. Economic Impacts of a Blue Economy Innovation in the Southern Transdanubian Region
4.1. The Innovation: Growing Mushroom on Coffee-Grounds
The innovation we choose from the examples in Pauli [1] is both relevant for the Southern Transdanubian region and its impacts are technically treatable within the GMRmodel system. This led to the selection of the technology of growing mushroom on coffee-grounds. Mushroom growing in the Southern Transdanubian region (especially in the area of Pécs) can be considered as significant (711 tons in 2009, dominantly champignon). The merit of the selected Blue Economy innovation is that, contrary to traditional technologies of mushroom growing, it uses coffee-ground which remains after brewing coffee as a substratum. This process requires significantly less input (chemical, sterilization, energy), since the coffee-ground is already sterile after brewing, thus there is no need for further fertilizing processes. Additionally, the material (the coffee-ground) that is usually deposited as waste, can serve as a production input.
Our study analyses the likely impacts of a complete shift in the technology of mushroom growing from the current one to a form where the entire mushroom growing process is based on coffee-grounds. This study account for the impact of coffee-grounds collected from catering places only. Restaurants and coffee bars already store coffee-grounds separately (to ease the course of business) thus we can assume that they are willing to give it for free to a potential mushroom grower. Besides that collection of coffee grounds does not induce extra costs on restaurants they save additionally by paying less to the waste-processing sector. Nevertheless collection of coffeegrounds entails significant transportation costs that must be considered among the costs of mushroom growing.
4.2. The Method of Accounting for the Blue Economy Innovation in the Model
Many technical problems had to be resolved during the impact assessment of the chosen Blue Economy innovation. With respect to the inputs a solution must have been found on how to take into consideration and insert the technology of a previously non-existing, entirely new branch and how the starting values of the input data can be generated. Since producers will use a new technology with the implementation of the innovation, a methodology is needed that is able to take into consideration the change in the production technology. We used an inputoutput table estimated for the Southern Transdanubian region to analyse the technology of the Blue Economy innovation. The impact assessment was run within the framework of the GMR-Europe model. Since (as it has already been discussed in the previous chapter) this model includes only one aggregated sector, it is not able to take into consideration the interconnections of different industrial sectors. Thus for the analysis we extended the SCGE model block in a way that we became able to track inter-sectoral effects of the innovation.
The estimated regional input-output table served as the base for the simulations. A physical input-output table would be the most excellent instrument for the impact assessment. However, for Hungary the table of intersectoral connections expressed in physical units is not available, so we used the traditional monetary table of intersectoral relations. A further problem is that the Hungarian Central Statistical Office (HCSO) complies only national I-O tables, thus first we had to estimate it for the Southern Transdanubian region to be able to analyse the effects of the innovation.
There is a broad literature on the regionalization of input-output tables. The three types of methods that have been most widely applied are the survey, non-survey and hybrid methods [13]. When survey methods are followed companies in the region are asked to provide production data and then the table will be compiled based on the data received. A clear advantage of this method is that it is able to detect input-output relations with a good estimate but the disadvantage is that the determination of those is a very costly process. Non-survey methods can be used if there is no data available at all on input-output connections in the region consequently the whole table must be estimated. These methods require only a few data and are relatively easy to carry out. Additionally, they are not so much costly compared to the survey methods. However, their disadvantage is that they cannot provide really precise results. The hybrid methods are meant to unify the advantages of the previous two groups, namely appropriate precision and relatively low costs. Nevertheless this requires the availability of preliminary (survey) data on regional input-output connections. Usually the most important and largest branches of the region are mapped with a survey and after that the remaining parts of the table are estimated by a non-survey method. Since no survey data are available at all for Southern Transdanubia we used a non-survey method to carry out the estimation. The regionalization of the table followed a twostep process. First, by using the LQ-method, we adjusted the cells of the coefficient matrix to regional production specificities, and determined the scale of interregional export and import and then we ensured the fit to the regional data by using the RAS method. More technical details on these techniques can be found in [14-26].
In the following step the technological background of the region’s mushroom production was studied. By doing so, we got estimated data on the input needs of regional output. Related to the volume of regional mushroom growing we relied on the database of the HCSO. The estimation of the input requirements for this production level was based on experiences published in the literature on mushroom growing [27-31]. Finally, the quantity of inputs required was adjusted to the level of the regional output. Since mushroom growing is part of agriculture in the HSCO tables, we decided to separate the mushroom growing sector from agriculture. Consequently, at the end we got a new input-output table that included mushroom growing as a new sector additional to agriculture excluding mushroom production. Of course there is no overlap between these two sectors. During the model runs this table was inserted into the SCGE block. We consider the results attained with this table as the baseline scenario. The alternative scenario includes the effects of the Blue Economy innovation. The starting point here was the regional input-output table estimated previously. However, during the analysis we assumed that the whole mushroom growing industry of the region uses the new technology thus the whole branch shifts to the new production method. Consequently the impact assessment will show the results expected if the Blue Economy innovation is applied in the entire mushroom growing sector. We assumed that the entire amounts of coffeegrounds that can potentially be collected from catering places were used by the mushroom growing sector. The output of the sector was calculated then by assuming the application of the new technology. After estimating the output and the inputs required, data of the mushroom growing sector with the old technology was replaced by the data estimated with the new technology in the input-output table. Then the model was run again using the new table.
The differences between the technological coefficients are rooted in the differences between the two technologies. For example traditional mushroom growing has a higher agricultural coefficient, since, besides mushroom spawn it also uses compost. Additionally, the Blue Innovation does not use any output of the mining industry, while the traditional production does (sand and peat). It can also be seen that only the traditional method of growing requires the use of chemicals, however, raising on coffee-grounds has a larger energy demand (especially due to lightning). Water consumption is not significantly different and approximately equals in both cases. Resulting from the need of transporting coffee-grounds the Blue Innovation also uses the trading sector as an input. In restaurants of the Southern Transdanubian region approximately 214,000 tons of coffee-grounds are produced annually that can potentially be used for mushroom growing.
4.3. Results
Since the sector analyzed (mushroom growing) only represents a small portion of the total production of the Southern Transdanubian region, aggregate results at the regional level are expected to be minor only. Let us first analyse the change in output in the first year. These impacts are shown in Table 1.
The most striking result is the increase in the output of the mushroom producing sector by 11 percent. This rise can be owed to decreased costs of mushroom production due to the fact that one of the inputs (coffee-ground) is now freely available for producers. Resulting from the decrease in costs companies are able to supply mushroom for a lower price, which at the end increases the quantity demanded. A further expected result is the shrinking of the waste-processing sector, even if it is only small in its scale. This can be owed to the decrease in the quantity of coffee-ground waste. On the other hand, the output of the sector that includes transportation (“Wholesale and retail trade, repair of motor vehicles and motorcycles, Transportation and storage, Accommodation and food service activities”) increased. This is due to the fact that coffee-ground has to be collected from multiple sites and in relatively small portions which increased transportation need. A further interesting result is the increase of the production of electricity. Behind this we can suspect both direct and indirect effects. The direct effect is the relatively high demand of the mushroom growing sector for electricity, since appropriate humidity and temperature play an important role in mushroom growing. Thus increased mushroom production requires increased electricity production and air conditioning. Furthermore, it can be assumed that higher transportation need also increases the demand for energy.
Output of the agricultural sector slightly decreased as a consequence of the substitution of the raw material that stemmed earlier from this sector (compost) by coffeeground. It is also worth to mention that the output of chemicals also decreased that is owed to the use of the already sterile coffee-grounds. Application of this input thus does not require further treatment of the substratum in mushroom growing.
Similar observations emerge from the analysis of the employment impacts. Employment increased in some sectors (electricity, transportation, mushroom growing), while decreased in others. However, it is important to note that unemployment is not considered in the model since the

Table 1. Expected sectoral impacts of the implementation of Blue Economy-type mushroom growing.
supply of labour is considered fixed in a given period, consequently an increase in employment of one sector can only occur in the detriment of others. But in the long run migration can change labour supply of a region if wages significantly differ from the national average. We also studied the impact of a change in wages in the Southern Transdanubian region during the investigation period. Wages already start to increase slightly in the first year, and this rise is approximately being hold throughout the simulation period. Increased labour demand in the mushroom growing sector can be suspected in the background, however owing to the small size of this sector, it does not have a surpassingly large impact on aggregate regional wages. The increase in wages thus turns out to be too low to induce significant migration, thus supply of labour does not change in the region during the investigation period.
5. Summary
Our study introduced a model framework that is applicable for the impact assessment of specific kinds of environmental innovations called Blue Economy innovations.
The main novelty of these technologies is that they use certain products, which are normally considered waste, as production inputs. These innovations reduce the production of waste on the one hand and diminish the raw material needs of the economy on the other. To be able to analyse the effects of such innovations, we used a multisector general equilibrium model that is able to reveal the transformed relationships among economic sectors. Due to relatively high transportation costs these innovations rely much on spatial proximity of firms, which should also be incorporated into the structure of impact models. To account for the role of geography in our analysis we applied the GMR-Europe model. The SCGE block of the GMR-Europe model was developed in a way that it became suitable for the impact assessment of these innovations. Finally, we illustrated the capabilities of the model with a specific example. We analysed the effects arising from the use of coffee-grounds as a substratum in mushroom production (a Blue Economy innovation) and compared them to those of a widely used current technology. The empirical analysis was run for data of the Hungarian South Transdanubian Region. Due to the small share of the mushroom growing sector in the regional economy the effects found are quite small. Even against this we experienced visible impacts, primarily owing to changes in intersectoral relations.
REFERENCES
- G. Pauli, “The Blue Economy—10 Years, 100 Innovations, 100 Million Jobs,” Report to the Club of Rome, Paradigm Publications, Taos, 2010.
- E. Barata, “Solid Waste Generation and Management in Portugal: An Environmental Input-Output Modelling Approach,” Paper Prepared for the 7th Biennial Conference of the International Society for Ecological Economics, “Environment and Development: Globalisation & the Challenges for Local & International Governance”, Sousse, 6-9 March 2002.
- Y. Miyata, “A General Equilibrium Analysis of the Waste-Economic System—A CGE Modeling Approach,” Infrastructure Planning Review, Vol. 12, 1995, pp. 259- 270. http://dx.doi.org/10.2208/journalip.12.259
- S. Speck, “A Neo-Austrian Five Process Model with Resource Extraction and Pollution Abatement,” Ecological Economics, Vol. 21, No. 2, 1997, pp. 91-103. http://dx.doi.org/10.1016/S0921-8009(96)00091-2
- S. Baumgärtner, “Price Ambivalence of Secondary Resources: Joint Production, Limits to Substitution, and Costly Disposal,” Resources, Conservation and Recycling, Vol. 43, No. 1, 2004, pp. 95-117. http://dx.doi.org/10.1016/j.resconrec.2004.04.013
- A. Varga, P. Járosi and T. Sebestyén, “Geographic Macro and Regional Model for EU Policy Impact Analysis of Intangible Assets and Growth,” Working Paper IAREG WP5/20, 2009.
- A. Varga, P. Járosi and T. Sebestyén, “A GMR-Európa Modell és Alkalmazása EU Kohéziós Politikai Reformok Előzetes Hatásvizsgálata Során,” Szigma, 2013, Forthcoming.
- A. Varga and H. Törmä, “The Extended GMR Modeling System. Study on the Impact of the Single Market on Cohesion: Implications for Cohesion Policy, Growth and Competitiveness,” European Commission, DG Regio Project, Methodology Report, 2010.
- A. Varga, H. Schalk, A. Koike, P. Járosi and L. Tavasszy, “Integrating the Effects of Geography into EU Cohesion Policy Impact Modeling: The GMR-Approach,” Paper Presented at the Modeling Workshop of the German Section of the European Regional Science Association, University of Kiel, 2008.
- P. Járosi, A. Koike, M. Thissen and A. Varga, “Region- ális Fejlesztéspolitikai Hatáselemzés Térbeli Számszerű- sített Általános Egyensúlyi Modellel,” Közgazdasági Szemle, 2010, pp. 165-180.
- A. Varga, D. Pontikakis and G. Chorafakis, “Metropolitan Edison and Cosmopolitan Pasteur? Agglomeration and Interregional Research Network Effects on European R&D Productivity,” Journal of Economic Geography, 2013, Forthcoming.
- M. Ratto, W. Roeger and J. Veld, “QUEST III: An Estimated Open-Economy DSGE Model of the Euro Area with Fiscal and Monetary Policy,” Economic Modelling, Vol. 26, No. 1, 2009, pp. 222-233. http://dx.doi.org/10.1016/j.econmod.2008.06.014
- A. Bonfiglio, “A Sensitivity Analysis of the Impact of CAP Reform. Alternative Methods of Constructing Regional Input-Output Tables,” PHD Studies, No. 1, Polytechnic University of Marche, Ancona, 2005.
- T. A. Flegg and C. Webber, “Using Location Quotients to Estimate Regional Input-Output Coefficients and Multipliers,” Local Economy Quarterly, Vol. 4, 1996, pp. 58- 86.
- T. A. Flegg and T. Thomo, “Regional Input-Output Tables and the FLQ Formula: A Case Study of Finland,” ERSA Conference Paper, 2011.
- A. Isserman, “Estimating Export Activity in a Regional Economy: A Theoretical and Empirical Analysis of Alternative Methods,” International Regional Science Review, Vol. 5, No. 2, 1980, pp. 155-184. http://dx.doi.org/10.1177/016001768000500204
- R. C. Jensen, T. D. Mandeville and N. D. Karunarante, “Regional Economic Planning: Generation of Regional Input-Output Analysis,” Croom Helm, London, 1979.
- P. M. Johns and P. M. K. Leat, “The Application of Modified GRIT Input-Output Procedures to Rural Development Analysis in Grampian Region,” Journal of Agricultural Economics, Vol. 38, No. 2, 1987, pp. 245-256. http://dx.doi.org/10.1111/j.1477-9552.1987.tb01044.x
- A. Kuhar, A. G. Kuhar, E. Erjave, M. Kozar and T. Cör, “Regionalisation of the Social Accounting Matrix—Methodological Review,” Common Agricultural Policy Regional Impact—The Rural Development Dimension Collaborative Project—Small to Medium-Scale Focused Research Project under the Seventh Framework Programme Project No.: 226195, 2009.
- M. L. Lahr, “A Review of Literature Supporting the Hybrid Approach to Constructing Regional Input-Output Models,” Economic Systems Research, Vol. 5, No. 3, 1993, pp. 277-293. http://dx.doi.org/10.1080/09535319300000023
- W. Morrison and P. Smith, “Nonsurvey Input-Output Techniques at the Small Area Level,” Journal of Regional Science, Vol. 14, No. 1, 1974, pp. 1-14. http://dx.doi.org/10.1111/j.1467-9787.1974.tb00425.x
- B. Pigozzi and R. Hinojosa, “Regional Input-Output Inverse Coefficients Adjusted from National Tables,” Growth & Change, Vol. 16, No. 1, 2006, pp. 8-12. http://dx.doi.org/10.1111/j.1468-2257.1985.tb01034.x
- W. Schaffer and K. Chu, “Non-Survey Techniques for Constructing Regional Interindustry Models,” Papers in Regional Science, Vol. 23, No. 1, 1969, pp. 83-104. http://dx.doi.org/10.1007/BF01941876
- R. Stone and J. A. C. Brown, “A Long-Term Growth Model for the British Economy,” In: R. C. Geary, Ed., Europe’s Future in Figures, North-Holland, Amsterdam, 1962.
- R. Stone, “Input-Output and National Accounts,” Organisation for European Economic Co-Operation, 1961.
- C. A. Ulibarri and K. Wellman, “Natural Resource Valuation: A Primer on Concepts and Techniques,” Paper Prepared for the US Department of Energy, 1997.
- I. Szili, “A Csiperke és más Gombafajok Háztáji Termesztése,” Mezőgazdasági Kiadó Kft, Budapest, 1990.
- I. Szili, “Gombatermesztők Kézikönyve,” Mezőgazda Kiadó, Budapest, 2008.
- I. Szili, “Zsákos (Blokkos) Shiitake-Termesztés,” Manuscript, 2012.
- A. Chen, “Cultivation of Lentinula Edodes on Synthetic Logs,” Mushroom Growers’ Newsletter, Vol. 10, No. 4, 2000, pp. 3-9.
- Mushworld, “Mushroom Growers’ Handbook: Shiitake Cultivation,” Mushworld, Korea, 2005.
NOTES
*The research underlying this study was supported by the projects SROP-4.2.1.B-10/2/KONV-2010-0002, and 14121 MTA-PTE Innovation and Economic Growth Research Group. The contribution by Katalin Erdős is highly appreciated.