Wireless Sensor Network
Vol.11 No.04(2019), Article ID:93858,20 pages
10.4236/wsn.2019.114004
Efficient Approach for Monitoring and Controlling Water Parameters Utilizing Integrated Treatment Based on WSNs
Tarek Srour1, Ayman Haggag1, Mohsen A. M. El-Bendary1, Mostafa Eltokhy1, Atef E. Abouelazm2
1Department of Electronics Technology, Faculty of Industrial Education, Helwan University, Cairo, Egypt
2Faculty of Electronics Engineering, Menofia University, Cairo, Egypt

Copyright © 2019 by author(s) and Scientific Research Publishing Inc.
This work is licensed under the Creative Commons Attribution International License (CC BY 4.0).
http://creativecommons.org/licenses/by/4.0/


Received: May 27, 2019; Accepted: April 27, 2019; Published: April 30, 2019
ABSTRACT
Research works of Wireless Sensor Networks (WSNs) applications and its constraints solutions occupy wide area around the world and attract many researchers. In this paper, an important one of environmental WSN applications is presented that is the water monitoring applications. An efficient approach for monitoring and controlling water parameters in real-time is implemented utilizing merging between WSN and designed simple workstation. For implementation simplicity, two water parameters (pH and temperature) are monitored and controlled in the proposed approach. Most of past work of water monitoring presented different proposed monitoring scenarios for different water parameters only. This research work utilizes the concept of interactive WSN nodes. The interactive nodes interact with the monitored water parameters to control its value. In the base station, the collected data is analyzed and the real-time value of the monitored parameters appears on the designed Graphic User Interface (GUI). The GUI is designed using the Matlab program. Through the GUI, the operator can switch the control between automatic and manual. ZigBee module is used for implementing the wireless communications between the nodes and the workstation. Due to the cost and simplicity, two sensors only are used in the proposed approach. Different real-time experiments are performed to test and measure the effectiveness and performance of the presented approach. These experiments reveal that the presented approach is effective for water treatment and efficient more than the past proposed water monitoring scenarios.
Keywords:
Environmental Monitoring, Water Quality, Interactive WSN, WSNs Applications, Interactive Sensing, Real-Time

1. Introduction
Network technologies became an important part of our world, whether wired or wireless networks. Networks are used in our daily life, industry, education and other fields. Wireless networks provide flexible wireless connection via wireless channels utilizing RF waves in open space. It has evolved significantly in recent years. They are based on radio waves to transmit electrical signals following different wireless standards such as Bluetooth, ZigBee and Wi-Fi [1]. There are many problems solutions have been achieved based on the wireless networks and overcoming wired networks problems facing. Wireless networks have many advantages such as it do not need infrastructure, low cost, high power efficiency, sending data to a remote location, and it provides fairly reliable communication without expensive connectors. Wireless networks are used in many fields as they can help to overcome the constraints of wired networks and have additional benefit of mobility and design flexibility [2]. There are many types of wireless networks include, WBAN, WPAN, WLAN, WMAN, and WWAN. These networks are classified according to its range where they can send and receive data via different distance through various wireless communication standards such as Bluetooth, Wi-Fi, ZigBee, WiMax, etc. [3]. In recent years, wireless network technology had great development and was used with embedded systems to implement a set of specific tasks. The result of this development was the emergency of Wireless Sensor Networks (WSNs). WSNs are capable of implementing many of the essential needs for humans, as they have the potential of being used in different applications [4].
WSNs are an attractive technology for smart buildings, industrial automation, and operation control applications. WSNs are also used in a wide range of applications such as military, industrial, environmental and healthcare applications. WSNs can be designed to meet the specific needs of a particular application. There are many researchers who presented WSN utilization in different fields, such as [5] [6] [7] [8]. WSNs were used in military applications in [9] [10] [11] [12]. Different scenarios of WSN application in industry control were discussed in [13] [14] [15] [16]. The environmental monitoring application is the most attractive field of WSN utilization where different physical parameters can be monitored by WSNs. In nature and wild environments, we always find a big role for WSNs. WSNs are used to determine the changes in natural phenomena and detect events. Environmental applications such as volcano monitoring, fire detection, flood detection and water quality monitoring were discussed in [17] - [27].
This paper focuses on water quality monitoring using wireless sensors to monitor different water parameters. In previous research, the utilization of WSNs for water monitoring scenarios was only limited to monitoring only. In this research, closed loop WSN is proposed to monitor and control water quality. The proposed interactive system can work automatically according to pre-programmed rules or through human decisions to control water parameters values manually.
It is known that water has three characteristics: Chemical, physical and biological. Each of these characteristics contains many parameters that must be within certain values according to the use of water as discussed in [28] - [33]. We propose this system to overcome the traditional method which was based on taking the sample of water and analysis it in the lab. Because this method leads to a time lag that makes the sample results do not reflect the real water. The proposal system can monitor and control water parameters in real time through a set of sensors put in water forming a treatment unit based on WSNs.
The rest of this paper is organized as follows: Section 2 the discusses related work and background regarding WSNs and the previous work in water monitoring using WSNs. Section 3 presents the methodology of the proposed system. Section 4 discusses the proposal system results. Section 5 contains the conclusion.
2. Related Work
This section is divided to two parts: the first part presents the background of WSN while the second part presents a group of previous work about water monitoring where a number of researchers have been interested in this field because of its great importance in many different applications
2.1. Background of WSNs
Wireless sensor networks (WSNs) are object-oriented networks because these networks are designed for a specific purpose. WSNs consist of a group of devices called nodes and these nodes connect together wirelessly. Nodes work on collecting information about natural phenomena and objects then send the information to sink or base station to analyze, observe the information, and take the correct decision. The sink is a controller that works on monitor nodes status. Collect data from all nodes are then sent to the base station, and in some application, the sink is able to take a decision according to a stored algorithm. The area monitored by WSN is called the service area. The service area is divided into a group of areas called coverage area. The coverage area is the maximum area a node is capable of covering and capturing the event from [34]. Figure 1 gives us the structure of WSNs.
2.1.1. Node Components
The node consists of four main units: the sensing unit, the processing unit, the
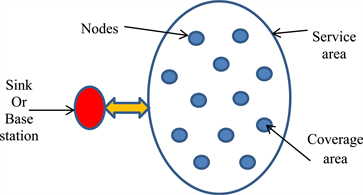
Figure 1. Structure of WSNs.
communication unit and a power unit [8]. Figure 2 shows the components of the node.
· The sensing unit:
The sensing unit is the sensing part in the node which contains the sensor. The sensor detects and converts the physical parameter to an electrical signal that reflects the physical parameter value which reflects the data being monitored.
· The processing unit:
The processing unit in the controller works on processing the data which cames from the sensing unit then passes it to the communication unit or stores it in the memory according to the stored algorithm.
· The communication unit:
The communication unit is a transmitter and receiver module such as ZigBee module that sends and receives the data from and to the base station.
· The power unit:
The power unit provides energy to all units.
The previously discussed components of the node are the most popular components used in WSNs, so this node may be called the traditional node. The traditional node is based on sensing and monitoring natural phenomena and sending data to the monitoring center only. This node cannot interact or change natural phenomena parameters like temperature, pressure, humidity, etc. In our proposed system, the node is different from the traditional node. The node in the proposed system can interact and change the value of water parameters through signals sent from the monitoring center or algorithm stored in the processing unit. This algorithm can take actions and control operations in the system when the values of parameters reach the threshold. So in the proposed system, the node is called an interactive node. Figure 3 shows the components of an interactive node and Figure 4 shows an illustration of the proposed system.

Figure 2. Components of a node.

Figure 3. The components of the interactive node.

Figure 4. Illustration of the proposed system.
2.1.2. WSN Topology
WSNs are used in a large geographic area so it uses two types of network topologies: single-hop and multi-hop. Each type issues according to the area monitored by the network where each node has a specific range to send signals. The node should consume low power in the transmitter to keep energy. If the range is suitable for each node to send and receive the data from and to the base station the single-hop network topology is used, otherwise, multi-hop network topology is used [34]. Figure 5 shows the topology of WSNs.
· Single hop:
In this type, all nodes send and receive data to and from the base station directly. This type does not allow data exchange between nodes. This type is used in a small geographic area. This type is easy in configuration and each node connects directly to the base station.
· Multi-hop:
This type allows data exchange between nodes as this type used in large areas where nodes are not able to connect directly to the base station or sink. So in this type, we have nodes called aggregation nodes or heads that have different roles. The head is the boss of a group of nodes that works on collecting data from these nodes and sending it to the base station or sink. Every head is responsible for a specific monitor area.

Figure 5. Different WSN topologies.
2.1.3. WSN Applications
WSNs are widely deployed in different applications because of its many advantages. WSNs do not require an infrastructure and are used in different environments that are difficult to reach using traditional methods. Figure 6 shows the different applications of WSNs [7].
Environmental applications are among the most important WSNs applications that depend on environmental phenomena monitoring. Environmental monitoring means taking a sample of the natural parameters involved in the environment to observe and analyze the environment [35]. Systems used in environmental monitoring are able to be employed in many applications like agriculture, air pollution, water quality, forests, etc. [36]. WSNs in these applications are able to predict dangerous events to enable the responsible authorities to take the necessary precautions against these events. Figure 7 gives us different environmental applications [8].
This paper focuses on water monitoring and proposes a system for monitoring and control of water parameters for water used in different application such as drinking, agriculture, industrial, etc.
2.2. Previous Related Works
A number of researchers were interested in the field of monitoring water parameters because of its importance in many different applications such as [37] - [47]. Table 1 shows a number of water parameters monitored by previous various scenarios.
In the following, we present an example of scenarios presented by researchers in various researches.
In [45] , the authors presented a design for a water monitoring system in real time. The system consists of one node that contains more than one sensor, a microcontroller PIC32MX220F032B and a ZigBee module that sends the data to the monitoring center. The system monitors flow, temperature, pH, conductivity and potential oxidation-reduction in the water. Each parameter is monitored
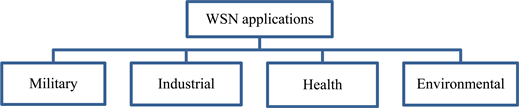
Figure 6. WSNs applications.

Figure 7. Environmental applications.

Table 1. Showing a number of water parameters monitored by previous various scenarios.
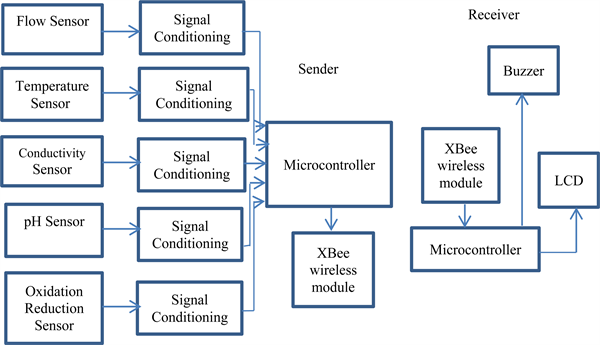
Figure 8. Block diagram of sender and receiver parts employed in the monitoring system.

Figure 9. Block diagram of the proposed system.
using a special sensor. The sensors collect the data and pass it through signal conditionings then pass it to the microcontroller where the data is processed and sent to the monitoring center through the ZigBee module. The center monitoring receives the data through the ZigBee module and passes it to another microcontroller then displayed on an LCD. In the case that one of the parameters moves to the unsafe area; a warning will occur through the alarms. Figure 8 shows the block diagram of the sender and receiver parts employed in the monitoring system.
In [46] , the authors presented a system for water parameters monitoring based on the Internet of Things. The system is monitoring four water parameters: pH, water level, turbidity, and conductivity. The sensors measure the values of these parameters and pass it to the controller. The values are displayed on an LCD and sent through a Wi-Fi module to the cloud. The values when reaching the threshold, an alert message is sent to the responsible person on the smartphone to take a suitable decision. Figure 9 shows the block diagram of the proposed system.
3. Description of the Proposed Approach
This section explains the methodology and operation of the proposed approach. The proposed system is divided into two parts: hardware and software. The proposed system is an integrated processing system that is able to monitor and control water parameters by employing WSN.
3.1. Hardware Design
The hardware of the proposed system includes two main parts: the interactive node and the base station. Firstly, the interactive node consists of three main units: the first unit is the sensing unit which contains a pH sensor (SKU: SEN0161) and a temperature sensor (water proof) where their specifications are discussed in [48] [49]. The second unit is an Arduino Uno controller and its specifications are discussed in [50]. The third unit is a communication unit where this unit is divided into two modules: the first in the node while the second in the base station. The communication unit in this system is a ZigBee module and its specifications are discussed in [51]. Secondly, the base station consists of a ZigBee module and a PC that uses a GUI window built using MATLAB program 2017. Figure 10 shows the block diagram of the proposed system.
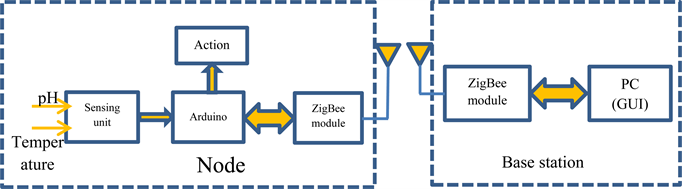
Figure 10. Block diagram of proposed system.
3.2. Software Content Description
The software in the proposed system is divided into two parts which include, the algorithm which stored on the Arduino and the Graphic User Interface (GUI) on the MATLAB program. Figure 11 gives us the flow chart for the Arduino algorithm. GUI is the window that displays the data which is sent from the node. The operator monitors the data which appear on the GUI. Through the GUI, the operator can control the values of parameters by a group of control switches in the GUI. Figure 12 shows the design of the GUI. Also, Figure 13 gives us a block diagram that describes the GUI operation.

Figure 11. The flow chart for the Arduino algorithm.

Figure 12. Graphic User Interface (GUI).

Figure 13. Block diagram to describe GUI operation.
3.3. Advantages of the Proposed Approach
Through looking at all previous research works, it has been found that they only monitor the parameters and lack the possibility of controlling those parameters in real-time. All previous researches were interested in monitoring the status of water parameters and sending the reports to the responsible person to take a suitable decision. In some researches, an alert occurs when the water parameters reach beyond the threshold.
In the presented research paper, the proposed system is able to monitor and control water parameters in real-time. The proposed system has the ability of controlling the water parameters through the operator who monitors the water parameters. The operator is able to operate the control systems in the water parameters through a GUI which displays the values of these parameters. Also, the proposed system is able to operate the control systems in the water parameters automatically when the values of the parameters reach beyond the threshold according to the algorithm stored in the microcontroller. The proposed system is considered a treatment unit for water parameters. The proposed system is suitable for different applications of water usage such as drinking, agriculture, and industry because the proposed system has the flexibility to be used in different applications. We only need to change the threshold for the parameter values according to the application of water usage. Table 2 gives us the threshold for some parameters which may be monitored and controlled for water used in drinking and agriculture [28] [52].
There are several experiments are performed on the proposed approach for water parameters control as shown in section 4. These experiments reveal that the superiority of the proposed approach than the traditional water monitoring methods and the presented approaches in the past related works [39] - [44].
Two sensors only for pH and temperature are used in this approach for reducing the cost and simple implementing. The number of sensors is not defects in the proposed approach. These sensors are just examples, the proposed approach can work with more sensors. Also, the GUI can monitor and observe many parameters not two only; it needs only simple reprogramming and redesign the GUI.
3.4. Operation Method
This section shows the operation method for the proposed system which is divided into two parts: monitoring part and control part.
3.4.1. Monitoring Part
The system is monitoring the water through sensing the parameters using sensors in the sensing unit. The sensing unit collects the data through the pH sensor and temperature sensor. After that, the sensing unit works on conditioning the data signal then passes it to the processing unit. The processing unit, the Arduino Uno, works on processing the data according to the algorithm stored on it then passes the data to the communication unit. The communication unit is a ZigBee module that works in this part as a sender forward the captured data to
Table 2. Parameters threshold values for drinking water and irrigation water.
the base station.
The base station receives the data through the ZigBee module that works in this part as a receiver. The ZigBee module receives the data and passes it to a PC device through the interface between them. The PC device displays the data on a GUI MATLAB 2017 where the data is observed and analyzed by the operator. Figure 14 shows the block diagram of the monitoring part.
3.4.2. Control Part
The system in this part works on the control the water parameters through instructions sent by the operator from the base station. The operator after observing and analyzing the data takes the decision. If the data which reflects the values of parameters are within the limits allowed in the safe area, the operator does not take any decision and continues in observation and analysis only. However, if the values of parameters reach the threshold in the hazardous area, the operator takes satiable decisions according to the data displayed on the GUI. The operator sends the instructions through a group of control switches in the GUI, where these instructions operate the systems that control the pH and temperature of the water.
The instructions are sent from the base station via the ZigBee module to the node. The node receives the instructions by the ZigBee module and passes it to the Arduino. The Arduino takes action according to the instructions that either operate the control systems or turn them off. In the same time, the Arduino is able to take the decision automatically according to the algorithm which stored in it. Figure 15 shows the block diagram of the control part.

Figure 14. The monitoring part block diagram.

Figure 15. The control part block diagram.
4. Experimental Results
In this section, there are several experiments have been performed to evaluate and test the performance of the proposed approach in the monitoring and control processes. In the following, the results of different practical experiments have been showed and described.
The experiments of the proposed system evaluation can be divided into two four steps:
· Firstly, Monitoring process is tested for two water parameters (pH and Temperature) and its threshold values as shown in Figure 16 and Figure 17.
· Secondly, the control process in the pH parameter value is tested as shown in Figure 18.
 (a)
(a) (b)
(b)
Figure 16. The monitoring of the pH & temperature parameters.

Figure 17. The monitoring of the pH & temp parameters.
 (a)
(a) (b)
(b)
Figure 18. the control of pH parameter.
· Thirdly, the process of water temperature control is tested as shown in Figure 19.
· Finally, control in both two parameters pH and temperature values in the same time is tested as shown in Figure 20.
Figure 16(a), Figure 16(b) display the results of the monitoring of pH and temperature parameters at the same time. Figure 16(a) displays the reading values of pH and temperature parameters of water sample inside a tank where pH = 7.11 and temp = 25.54. Figure 16(b) displays the reading values of pH and temperature parameters of water sample inside another tank where pH = 7.13 and temp = 25.73.
Figure 17 displays the result of monitoring the pH and temperature parameters at the same time. Figure 17 shows the reading values for pH and temperature where pH = 9.30 and temp = 30.54. These values are above the threshold
 (a)
(a) (b)
(b)
Figure 19. Control of the temperature parameter.

Figure 20. The control of the pH and temperature parameters.
for pH and temperature as determined by the algorithm. So in the GUI, there are messages that show that these values are abnormal (abnormal pH, abnormal Temp). When the operator sees these messages, he operates the control system, if the operator is late in taking the decision, the control system will operate automatically.
Figure 18(a), Figure 18(b) display the monitoring of the pH and temperature, and the control of the pH parameter through operating the control system by using the control switch. At the beginning, in Figure 18(a), the pH value = 7.33, but after operating the control system to add a material which increases the pH value in water through pressing the pH control ON in the GUI. The curve of pH temporarily increases to pH value = 11.65. Figure 18(b) shows after a period of time after adding the material which reduces the pH value in water, and the curve of the pH is reduced to pH value = 6.05.
These results show that the system is able to both monitor and control the pH parameter at the same time and in real-time.
Figure 19(a), Figure 19(b) display the monitoring values for pH and temperature, and the control of the temperature parameter through operating the control system by the control switch. At the beginning, in Figure 19(a), the temp value = 25.23, but after operating the control system to add a material which reduces the temperature in water through pressing on temperature control ON in the GUI, the curve of the temperature is reduced and the temp value = 20.05. Figure 19(b) shows after a period of time after adding the material which increases the temperature in water, and the curve of temperature is increased and the temp value = 24.51.
These results show the system is able to both monitor and control the temperature parameter at the same time and in real-time.
Figure 20 displays the monitoring and control of pH and temperature in real-time. During the monitoring of pH and temperature, curves show the reading values, pH = 7.55 and temp = 28.30. But after operating the control systems to reduce the pH and temperature values, the reading values become pH = 4.33 and temp = 25.44. These results show that the proposed system is able to both monitor and control water quality parameters in the real-time.
5. Conclusion
In this research, an efficient interactive environmental monitoring and control application Scenario is proposed utilizing WSN and MATLAB program for GUI design. It employed ZigBee module for the wireless communication. Most of WSN applications scenarios only provide real-time monitoring for different physical variables. Two sensors are utilized in this implementation for simplicity and cost reducing. Two parameters only are monitored, for example, to evaluate the proposed approach performance. The proposed approach provides parameters monitoring as well as control for the value of these monitored parameters through the presented interactive WSN concepts. MATLAB is used to design simple and practical GUI screen to track the value of different water parameters on-line. The proposed approach is provided by a simple algorithm to take suitable decisions at pre-determined parameter thresholds. Also, the user can further improve the condition of monitored water qualities through changing the value of parameters manually. The presented scenario can work with many water parameters sensors with redesigned GUI and simple reprogramming. The experiments reveal the superiority of the proposed approach over other techniques, it performed better than the traditional water monitoring methods and the past related works approaches. Finally, the proposed approach provides a simple scenario for future WSN applications scenarios, especially for environmental monitoring applications.
Conflicts of Interest
The authors declare no conflicts of interest regarding the publication of this paper.
Cite this paper
Srour, T., Haggag, A., El-Bendary, M.A.M., Eltokhy, M. and Abouelazm, A.E. (2019) Efficient Approach for Monitoring and Controlling Water Parameters Utilizing Integrated Treatment Based on WSNs. Wireless Sensor Network, 11, 47-66. https://doi.org/10.4236/wsn.2019.114004
References
- 1. Mukherjee, M. (2016) Wireless Communication-Moving from RF to Optical. International Conference on Computing for Sustainable Global Development, New Delhi, 16-18 March 2016, 1079-1086.
- 2. Ikram, W. and Thornhill, N. (2010) Wireless Communication in Process Automation: A Survey of Opportunities, Requirements, Concerns and Challenges. UKACC International Conference on Control, Coventry, 7-10 September 2010, 471-476. https://doi.org/10.1049/ic.2010.0328
- 3. Yang, S. (2014) Wireless Sensor Networks Principles, Design and Applications. Springer Verlag, London.
- 4. Keramatpour, A., Nikanjam, A. and Ghaffarian, H. (2017) Deployment of Wireless Intrusion Detection Systems to Provide the Most Possible Coverage in Wireless Sensor Networks without Infrastructures. Wireless Personal Communication, 96, 3965-3978. https://doi.org/10.1007/s11277-017-4363-4
- 5. Mohamed, R., Saleh, A., Abdelrazzak, M. and Samra, A. (2018) Survey on Wireless Sensor Network Applications and Energy Efficient Routing Protocols. Wireless Personal Communication, 101, 1019-1055. https://doi.org/10.1007/s11277-018-5747-9
- 6. Alemdar, A. and Ibnkahla, M. (2007) Wireless Sensor Networks Application and Challenges. International Symposium on Signal Processing and Its Applications, Sharjah, 12-15 February 2007, 1-6. https://doi.org/10.1109/ISSPA.2007.4555630
- 7. Akyildiz, I. and Vuran, M. (2010) Wireless Sensor Networks. John Wiley & Sons Ltd., Hoboken. https://doi.org/10.1002/9780470515181
- 8. Fahmy, H. (2016) Wireless Sensor Networks Concepts, Applications, Experimentation and Analysis. Springer, Berlin. https://doi.org/10.1007/978-981-10-0412-4_3
- 9. Ahmad, I., Shah, K. and Ullah, S. (2016) Military Applications Using Wireless Sensor Networks: A Survey. International Journal of Engineering Science and Computing, 6, 7039-7043.
- 10. Boselinprabhu, S., Pradeep, M. and Gajendran, E. (2016) Military Applications of Wireless Sensor Network System. A Multidisciplinary Journal of Scientific Research & Education, 2, 164-168.
- 11. Khakestani, F. and Balochian, S. (2015) A Survey of Military Application of Wireless Sensor Networks for Soldiers. International Journal of Engineering and Computer Science, 4, 13205-13210.
- 12. Al-Mousawi, A. and Al-Hassani, H. (2017) A Survey in Wireless Sensor Network for Explosives Detection. Computers and Electrical Engineering, 72, 682-701. https://doi.org/10.1016/j.compeleceng.2017.11.013
- 13. Saravanan, V., Arivoli, S. and Valarmathi, K. (2014) Zigbee Based Monitoring and Control of MeIter Process in Sugar Industry. International Conference on Electronics and Communication Systems, Coimbatore, 2014, 1-4. https://doi.org/10.1109/ECS.2014.6892551
- 14. Khan, W., Aalsalern, M., Gharibi, W. and Arshad, Q. (2016) Oil and Gas Monitoring Using Wireless Sensor Networks: Requirements, Issues and Challenges. International Conference on Radar, Antenna, Microwave, Electronics, and Telecommunications, Jakarta, 3-5 October 2016, 31-35. https://doi.org/10.1109/ICRAMET.2016.7849577
- 15. Gharibi, W., Aalsalem, M., Khan, W., Armi, N. and Ghribi, W. (2017) Monitoring Gas and Oil Fields with Reliable Wireless Sensing and Internet of Things. International Conference on Radar, Antenna, Microwave, Electronics, and Telecommunications, Jakarta, 23-24 October 2017, 188-191. https://doi.org/10.1109/ICRAMET.2017.8253173
- 16. Sridhar, S., Rao, K., Nihaal, S. and Aashik, K. (2016) Real Time Wireless Condition Monitoring of Induction Motor. Industrial Electronics and Applications Conference, Kota Kinabalu, 20-22 November 2016, 173-178. https://doi.org/10.1109/IEACON.2016.8067375
- 17. Bhuvaneshwari and Kumar, K.S. (2017) Volcano Monitoring System Using Wireless Networks. International Journal of Mathematical Sciences and Engineering, 5, 46-54.
- 18. Rupavathi, N. (2017) Employing Wireless Sensor Networks for Early Prediction of Volcanic Earthquake and Eruptions. International Research Journal of Innovations in Engineering and Technology, 1, 14-18.
- 19. Phillips, D., Moazzami, M., Xing, G. and Lees, J. (2017) A Sensor Network for Real-Time Volcano Tomography: System Design and Deployment. International Conference on Computer Communication and Networks, Vancouver, 31 July-3 August 2017, 1-9. https://doi.org/10.1109/ICCCN.2017.8038445
- 20. Rutakemwa, M., Jose, I. and Georges, T. (2017) Monitoring Nyiragongo Volcano Using a Federated Cloud-Based Wireless Sensor Network. International Conference on Information Science and Control Engineering, Changsha, 21-23 July 2017, 1545-1550. https://doi.org/10.1109/ICISCE.2017.322
- 21. Wang, M., Liu, H., Chen, F. and Liu, J. (2015) Forest Fire Warning System Based on GIS and WSNs. International Conference on Advanced Information Technology and Sensor Application, Harbin, 21-23 August 2015, 3-6. https://doi.org/10.1109/AITS.2015.8
- 22. Khamukhin, A. and Bertoldo, S. (2016) Spectral Analysis of Forest Fire Noise for Early Detection Using Wireless Sensor Networks. International Siberian Conference on Control and Communications, Moscow, 12-14 May 2016, 1-4. https://doi.org/10.1109/SIBCON.2016.7491654
- 23. Cantuna, J., Bastidas, D., Sol’orzano, S. and Clairand, J. (2017) Design and Implementation of a Wireless Sensor Network to Detect Forest Fires. International Conference on Democracy & Government, Quito, 19-21 April 2017, 15-21.
- 24. Alkhatib, A. (2013) Wireless Sensor Network for Forest Fire Detection and Decision Making. International Journal of Advances in Engineering Science and Technology, 2, 299-309.
- 25. Khan, F., Memon, S., Jokhio, I. and Jokhio, S. (2015) Wireless Sensor Network Based Flood/Drought Forecasting System. IEEE SENSORS, Busan, 1-4 November 2015, 1-4. https://doi.org/10.1109/ICSENS.2015.7370354
- 26. Pratama, A., Munadi, R. and Mayasari, R. (2017) Design and Implementation of Flood Detector Using Wireless Sensor Network with Mamdani’s Fuzzy Logic Method. International Conferences on Information Technology, Information Systems and Electrical Engineering, Yogyakarta, 1-2 November 2017, 192-197. https://doi.org/10.1109/ICITISEE.2017.8285493
- 27. Menon, K. and Kala, L. (2017) Video Surveillance System for Real Time Flood Detection and Mobile App for Flood Alert. International Conference on Computing Methodologies and Communication, Erode, 18-19 July 2017, 515-519. https://doi.org/10.1109/ICCMC.2017.8282518
- 28. Roberts Alley, E. (2007) Water Quality Control. 2nd Edition, McGraw-Hill Companies, United States of America.
- 29. Environmental Protection Agency. Parameters of Water Quality Interpretation and Standards.
- 30. Tebbutt, T. (2002) Principles of Water Quality Control. Fifth Edition, Butterworth-Heinemann, an Imprint of Elsevier Science, Oxford.
- 31. Company, H. (2010) What Is pH and How Is It Measured? A Technical Handbook for Industry.
- 32. Ashton, J. and Geary, L. (2006) The Effects of Temperature on pH Measurement.
- 33. Manasrah, R., Raheed, M. and Badran, M. (2006) Relationships between Water Temperature, Nutrients and Dissolved Oxygen in the Northern Gulf of Aqaba, Red Sea. Institute of Oceanology PAS, Jordan.
- 34. El-Bendary, M. (2015) Developing Security Tools of WSN and WBAN Networks Applications. Springer, Berlin. https://doi.org/10.1007/978-4-431-55069-3
- 35. Weston, S. (2011) An Overview of Environmental Monitoring and ITS Significance in Resource and Environmental Management.
- 36. Vidakis, N., Lasithiotakis, M.A. and Karapidakis, E. (2017) Environmental Monitoring through Embedded System and Sensors. International Universities Power Engineering Conference, Heraklion, 28-31 August 2017, 1-7. https://doi.org/10.1109/UPEC.2017.8231913
- 37. Somasundaram, P. and Ediosn, D. (2013) Monitoring Water Quality Using RF Module. International Journal of Application or Innovation in Engineering & Management, 2, 220-224.
- 38. Devi, B. and Abirami, N. (2014) Real Time System for Determination of Drinking Water Quality. International Journal of Computer Science and Mobile Computing, 3, 732-740.
- 39. Barabde, M. and Danve, S. (2015) Real Time Water Quality Monitoring System. International Journal of Innovative Research in Computer and Communication Engineering, 3, 5064-5069.
- 40. Deepiga, T. and Sivasankari, A. (2015) Smart Water Monitoring System Using Wireless Sensor Network at Home/Office. International Research Journal of Engineering and Technology, 2, 1305-1314.
- 41. Eduardo, C., Hugo, V. and Horacio, J. (2016) Wireless Sensor Network for Water Quality Monitoring: Prototype Design. World Academy of Science, Engineering and Technology International Journal of Environmental, Chemical, Ecological, Geological and Geophysical Engineering, 10, 162-167.
- 42. Pujar, P., Kenchannavar, H. and Kulkarn, U. (2016) Wireless Sensor Network Based Water Monitoring Systems: A Survey. International Conference on Applied and Theoretical Computing and Communication Technology, Bangalore, 21-23 July 2016, 155-159. https://doi.org/10.1109/ICATCCT.2016.7911983
- 43. Xu, Y. and Liu, F. (2017) Application of Wireless Sensor Network in Water Quality Monitoring. International Conference on Computational Science and Engineering (CSE) and IEEE International Conference on Embedded and Ubiquitous Computing (EUC), Guangzhou, 21-24 July 2017, 368-371. https://doi.org/10.1109/CSE-EUC.2017.254
- 44. Menon, G., Ramesh, M. and Divya, P. (2017) A Low Cost Wireless Sensor Network for Water Quality Monitoring in Natural Water Bodies. Global Humanitarian Technology Conference, San Jose, 19-22 October 2017, 1-8. https://doi.org/10.1109/GHTC.2017.8239341
- 45. Cloete, N., Malekian, R. and Nair, L. (2017) Design of Smart Sensors for Real-Time Water Quality Monitoring. IEEE Access, 4, 3975-3990. https://doi.org/10.1109/ACCESS.2016.2592958
- 46. Geetha, S. and Gouthami, S. (2017) Internet of Things Enabled Real Time Water Quality Monitoring System. Smart Water, 2, 1. https://doi.org/10.1186/s40713-017-0005-y
- 47. Pule, M., Yahya, A. and Chuma, J. (2018) Wireless Sensor Networks: A Survey on Monitoring Water Quality. Journal of Applied Research and Technology, 15, 562-570.
- 48. Dfrobot.com (2017) PH Meter (SKU: SEN0161). https://www.dfrobot.com/wiki/index.php/PH_meter(SKU:_SEN0161)
- 49. https://store.fut-electronics.com/ (2017) Temperature Sensor Waterproof. https://store.fut-electronics.com/collections/frontpage/products/waterproof-temperature-sensor-digital-1
- 50. Nussey, J. (2013) Arduino for Dummies. John Wiley & Sons, Hoboken.
- 51. Digi International Inc. (2009) XBee/XBee-PRO RF Modules.
- 52. Will, E. and Faust, J. (2015) Irrigation Water Quality for Greenhouse Production. Agricultural Extension Service, the University of Tennessee, Knoxville.