Journal of Information Security
Vol.5 No.2(2014), Article ID:43038,18 pages DOI:10.4236/jis.2014.52003
False Positive Responses Optimization for Intrusion Detection System
Jalal Baayer, Boubker Regragui, Aziz Baayer
SIME Laboratory, ENSIAS, Mohammed V Suissi University, Rabat, Morocco
Email: baayerjalal@yahoo.fr, boubker.regragui@gmail.com, azizbaayer@yahoo.com
Copyright © 2014 by authors and Scientific Research Publishing Inc.
This work is licensed under the Creative Commons Attribution International License (CC BY).
http://creativecommons.org/licenses/by/4.0/


Received 11 November 2013; revised 11 December 2013; accepted 18 December 2013
ABSTRACT
In Intrusion Detection Systems (IDS), the operation costs represent one of the big challenges for researchers. They are apart from the IDS cost acquisition and they comprise the costs of maintenance, administration, response, running and errors reactions costs. In the present paper, we focus on the missed reactions which include False Positive (FP) and False Negative (FN) reactions. For that a new optimization cost model is proposed for IDS. This optimization proposes a minimal interval where the IDSs work optimally. In simulation, we found this interval as a trade-off between the damage costs and the FP.
Keywords:Cost Model; Intrusion Detection System; False Positive; False Negative; Damage Costs and Optimization

1. Introduction
An Intrusion Detection System (IDS) [1] assures the process of detection and responding to malicious activity [2] that threats the computing and networking resources. It is generally based on four main components: the knowledge base [3] , the source of information (detector) [4] , the analysis module [5] and the response module, that makes responses based on appropriate analyzes.
This reply can be passive with standard alarm reports [6] or active based on additional module called IRS (Intrusion Response System) [7] . An IRS can be defined as a system, constantly supervise computer networks health based on IDS alerts, by launching efficiently suitable countermeasures against malevolent or illegal activities. These actions help to have deterioration prevention and keep the monitored system in its normal situation [8] .
An IRS can be static (predefined countermeasures attacks [9] ), dynamic (response based on the severity/confidence degree of the attack [10] ) and cost-sensitive (balance between the intrusion damage and the cost of response [11] ). The static IRS is easy to build and to maintain but it is predictable and vulnerable to intrusions, in particular, the denial of service (DoS) [12] . The Dynamic IRS is more sophisticated than static but do not introduce the cost as main element.
In other hand, the cost-sensitive IRS presents a good alternative to ensure responses that attempt to balance the intrusion damage and the cost of response [13] .
In our paper we focus on cost-sensitive IRS where the response cost is a financial value of a correct response launched against real attacks and the damage is the value of losses if the same response had not been launched against the same real attack [14] . Generally, actions are launched if the response cost is inferior to the damage value [15] . So, the success of a given response is strongly dependent on the good balance between the attack affectation damage and the system resources restoring costs.
When an IRS launches a wrong response against a real attack or in front of a normal activity, it generates a FP response. We talk about FN as the act not to detect any intrusion or launch any response when abnormal activity is observed. The FP and FN responses can harshly degrade the overall performances of IDS [16] and they are still subject of various research works.
Those likely false reactions in IDS cannot be totally weeded out in IDS. In that case, many models had been proposed to reduce their impacts [17] . These minimizations were done without having sufficient light on the trade-off between the FP and FN with cost aspect. This trade off is defined as a main performance indicator in IDS [18] based on the ROC curve [19] with cost notions. This ROC curve is suitably used to establish effectively the cost as a reliable metric.
In IDS, the fixed cost-sensitive model presents higher FP costs and extra FN costs [11] . So, to avoid this problem a new optimization cost model for IDS is required.
In the rest of the paper we focus our study on FP and we present a new optimization cost model which lets the IDS works with minimum costs by reducing the impact of FP responses. Our proposed model presents a minimal interval where the IDSs work optimally.
The rest of this paper is organized as follows. Section 2 presents the IRS module and performance indicators. Section 3 presents an overview on curve ROC in IDS. In Section 4 we review related work. Section 5 presents our improvement with simulations and results. The conclusion is given in Section 6.
2. IRS Module & Performance Indicators
Among the four principal modules of an IDS, we distinguish the response decision module that permit basing on analysis results to launch an alarm as passive response or communicate a decision to IRS to activate an active response. The IDS functional architecture is represented according to the figure 1.
The Intrusion Response System (IRS) is a mechanism destined to ensure output as intrusion response following an IDS systems analysis. Various solutions of IRS had been applied by notification or by manual or automatic responses. To be able to initiate a response, it is necessary to determine what kind of attack we are faced.
According to our work described in [20] , we proposed an IRS organization according to their parameters assessment, which is shown following the figure 2.
We focus on cost sensitive IRS. For that many indicators are defined for performances.
We define various indicators and metrics used in IDS performance evaluation. Those metrics evaluate the ability of IDSs to detect effectively malicious activities. So in order to assimilate the performance characteristics of various IDSs, several indicators or measures are needed to quantitatively assess the competence of the intrusion detection. To date, many indicators have been proposed to evaluate IDS. But it is imperative to learn and study the behavior of the IDS before having the ability to evaluate its performance. We distinguish:
• True negative (TN): represents the number of normal activities seen by the IDS as normal.
• True positive (TP): represents the number of intrusions seen by the IDS as true intrusions.
• False negative (FN): represents the number of intrusions seen by the IDS as normal.
• False positive (FP): represents the number of normal activities seen by the IDS as intrusions.
• Accuracy: shows the percentage of real intrusions from the real number of intrusions reported by the IDS:
 (1)
(1)
• Rate or probability of detection: shows the percentage of reported intrusions from the number of intrusions:
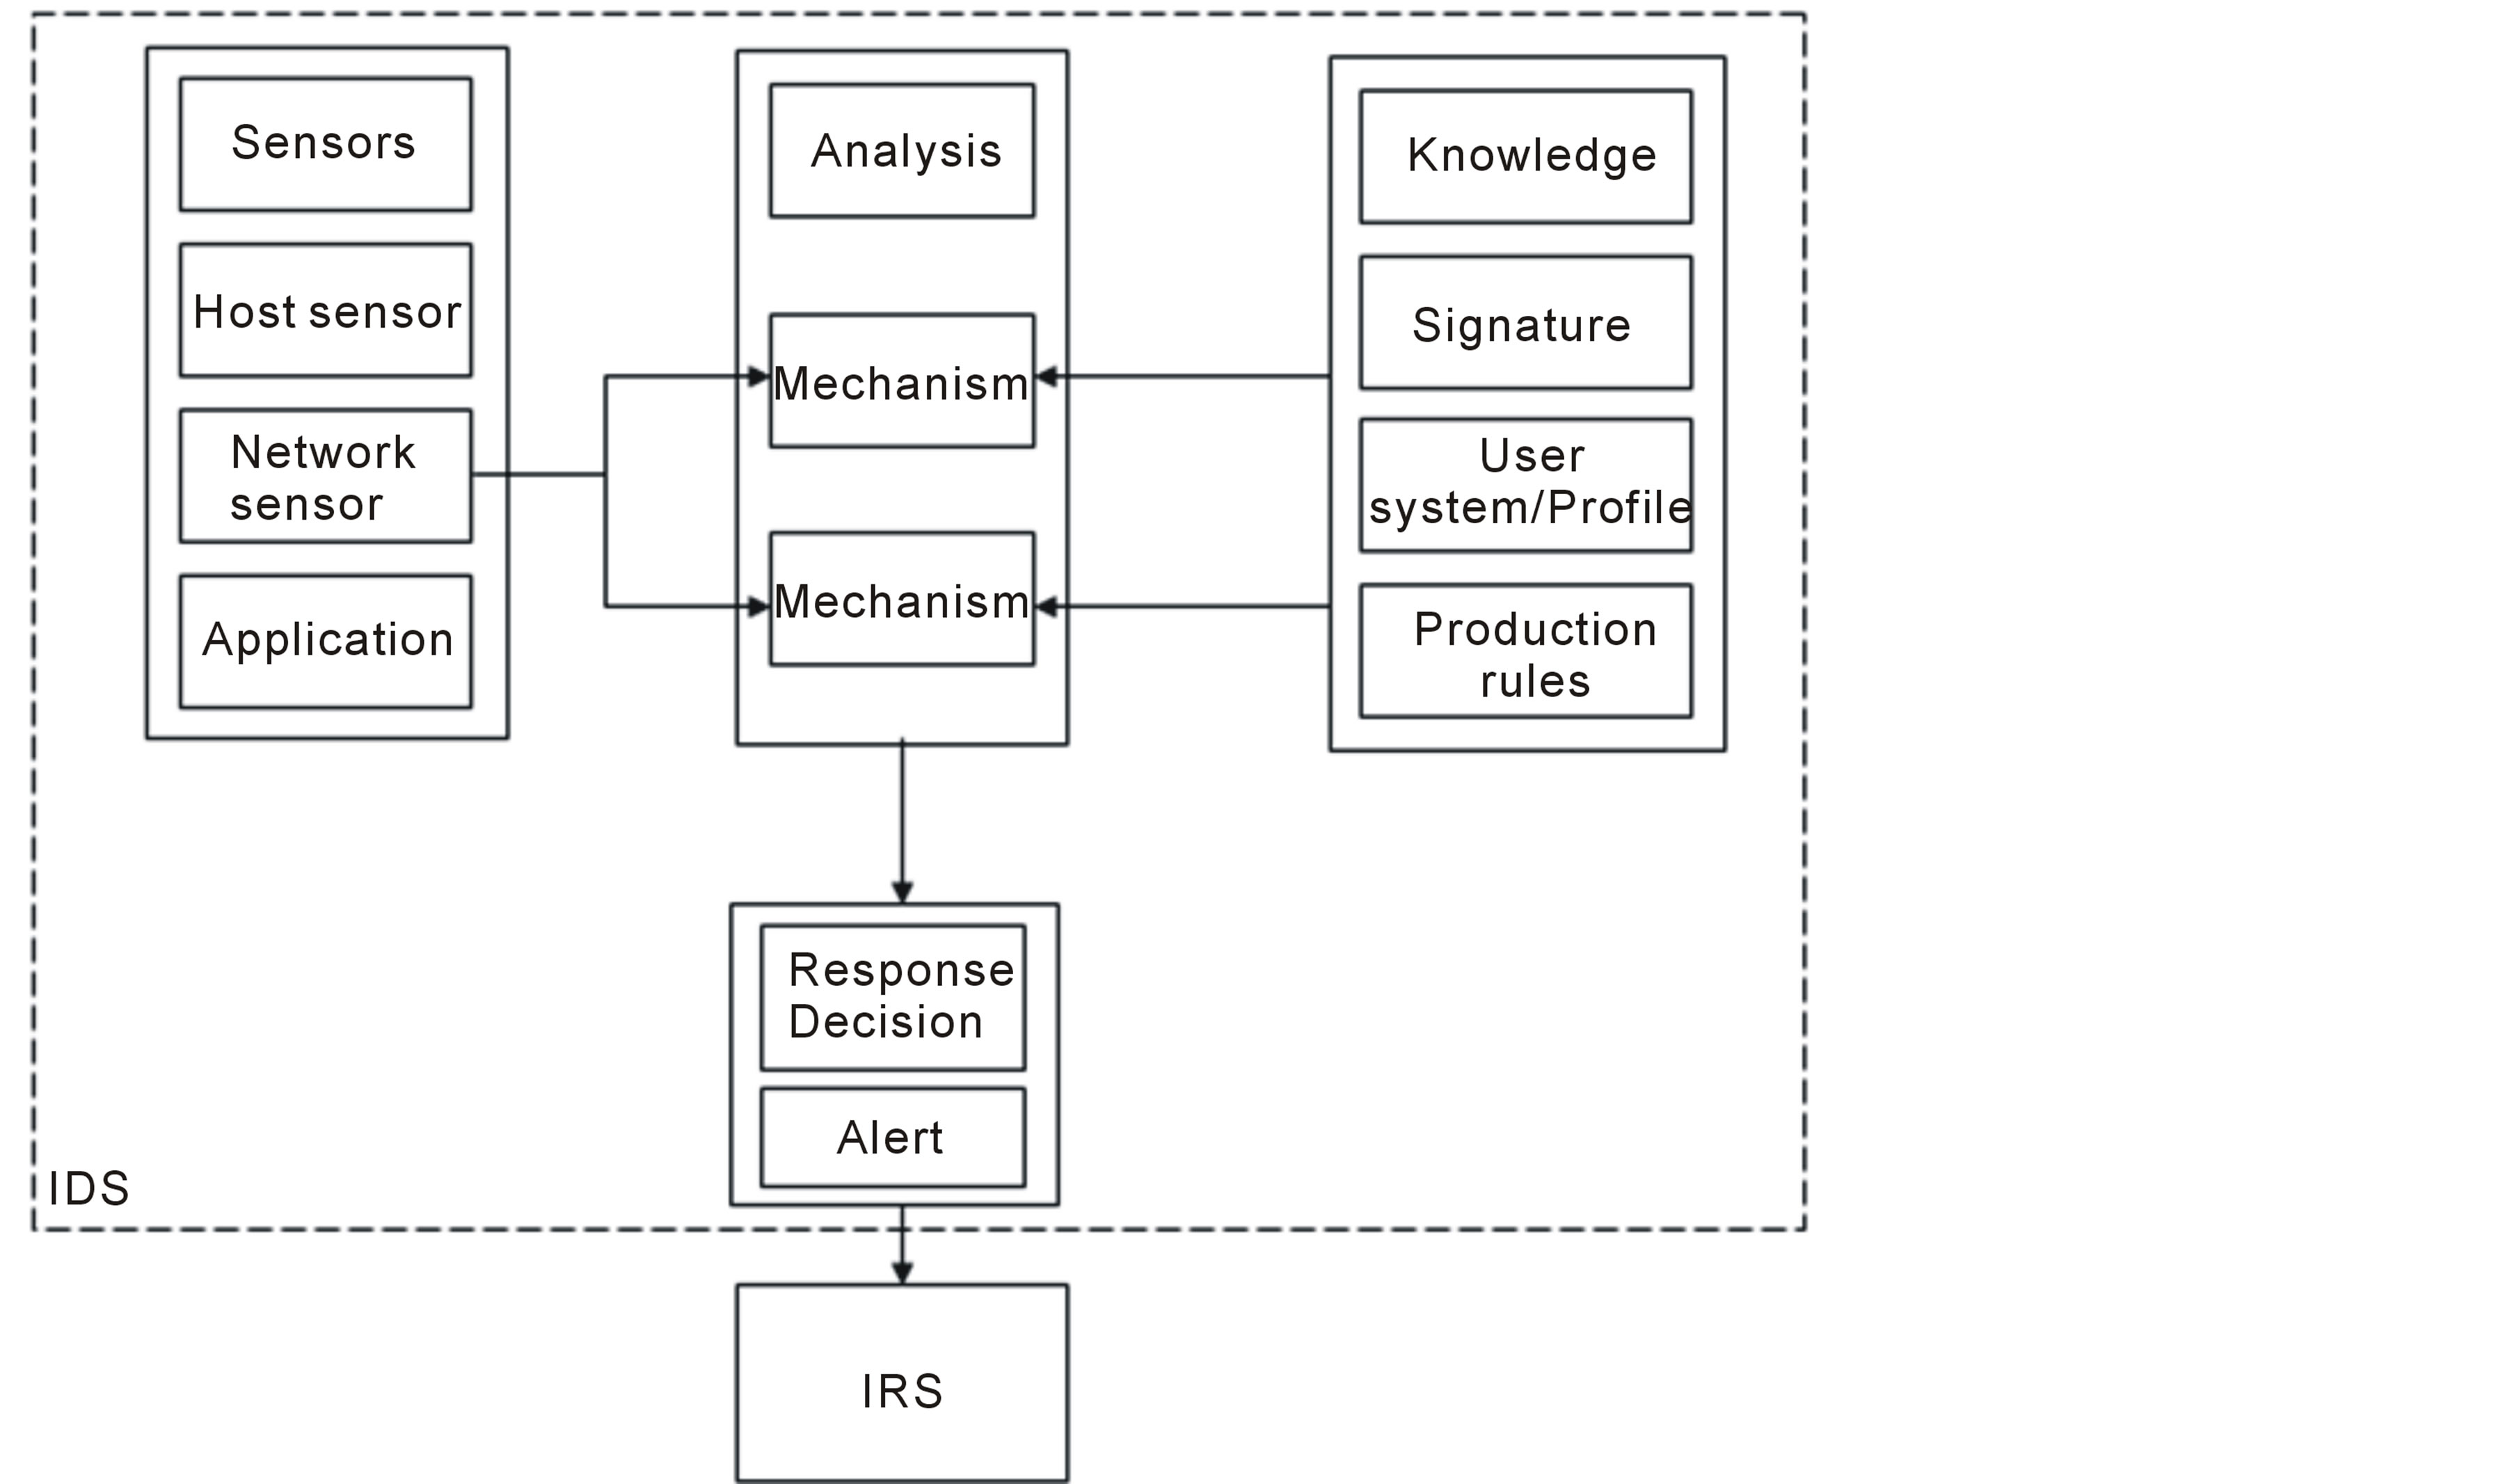
Figure 1. IDS Functional architecture.
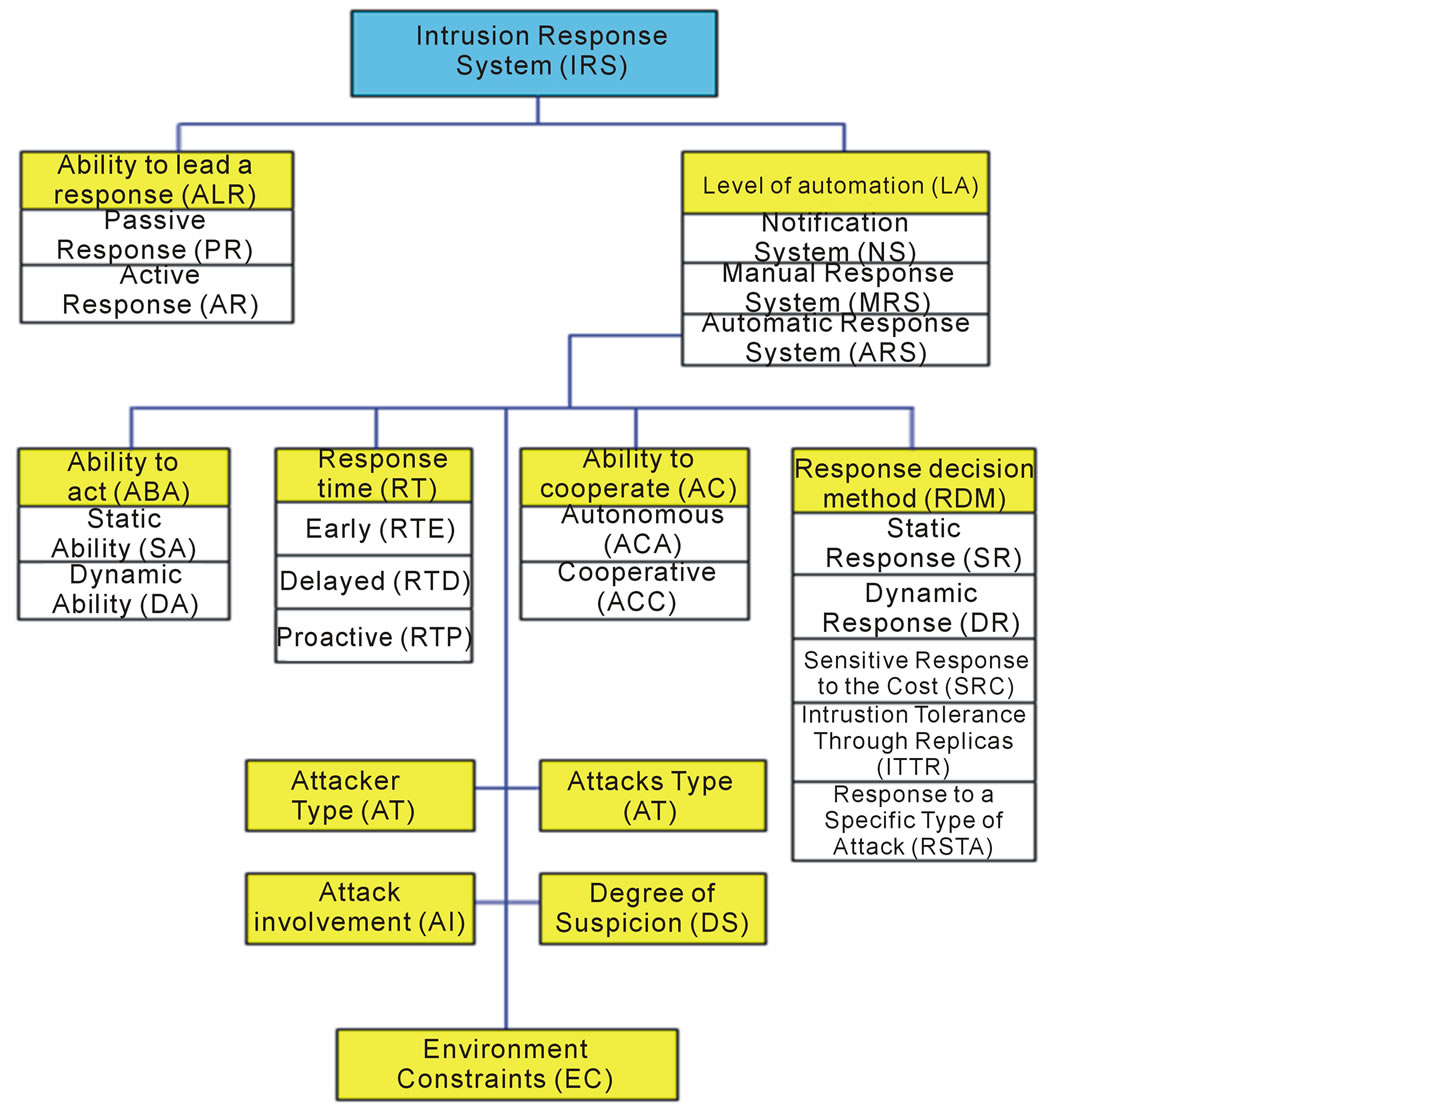
Figure 2. IRS Organization and their parameters evaluation.
 (2)
(2)
• ROC curve: describes the relationship between the characteristics of IDS, the probability of detection (1 − λ) and probability of false positive alarm (θ). It represents θ provided by the IDS at a given (1 − λ). The ROC curve summarizes the performance of IDS.
In the next section we focus on this indicator which will be used in our contribution.
3. ROC Curve in IDS
3.1. Introduction to ROC Curve
In signal detection theory, a receiver operating characteristic (ROC), is a graphical plot which illustrates the performance of a binary classifier system as its discrimination threshold is varied. This technique has long been used to depict the trade-off between hit rates and false alarm rates of classifiers. This graph is created by plotting the fraction of true positives out of the positives (TPR = true positive rate) versus the fraction of false positives out of the negatives (FPR = false positive rate), at various threshold settings.
ROC analysis provides tools to select possibly optimal models related to the ratio cost/benefit analysis of diagnostic decision making [21] . These characteristics have become progressively more significant as study continues into the field of cost-sensitive knowledge and learning in the occurrence of unbalanced classes.
3.2. Basic Concept
A classification model (or classifier) is a mapping from instances to certain predicted classes. We consider the classification problems using only two classes (binary classification). Officially, every instance I is mapped to one ingredient of the set {p,n} consisting of positive and negative class labels.
Taking a classifier and an instance, there are four possible outcomes from a binary classifier. If the outcome from a prediction is positive and the instance is also positive, then it is called a true positive (TP); however if the instance is negative then it is said to be a false positive (FP). In opposition, a true negative (TN) has happened when together the prediction outcome and instance are negative, and false negative (FN) is when the prediction outcome is negative while the instance is positive.
Given a classifier and a set of instances (the test set), a two-by-two confusion matrix (also called a contingency table) can be constructed representing the dispositions of the set of instances. This matrix forms the basis for many common metrics.
3.3. ROC Space
A ROC space is defined by FPR and TPR as x and y axes respectively, which depicts relative trade-offs between true positive (benefits) and false positive (costs). Since TPR is equivalent with sensitivity and FPR is equal to 1 − specificity, the ROC graph is sometimes called the sensitivity versus (1 − specificity) plot. Each prediction result or instance of a confusion matrix represents one point in the ROC space. The figure 3 represents a basic ROC graph showing five discrete classifiers.
The best possible prediction method would yield a point in the upper left corner or coordinate (0,1) of the ROC space (the point M), representing 100% sensitivity (no false negatives) and 100% specificity (no false positives). The (0,1) point is also called a perfect classification. A completely random guess would give a point along a diagonal line (the so-called line of no-discrimination) from the left bottom to the top right corners (regardless of the positive and negative base rates). An intuitive example of random guessing is a decision by flipping coins (heads or tails).
The diagonal divides the ROC space. Points above the diagonal represent good classification results (better than random), points below the line poor results (worse than random).
4. Related Work
In our contribution, we present a new model formulation of an intrusion detection system (IDS) operating which lets the IDS works with minimum costs by reducing the impact of FP and FN responses. Our proposed model proposes a minimal interval where the IDS works optimally. In simulation, we will found this interval as a
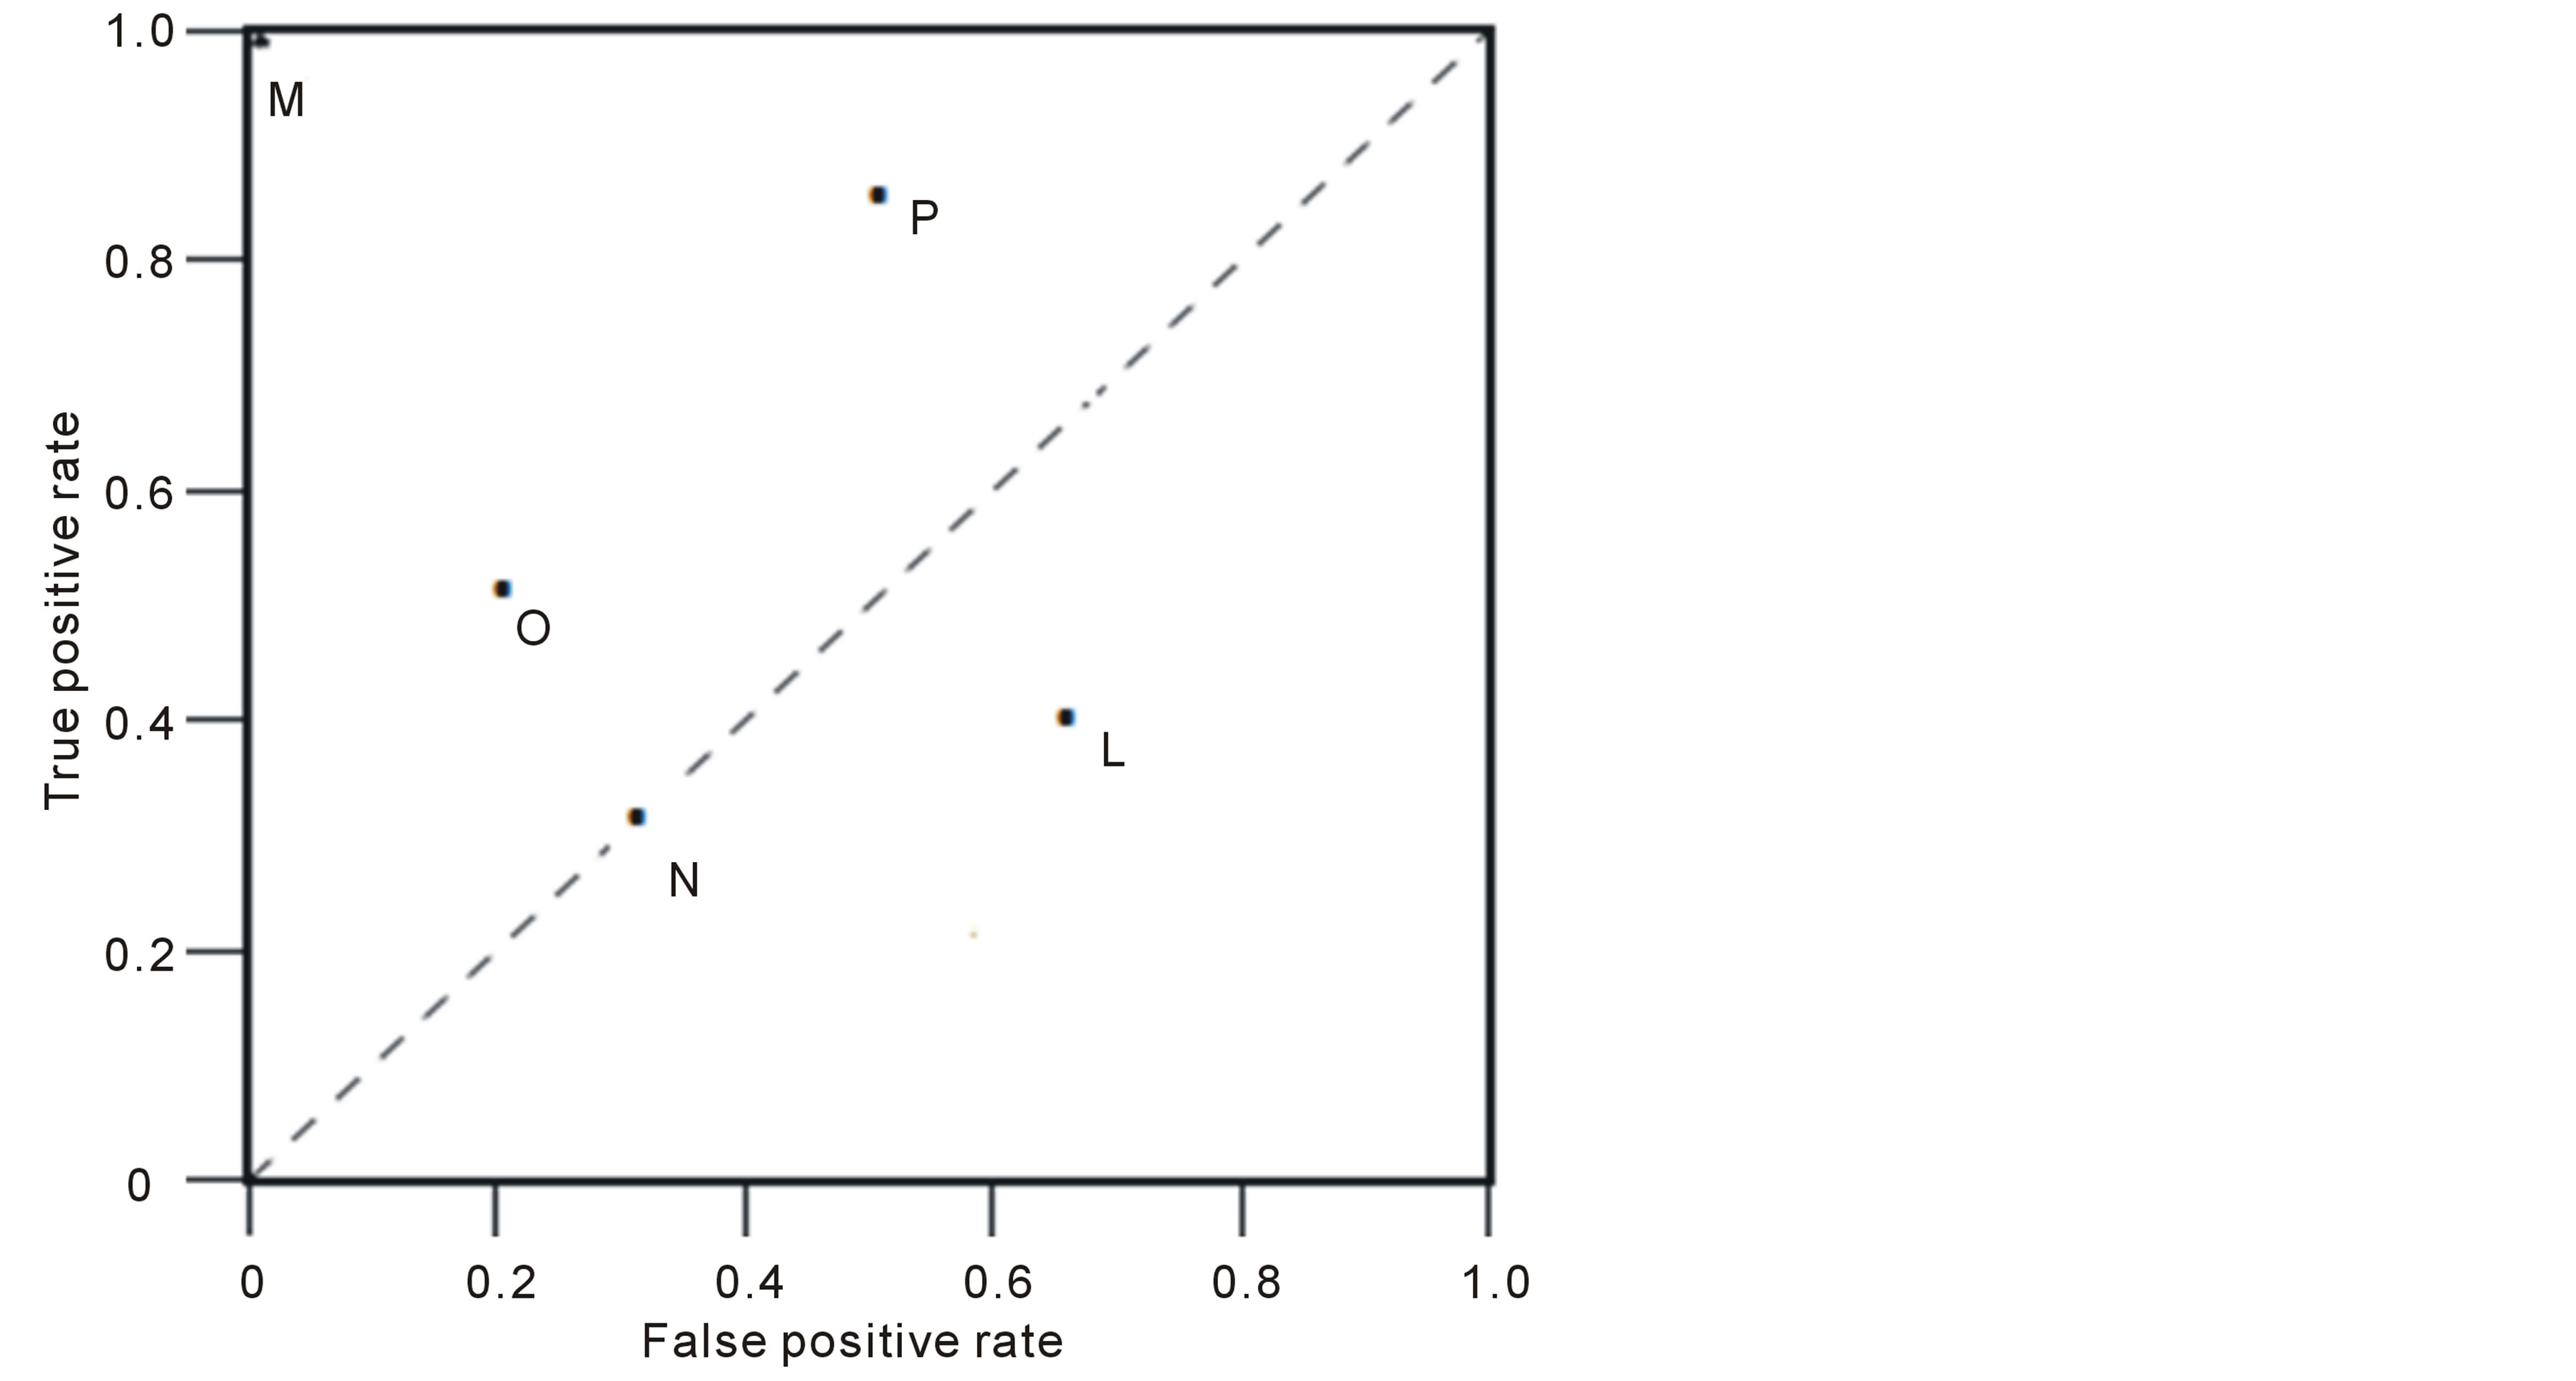
Figure 3. A basic ROC graph showing five discrete classifiers.
trade-off between the damage costs and the FP.
In the field of dynamic cost IRS, many research works are done independently of the purpose of FP minimization. We can mention the following researchers works: B. Foo [22] , T. Toth [23] , I. Balepin [24] , M. Jahnke [25] , S. Yu [26] , M. Papadak [27] , K. Haslum [28] , C. P. Mu [29] , W. Kanoun [30] and N. Kheir [31] . All these works present different models of dynamic cost IRS without the explicit false positive responses minimization.
At the first, Denning asserted in his study [32] , that the study of the costs is not seen in the aspect of an authentic knowledge. This work switched on the first light around the notion of cost in the field of intrusions responses. Northcutt came to treat in [33] the methodology of studies of the risks in the computer systems by describing measures basing itself on degrees of criticality and destruction. Approach proposed by Balepin [24] basing on the principle of the representatives of services used a graphic prototype for the selection of the optimal responses with the institution of a typical hierarchy of resources by engendering the maximum of privileges with the minimum of cost. Toth [23] used of a prototype of a computer network by taking into account means (functions/services), the users, the type of the network and the control access systems. The costs of the responses are measured by basing on the decrease of the values of the capacities of the resources. The work of followers [22] was presented as Framework allowing the choice and the deployment of the automatic response against intrusions basing on two categories of graphic plans: a plan of service and plan of response. These models and these solutions evoked above are not coherent between them. Every proposal has a concept of evaluation and selection of response cost sensitive with a different vision. The works of [32] and [33] evoked for the first time the notion of cost, and the method of study of the risks in the field of detection of intervention without treating the response cost with connection with intrusion cost. The works presented by [23] and [30] considered the response cost in contribution with the resources of system, by showing several processes of estimation. Toth [23] calculates the cost of response as a function of decrease of capacity of system. [24] measured the cost of answer being the sum of the costs manually committed by the affected system resources. All works cited before did not take into account the impact of cost false positive response, and his necessary minimization to have appropriate responses.
There are little research works that targeted the minimization of false positive responses within the cost sensitive IRS [17] . We can mention the following researchers works: W. Lee [34] , Strasburg [14] , S. Tanachaiwiwat [35] , and N. Stakhanova [15] .
Lee [34] considered experimental costs of the effects of the intrusions and the measures taken by the responses as criteria for the responses choice against the intrusions already classified. This work introduces a cost-benefit measure which incorporates multiple dimensions of cost in the face of an intrusion: response cost. Strasburg [14] and N. Stakhanova [15] present a host-based framework for cost-sensitive intrusion response selection with an evaluating method for each intrusion response. This evaluation is done in the light of potential damage risk, response effectiveness and response cost.
The minimization of FP response is treated implicitly with damage cost optimization. S. Tanachaiwiwat [35] presents a framework constructed with three essential modules: the IDS, the RAS (Risk Assessment Systems) and the IRS. The RAS is able to distinguish different kinds of false alarms or miss detections. The minimization of FP responses is done in the context of the RAS without the use of any FP reducing algorithm.
Other works have evocated the false alarm (positive and negative) as principal element in the performance of IDS, the ROC curve [19] , with the notion of cost. A ROC is defined as the curve describing the relationship between the characteristics of IDS, the probability of detection (1 − λ) and probability of false positive alarm (θ). It represents θ provided by the IDS at a given (1 − λ). The ROC curve summarizes the performance of IDS.
Those works do not use sufficiently all ROC curve information to establish effectively the cost as a reliable metric. Consequently, suitable responses toward real intrusions increase the quality and the accuracy of IRS.
Lippmann et al. [18] requires a distinctive new assessment with the use of technical characteristics of the receiver (ROC) to evaluate IDS. This assessment was based on a simple comparison of ROC curves to determine dominant curve that is located above and to the left of dominated curve. No indicator was presented for the degree of dominance. Durst et al. [36] ensure that, the area under the curve is a measure of the IDS efficiency and presents a FP alarm which is convenient.
Saydjari [37] suggested an objective for a detection probability and the false alarm probability.
Stolfo et al. [38] present a process for the evaluation of IDS using cost elements. They have showed that conventional information used for the ROC analysis is incomplete and may be unsuitable for this purpose. They argue that their cost-based indicators are most appropriate. They do not reveal how their process uses all the information in a ROC curve, they do not give a convincing representation of the advantage of the cost metric. McHugh [39] has a very methodical debate on the work of DARPA 1998 evaluation [40] by discussing the ROC curves building manner, sufficiency of ROC analysis, particularly in the case of diverse measurement unit for diverse IDS.
5. Our Improvement
The aim of our work is find the cost model formulation of an intrusion detection system (IDS) operating. To achieve this objective, it is necessary to establish hypotheses work and doing the IDS operating analysis.
5.1. Hypotheses
We consider that:
• The IDS generates an alarm in case of detection of an intrusion. This uncertain event is not controlled by the network administrator. Its probability is denoted p1. The probability of no alarm is noted (1 − p1).
• The IDS provided by a system intrusion response (IRS) can trigger a response (R) or not trigger no response (NR). This action is a certain event that ensures countermeasure against an intrusion.
• The intrusion (I) is an uncertain event long as it is not controlled by the network administrator. Its probability is denoted by p. The probability of no intrusion (NI) is noted (1 − p).
• p2 is the conditional probability given that the IDS reports an alarm and p3, the conditional probability given that the IDS don’t report an alarm.
• The operating point of an IDS is represented by the couple (θ, λ) with θ is the probability of false positives, when the IDS reports an alarm if such an intrusion, when it is not. (1 − λ) is the probability of detecting of an IDS By combination uncertain events (reports) and (intrusion conditions) and certain event (response action), a result is created as IDS running cost noted Cf.
• The IDS running cost includes the following intrinsic costs:
o Maintenance and service cost: it is noted Ce.
o Administration cost: it is noted Ca.
o IDS Running cost: it is noted Cm.
o The cost of a correct response or reaction to intrusion: it is noted CR.
o Errors cost: it includes the following two costs:
§ Cθ: the cost of false positives when the IDS launch a response as it is an intrusion and really it does not.
§ Cλ: the cost of no intrusion detection, when the IDS don’t detect neither launches a response against a real intrusion. This cost represents also the damage cost.
5.2. IDS Operation Analysis
The IDS operating analysis is based on the examination of uncertain events and certain actions following:
• Report: it is an uncertain event with a probability of occurrence noted p1.
• Response: is a certain action ordered by the IDS.
• Intrusion: is an uncertain event with conditional probabilities of occurrence p2 and p3.
• Cost Result: it is an uncertain cost whose value depends essentially on conditions intrusion, report and response states cited above.
These events and actions can be represented according to table 1.
By analyzing the operation of IDS, we can distinguish eight cases shown in table 2:
The overall cost of running the IDS is noted as follows:


So: (3)
(3)
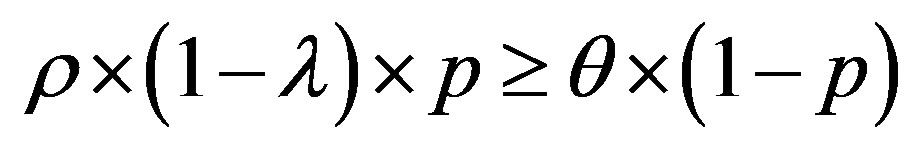
To get optimum performance of the IDS, it is advantageous to minimize the cost of operation Cf expressed according to the expression (3). Therefore, it is beneficial to minimize the cost of errors according to the relationship:


 (4)
(4)
To get the optimum performance of the IDS, it is advantageous to minimize the error cost expressed according to the expression (4).
We consider the following cost ratio: 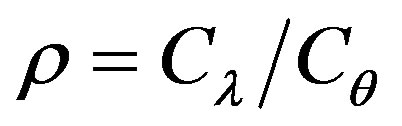

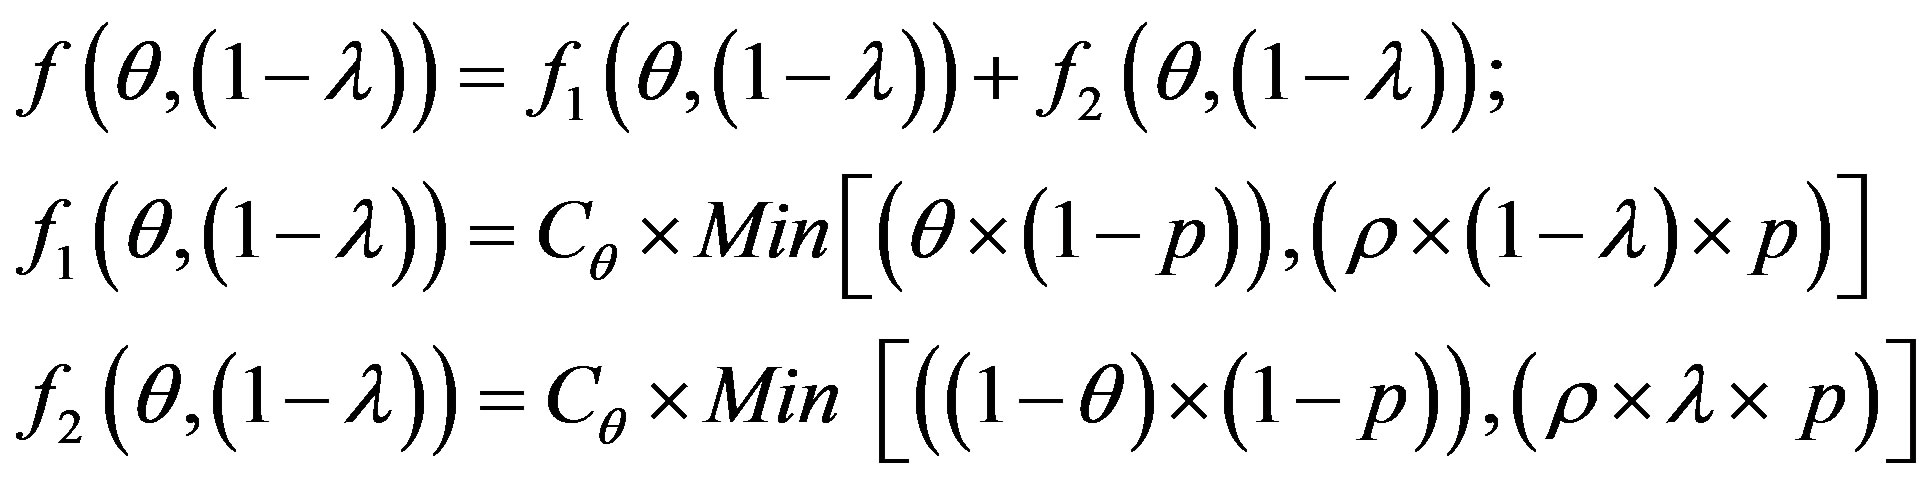
The error cost minimizing is based on the minimizing of the following uncertain cost ratio:
 (5)
(5)
The study of this formula returns to the study of the follow function f with the two strangers: θ and 1 − λ

Table 1. IDS events and actions.
Table 2. IDS operations cases.
The line 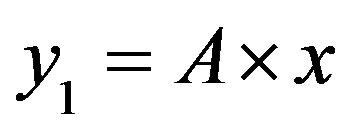 with
with 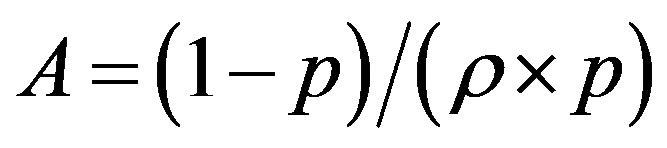 divides the area of ROC in two essential areas:
• Area 1: , so:
, so: 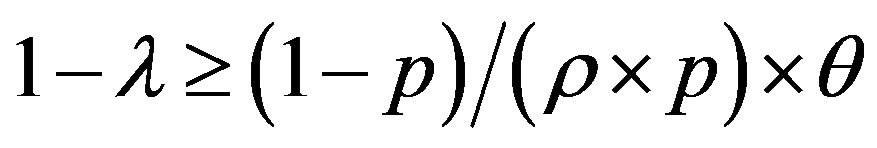
Then: 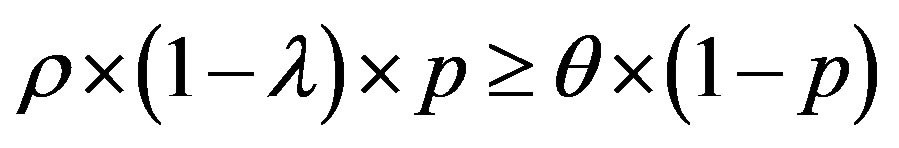
• Area 2: ,
, 
Then: 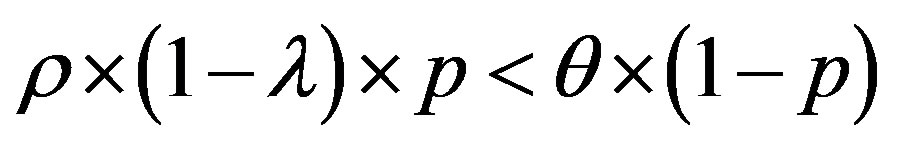
The line 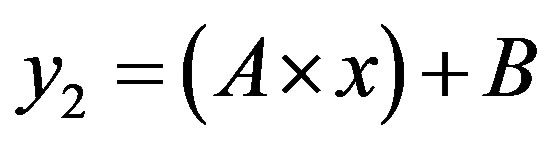 with
with  and
and 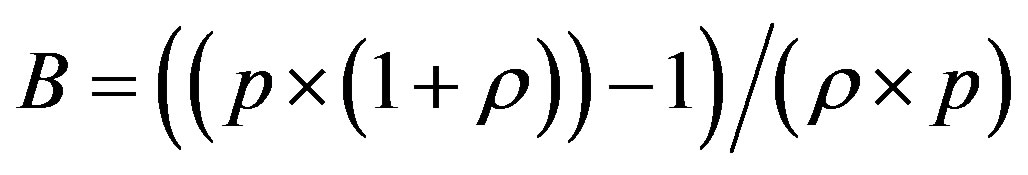 divides the area of ROC in two essential areas:
• Area 3: 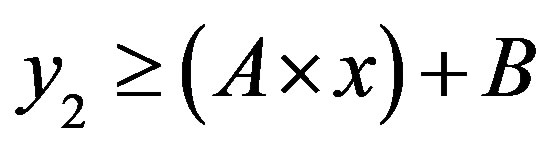
So: 
Then:
• 
• Area 4: 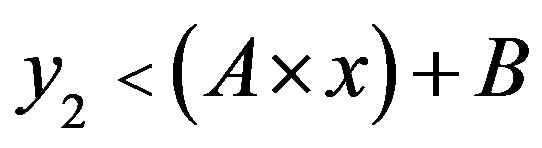
So: 
Then: 
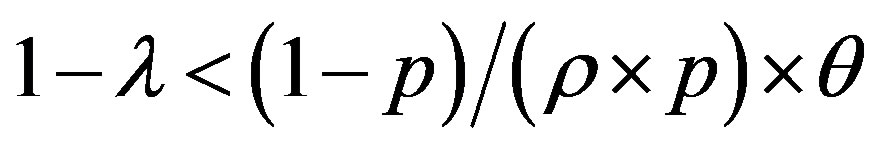
After what precedes, the simplification of the formula of cost (5) depends on the sign of term B, so the arrangement of the two lines  and
and .
.
• Case 1:  i.e.
i.e. 
In this case, the figure 4 shows that the line  is located above the line
  in the area of ROC.
In the ROC space, we distinguish three zones:
• Zone 1: in this zone, the functioning point is below the two lines  and
and 
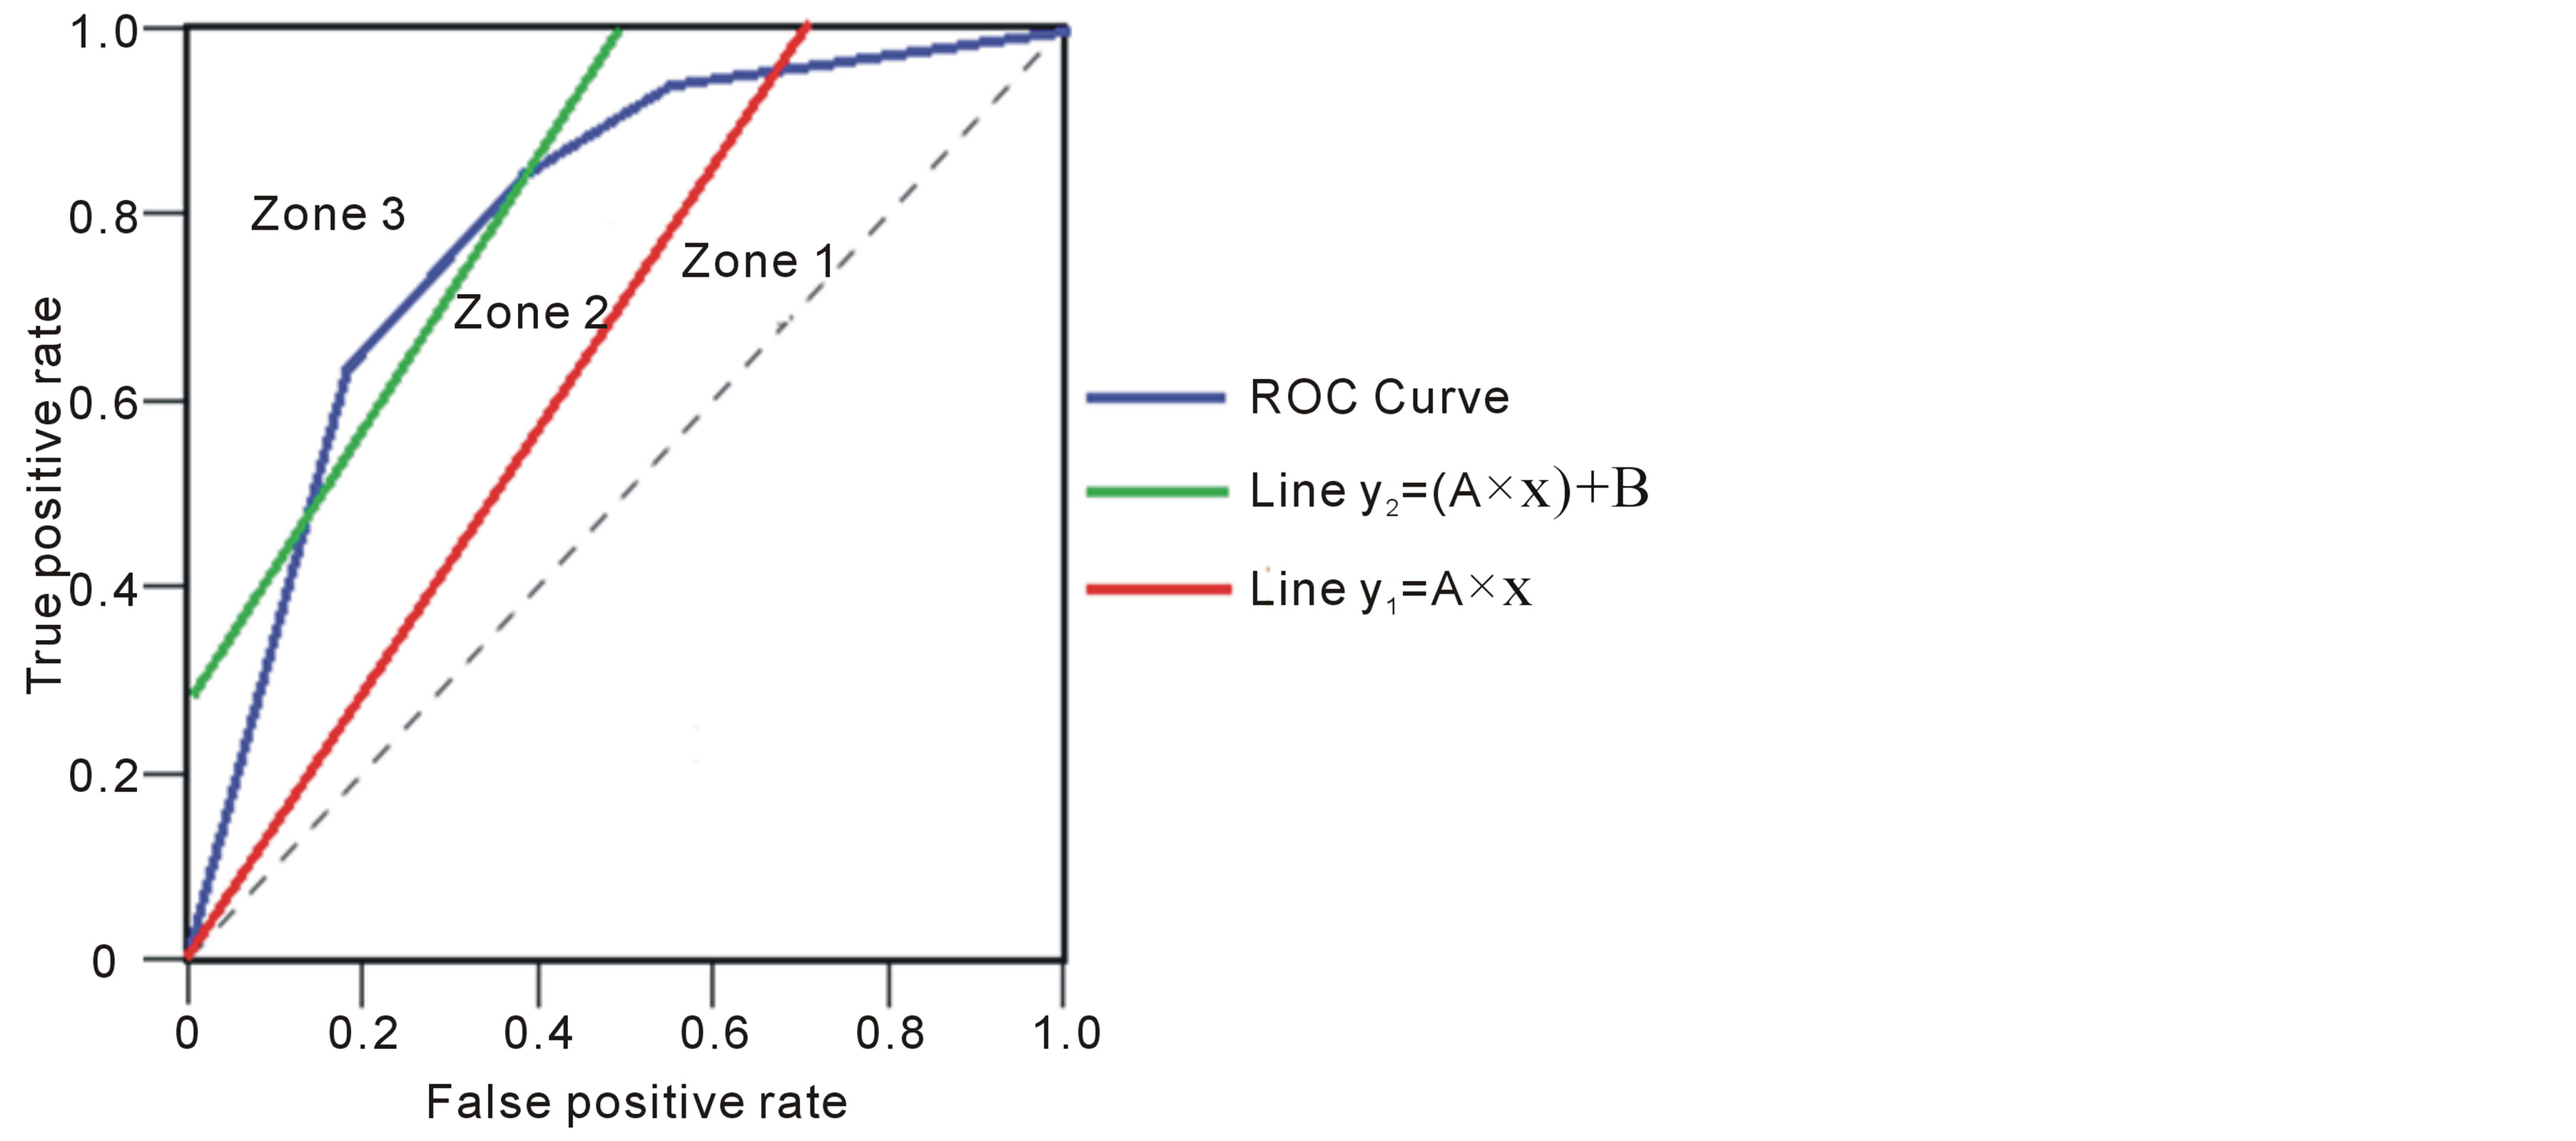
Figure 4. ROC space with .
.
we have:  and
and 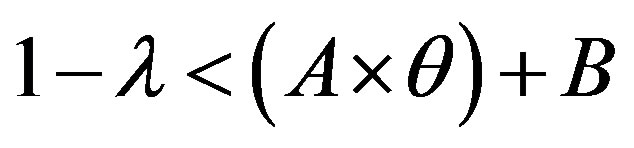
 and
and 


• 
• Zone 2: in this zone, the functioning point is below the line 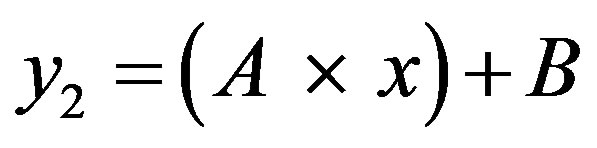 and above the line
We have:  and
and 
 and
and 


• 
• Zone 3: in this zone, the functioning point is above the two lines  and
and .
.
We have:  and
and 
 and
and 


• 
• Case 2:  i.e.
i.e. 
In this case, the figure 5 shows that the line  is located bellow the line
  in the area of ROC.
In the ROC space, we distinguish three zones:
• Zone 1: in this zone, the functioning point is below the two lines  and
and .
.
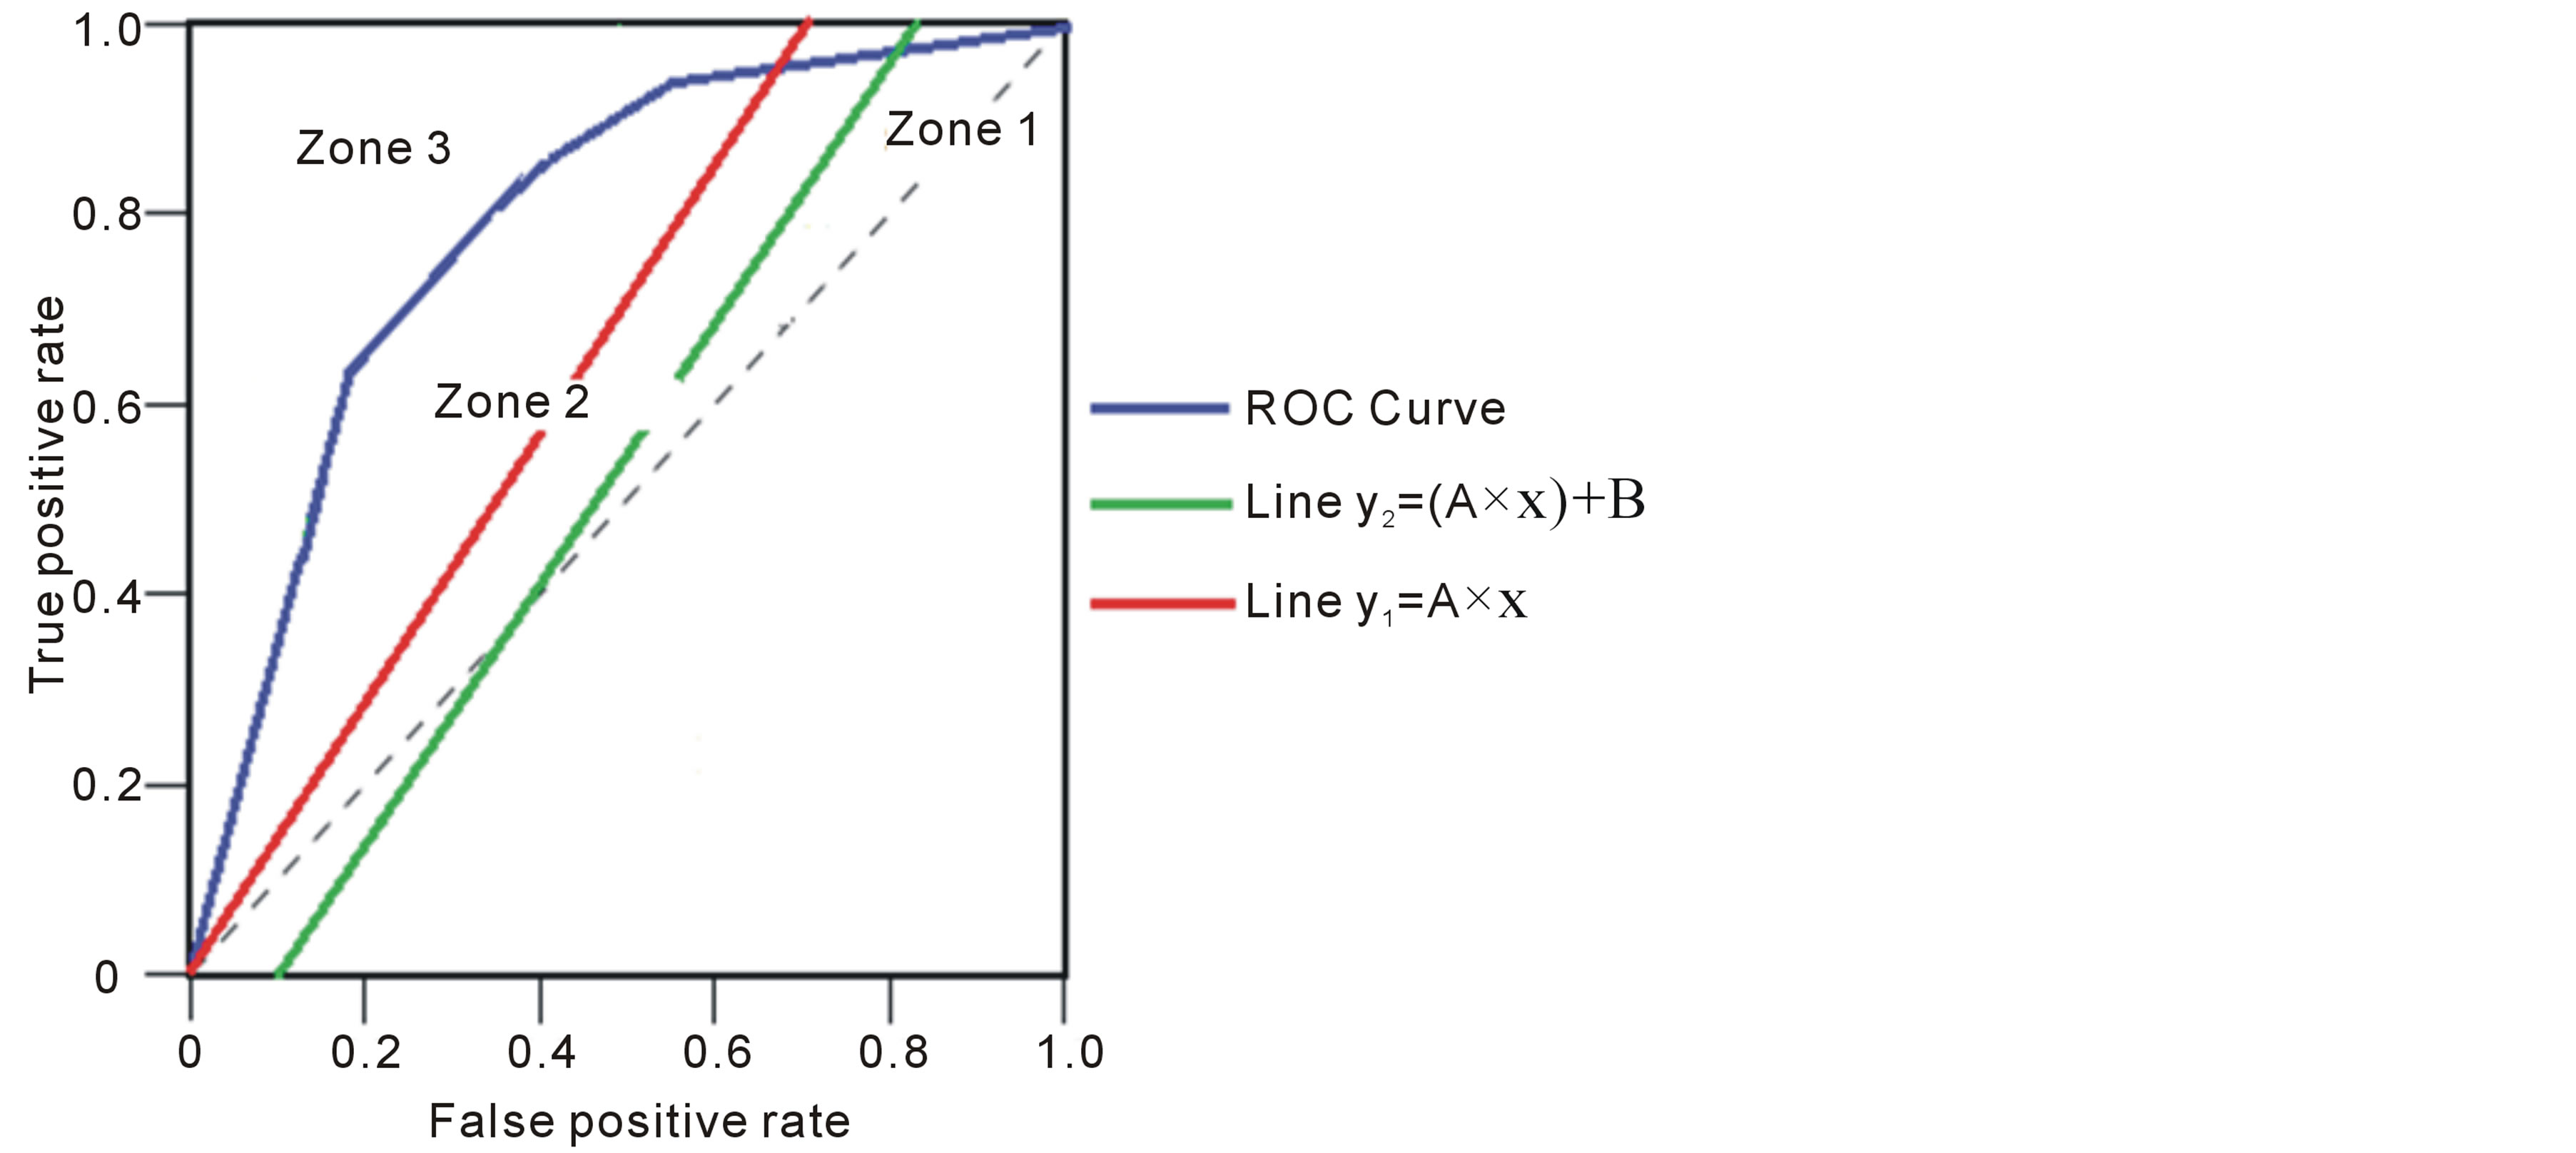
Figure 5. ROC space with .
.
We have:  and
and 
 and
and 


• 
• Zone 2: in this zone, the functioning point is below the line  and above the line
 .
.
We have:  and
and 
 and
and 


• 
• Zone 3: in this zone, the functioning point is above the two lines  and
and .
.
We have:  and
and 
 and
and 


After the previous study, we can present all the scenarios in table 3.
This cost is for one incoming request. If there are N incoming requests, the costs referred to above must be multiplied by N.
Table 3. Cost formula simplification.
5.3. Parameter Values
To introduce our simulation, we represent the values of all parameters in table 4.
5.4. Simulation
• 1) Methodology:
• Selection of the target IDS in our study, characterized by performance indicator: the ROC curve.
• The ROC curve describes the relationship between the characteristics of an IDS, the probability of detection (1 − λ), and the probability of false positive alarm (θ). It represents θ provided by the IDS at a given time (1 − λ). The ROC curve summarizes the performance of IDS.
• We show how the cost model can be implemented once the five ROC curves are constructed of IDS. We will implement our cost model on the ROC curves in three different cases to evaluate the behavior of each classifier (ROC).
• 2) Purpose of simulation
• Study the impact of choice of Cλ and p on the minimization of the function f (θ, (1 − λ)) = Min [(cost ratio (error)]
• Study the impact of choice of Cλ and p on the choice of the optimal interval where the IDS works optimally.
3) IDS Targeted
The five IDS Targeted by our study is characterized by the following values of the couple (θ, λ). The (ROC) curve of these IDS is represented according to the following table 5 and figure 6.
As shown on the ROC curves, the five IDS can be classified according to their detections probability following the minimum false positive rate as follows according to table 6.
For a precise value of detection probability, the IDS4 (the best) has the minimum value of false positive rate and the IDS5 (the worse) has the maximum value of false positive rate.
For a precise value of false positive rate, the IDS4 (the best) has the maximum of value of probability detection and the IDS5 (the worse) has the minimum value of probability detection.
4) Simulation parameters values:
We consider the following three cases of simulation shown according to the table 7.
These values have been used in formulas described in the table 3. These new formulas are represented in table 8.
5) Simulation of the five IDS:
According to simulation parameters values shown in table 7, the figure 7 represents the five simulations related to the five IDSs and the three cases.
6) Simulation results and discussion
• a) General results
• The cost begins to decrease as the probability of detection (1 − λ) is increasing. Since (1 − λ) increases, the number of missed intrusions decreases and also for associated costs. However, after a certain point, if we continue to increase the value of (1 − λ) the projected cost stops decreasing and begins to increase.
• At this point, the cost of false positives is higher than the cost of missed intrusions (cost of damage). This is known as the “point of minimal cost on the ROC curve” or (PMCR).
• b) General results for the three cases
• For the four IDS: IDS1, IDS2, IDS3 and IDS4 the cost of PMCR is minimal for the case 2 and maximal for the case 3. So, the IDS functioning point cost is cheaper in the case 2, because the cost damage Cλ is the low, so, with less missed intrusions most damage. The IDS functioning point cost is priced in the case 3, because the cost damage Cλ is high, so, with more missed intrusions most damage.
• For the IDS5 the cost of PMCR is minimal for the case 2 and maximal for the case 1. So, the IDS functioning point cost is cheaper in the case 2 and it is priced in the case 1.
Table 4. Simulation parameter values.
Table 5. (θ, λ) values of the five IDS.
Table 6. IDS quality study.
Table 7. (p, Cθ, Cλ, ρ, A, B) values for the three cases.
Table 8. Cost formula simplification with case.
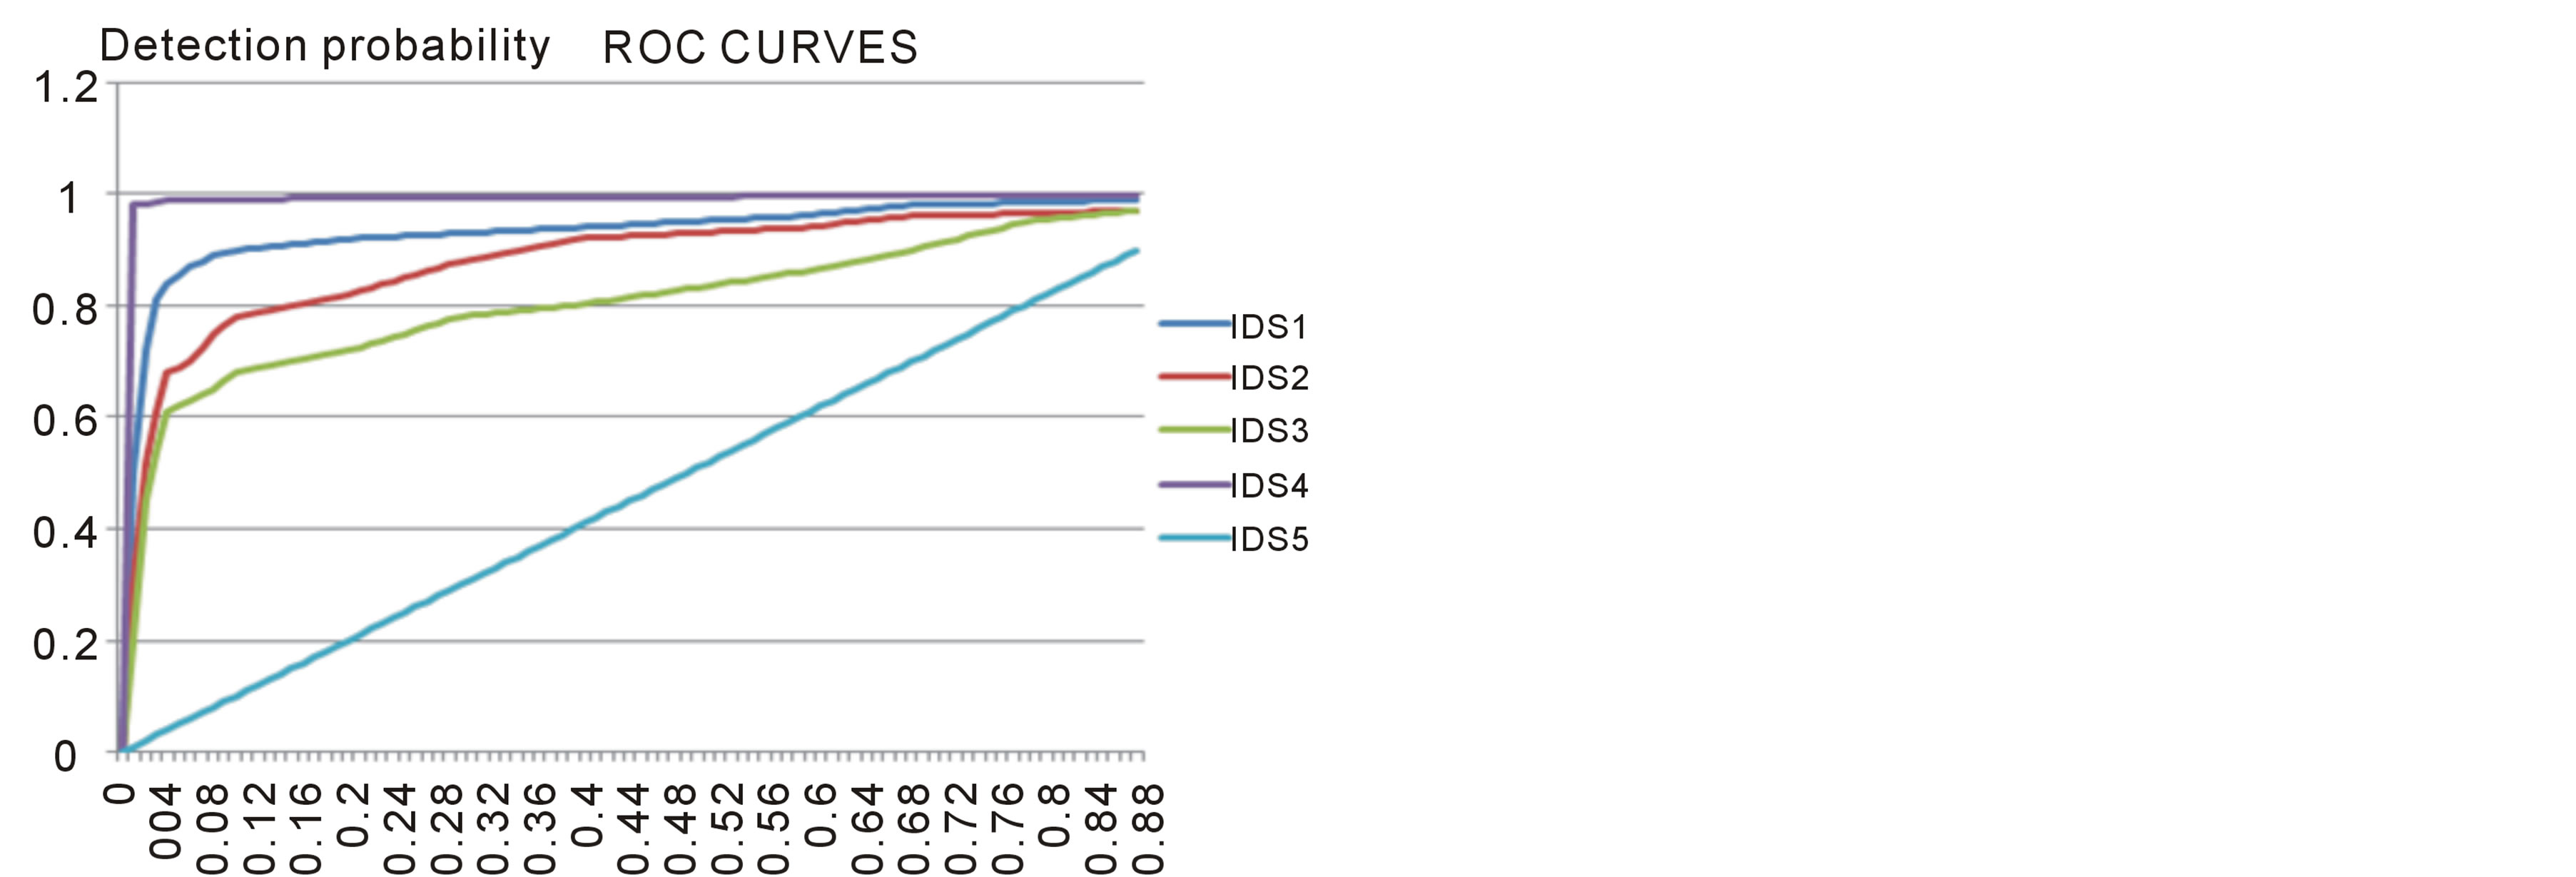
Figure 6. ROC curves of the five IDS.
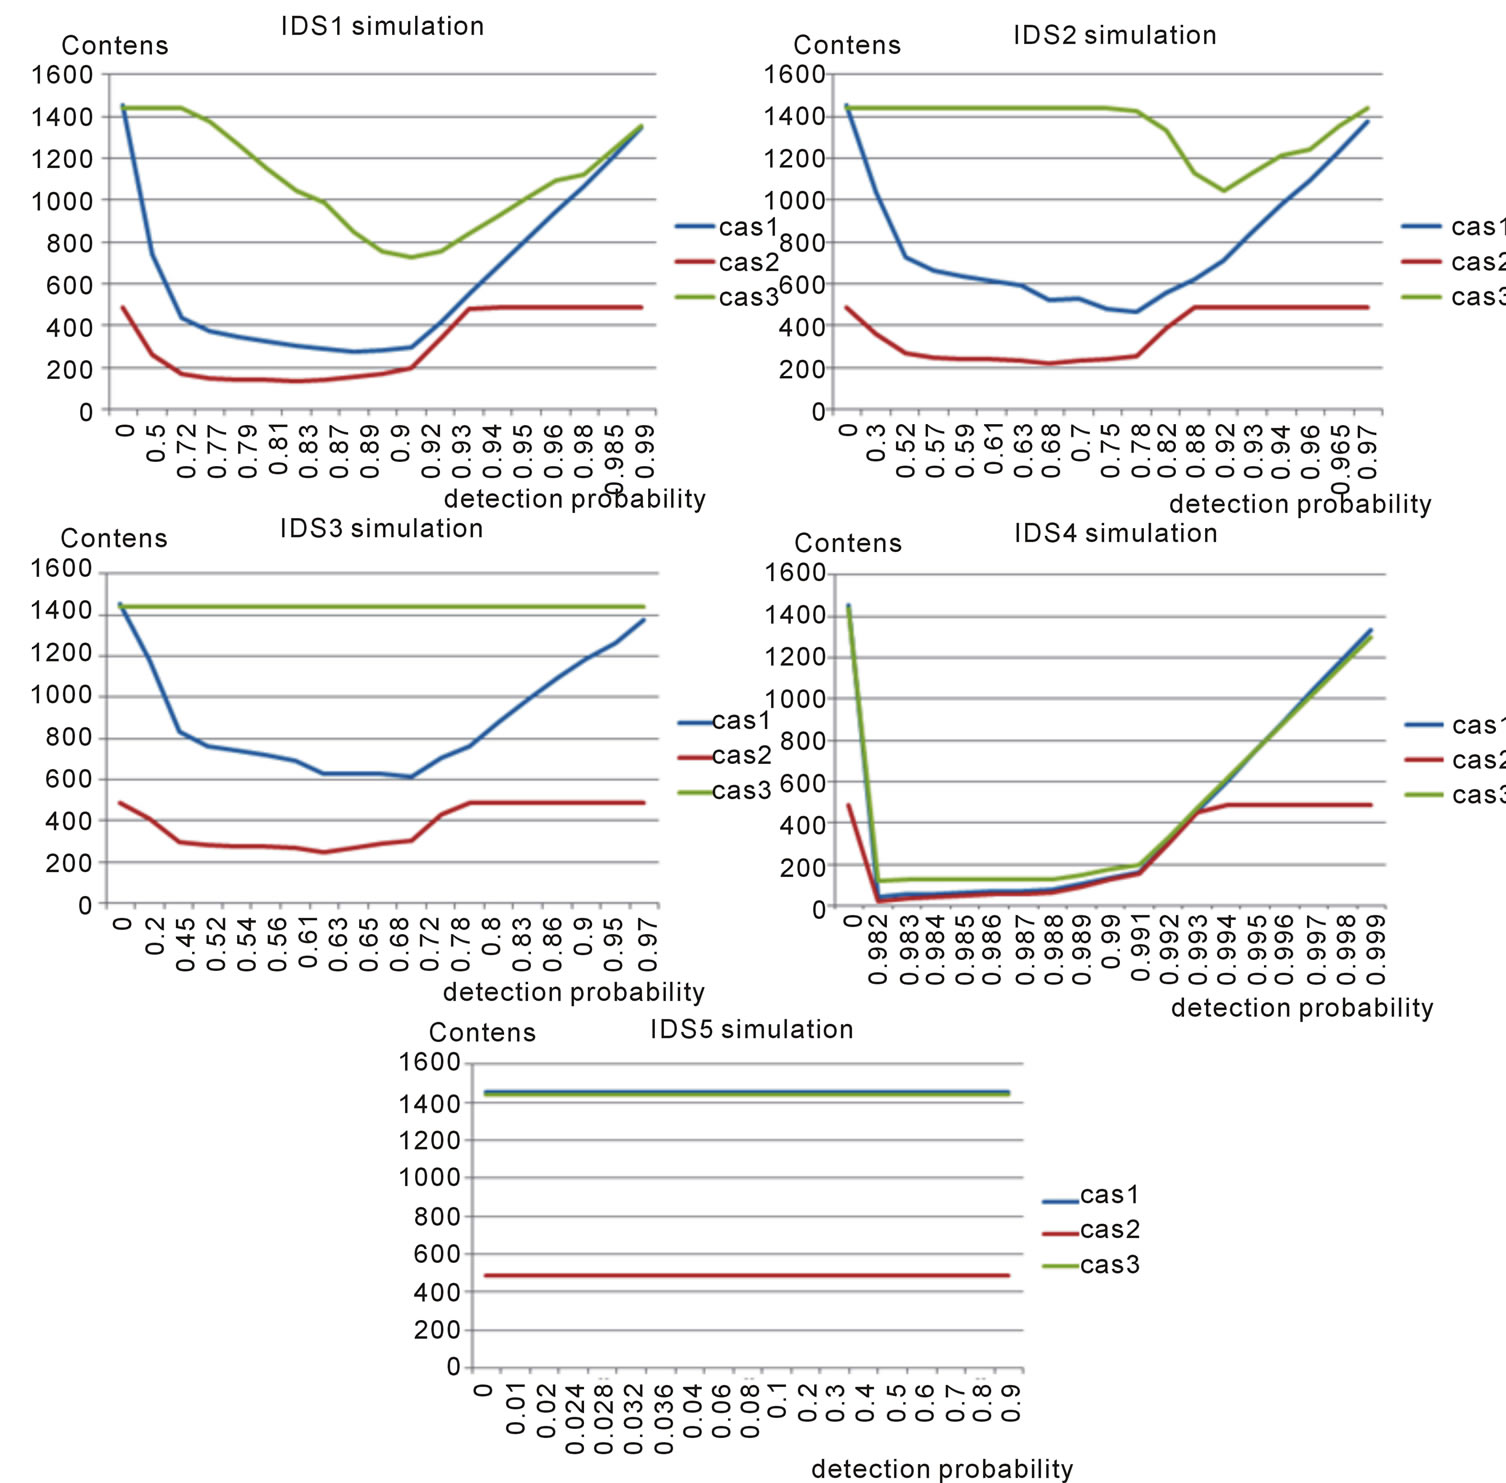
Figure 7. Error cost of the five IDS.
• Cλ for the case 2 is lower. Normally Cθ has a greater impact on the cost and there is a great need to deal with false positives. The probability of false positives and probability of detection in this case have lower values to compensate for the problem of false positives and attain the PMCR.
• With the decreasing of Cλ in the case 2. The detection probability can have inferior values to attain the PMCR.
• In the case 3, intrusions probability has a high value. This fact is the reason of the increasing of errors costs due to the increasing of missed intrusions (damage cost). To deal with that, we prove that the detection probability has increased to attain the PMCR with the minimum possible damage cost.
• c) General results for the five IDS
• For the IDS5, the cost of errors, kept a constant value although the probability of detection has increased. This is due to the existence of the operating point in the zone 2. The ROC curve y = x is localized between the two lines: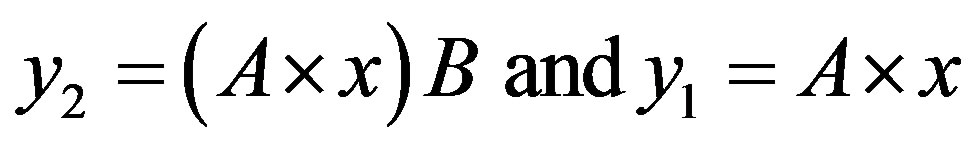 .
.
• The PMCR “point of minimal cost on the ROC curve” which generated the maximum cost for the three cases is the PCMR of IDS5 (the worse).
• The PMCR “point of minimal cost on the ROC curve” which generated the minimal cost for the three cases is the PCMR of IDS4 (the best).
7) Values of cost minimal point for three cases and the five IDS
For the five IDS and for the three cases, we have found the cost of the PMCR, represented in table 9.
A comparison between the PMCR costs of five IDSs according to the three cases is given through the figure 8 below.
8) Interval of trade-off between the damage costs and the FP for three cases and the five IDS
This interval consists of two terminals: lower (a) and upper bound (b).
 (6)
(6)
Graphically, they are represented by the two points of intersection between the graph of the cost function error  and the straight line to the axis of abscissas:
 .
.
 (7)
(7)
With:
 : trade-off cost
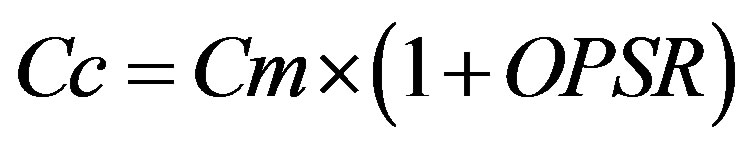
 : optimal band severity rate
 : the PMCR cost For our case, the OPSR can take the values 5%, 25% and 35%.
Below, the table 10 shows trade off intervals related to five IDSs and the three cases according to OPSR values choice.
a) Observations
We refer in the table 10 of results, we find that:
• The optimal interval of the IDS3 (quality: good) is the least qualitatively, as it is defined for low values of the detection probability.
• The optimal interval of the IDS4 (quality: the best) is more qualitative, as it is defined for high values of the detection probability.
• The optimal interval of the IDS5 (quality: the bad) cannot be useful, as long as for the IDS5, the value of cost remains constant and does not depend on the value of detection probability. In this case, we cannot talk about optimal interval of IDS functioning.
• As the OPSR increases, the optimal interval becomes wider. This interval earns more values of detection probability by increasing its supremum and decreasing its infimum.
• As the OPSR decreases, the optimal interval becomes narrowed. This interval loses, in this case, more high and low values of detection probability.
• For the case 2, Cλ is lower, the optimal interval contains lower values of the detection probability in comparison with the case 1.
• For the case 3, intrusions probability has a high value. The optimal interval contains high values of the detection probability in comparison with the case 1 and the case 1.
b) Justifications
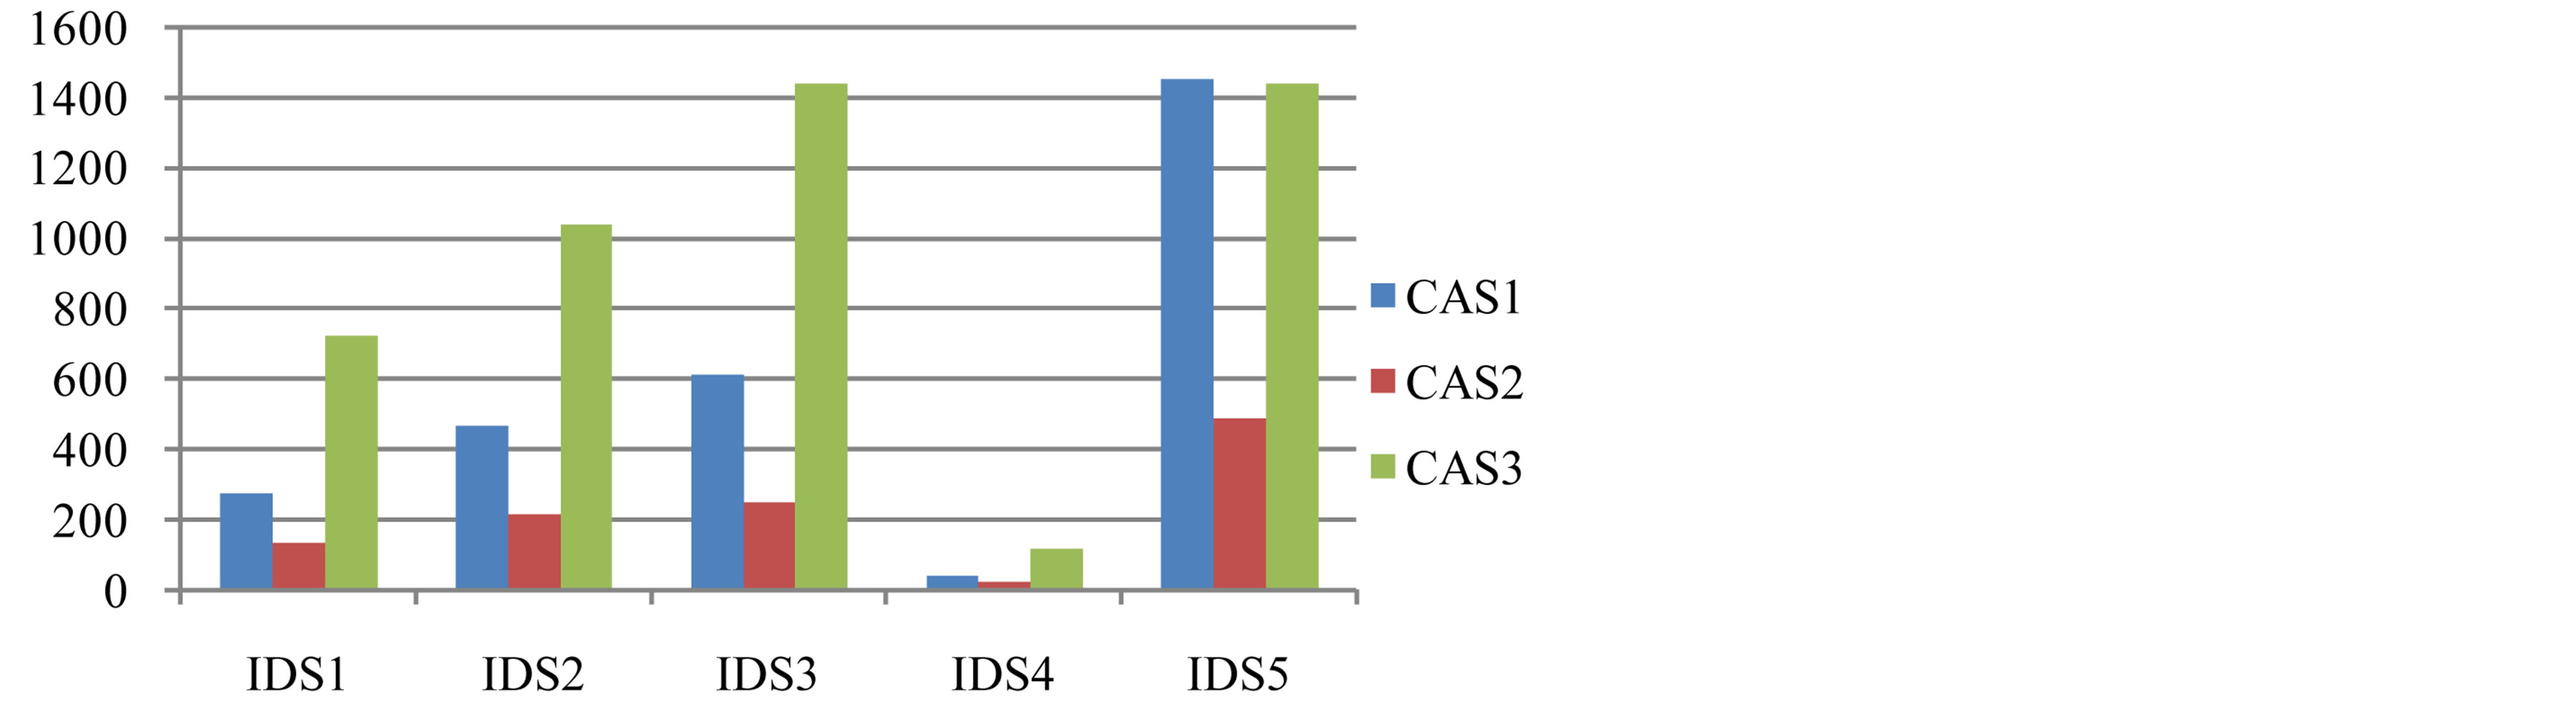
Figure 8. Comparison between the PMCR costs.
Table 9. Values of cost minimal point.
Table 10. Trade off interval for OPSR = 5%, 25% and 35%.
• The highest quality observed for the optimal interval is due to the excellent performance observed on the ROC curve of the IDS3.
• The minimum quality observed for the optimal interval is due to lower performance observed on the ROC curve of the IDS4.
• The absence of the notion of the optimal interval of IDS operating is due to the bad quality of the IDS5 observed on its ROC curve.
• The increasing of the OPSR, the optimal interval becomes wider. We gain new high values of detection probability, and it is beneficial, but in another side, we are penalized by the adding of low values of detection probability. In cost aspect, the IDS operation is tolerated according to a trade-off cost (Cc), calculated basing on a high value of OPSR rate.
• The decreasing of the OPSR, the optimal interval becomes narrowed. We lose new high values of detection probability, and it is unfavourable, but in another side, we have profit by the lost of low values of detection probability. In cost aspect, the IDS operation is tolerated according to a trade-off cost (Cc), calculated basing on a low value of OPSR rate.
• For the case 2, the probability of false positive and probability of detection have lower values to compensate for the problem of false positive and attain the PCMR.
• For the case 3, intrusions probability has a higher value. That generates the increasing of missed intrusions (damage cost). To have a countermeasure against this, the detection probability has increased to attain the PMCR with the minimum damage cost.
c) Results
• It is concluded that the optimal interval of IDS functioning depends mainly on the performance observed on the ROC curve of IDS, on the choice of OPSR rate, on the choice of the damage cost (Cλ) and the intrusions probability.
• It is concluded that the optimal interval of IDS functioning is a considered as a trade-off between the damage cost and the fp cost.
6. Conclusions
In this paper, we have proposed a new optimization cost model for IDS which lets the IDS works with minimum costs.
In simulation, we study three cases defined with the parameters (p, Cθ, Cλ, ρ, A, B) and five IDSs distinguished according to their qualities and their ROC curves. We have shown the impact of choice of Cλ and p on the minimization of the function f (1 − λ) = Min [(cost ratio (error)].
Our model proposed a minimal interval where the IDSs work optimally. In simulation, we have found that this interval is considered as a trade-off between the damage cost and the false positive cost.
In our future work, we will focus on the enhancing of the ROC dynamic choice impact on the optimal functioning interval for Intrusion Detection System.
References
- Denning, D. (1987) An Intrusion-Detection Model. IEEE Transactions on Software Engineering, SE-13, 222-232. http://dx.doi.org/10.1109/TSE.1987.232894
- Endorf, C., Schultz, E. and Mellander, J. (2004) Intrusion Detection & Prevention. McGraw-Hill/Osborne.
- Zanero, S. and Savaresi, S.M. (2004) Unsupervised Learning Techniques for an Intrusion Detection System. Proceedings of the 2004 ACM Symposium on Applied Computing, Nicosia, 14-17 March 2004.
- Ertoz, L., Eilertson, E., Lazarevic, A., Tan, P., Srivastava, J., Kumar, V. and Dokas, P. (2004) The MINDS—Minnesota Intrusion Detection System. Next Generation Data Mining, MIT Press.
- Gul, I. and Hussain, M. (2011) Distributed Cloud Intrusion Detection Model. International Journal of Advanced Science and Technology, 34, 71.
- Elshoush, H.T. and Osman, I.M. (2011) Alert Correlation in Collaborative Intelligent Intrusion Detection Systems—A Survey. Journal of Applied Soft Computing, 11, 4349-4365. http://dx.doi.org/10.1016/j.asoc.2010.12.004
- Anuar, N.B., Papadaki, M., Furnell, S. and Clarke, N. (2010) An Investigation and Survey of Response Options for Intrusion Response Systems. Information Security for South Africa, Sandton, 2-4 August 2010, 1-8.
- Shameli-Sendi, A., Ezzati-Jivan, N., Jabbarifar, M. and Dagenais, M. (2012) Intrusion Response Systems: Survey and Taxonomy. SIGMOD Record, 12, 1-14.
- Mu, C., Shuai, B. and Liu, H. (2010) Analysis of Response Factors in Intrusion Response Decision Making. 3rd International Joint Conference on Computational Science and Optimization, Huangshan, 28-31 May 2010, 395-399.
- Zonouz, S.A., Khurana, H., Sanders, W.H. and Yardley, T.M. (2009) RRE: A Game-Theoretic Intrusion Response and Recovery Engine. Proceedings of the IEEE/IFIP International Conference on Dependable Systems and Networks, Lisbon, 29 June-2 July 2009, 439-448.
- Zhou, M. and Yao, G. (2011) Improved Cost-Sensitive Model of Intrusion Response System Based on Clustering. International Conference in Electrics, Communication and Automatic Control Proceedings, 931-937.
- Svecs, I., Sarkar, T., Basu, S. and Wong, J. (2010) XIDR: A Dynamic Framework Utilizing Cross-Layer Intrusion Detection for Effective Response Deployment. IEEE 34th Annual Computer Software and Applications Conference Workshops, Seoul, 19-23 July 2010, 287-292.
- Stakhanova, N., Basu, S. and Wong, J. (2007) A Cost-Sensitive Model for Preemptive Intrusion Response Systems. Proceedings of the 21st International Conference on Advanced Networking and Applications, Niagara Falls, 21-23 May, 428-435.
- Strasburg, C., Stakhanova, N., Basu, S. and Wong, J.S. (2009) A Framework for Cost Sensitive Assessment of Intrusion Response Selection. Proceedings of IEEE Computer Software and Applications Conference, Seattle, 20-24 July 2009, 355-360.
- Stakhanova, N., Basu, S. and Wong, J. (2007) A Cost-Sensitive Model for Preemptive Intrusion Response Systems. Proceedings of the IEEE AINA, Niagara Falls, 21-23 May 2007, 428-435.
- Timm, K. (2009) Strategies to Reduce False Positives and False Negatives in NIDS. Security Focus Article. http://www.securityfocus.com/infocus/1463
- Victor, G.V., Sreenivasa, R.M. and Venkaiah, V.CH. (2010) Intrusion Detection Systems—Analysis and Containment of False Positives Alert. International Journal of Computer Applications, 5, 27-33.
- Lippmann, R., Fried, D.J., Graf, I., Haines, J.W., Kendall, K.R., McClung, D., Weber, D., Webster, S.H., Wyograd, D., Cunningham, R.K. and Zissman, M.A. (2000) Evaluating Intrusion Detection Systems: The 1998 DARPA Off-Line Intrusion Detection Evaluation. Proceedings of DARPA Information Survivability Conference and Exposition, Hilton Head, 25-27 January 2000, 12-26.
- Stolfo, S., Fan, W., Lee, W., Prodromidis, A. and Chan, P. (2000) Costbased Modeling for Fraud and Intrusion Detection: Results from the JAM Project. Proceedings of DARPA Information Survivability Conference and Exposition, Los Alamitos, 2, 130-144.
- Baayer, J. and Regragui, B. (2009) WOTIC’09—“Architecture Fonctionnelle d’un IPS, Etat de l’Art et Classification de Ses Systèmes de Réponse d’Intrusion (IRS)”. Université Ibn Zohr, Agadir.
- Swets, J.A. (1996) Signal Detection Theory and ROC Analysis in Psychology and Diagnostics: Collected Papers. Lawrence Erlbaum Associates, Mahwah.
- Foo, B., Wu, Y.-S., Mao, Y.-C., Bagchi, S. and Spafford, E.H. (2005) ADEPTS: Adaptive Intrusion Response Using Attack Graphs in an E-Commerce Environment. Proceedings of DSN, 28 June-1 July, 508-517.
- Toth, T. and Kregel, C. (2002) Evaluating the Impact of Automated Intrusion Response Mechanisms. Proceeding of the 18th Annual Computer Security Applications Conference, Los Alamitos, 301-310.
- Balepin, I., Maltsev, S., Rowe, J. and Levitt, K. (2003) Using Specification-Based Intrusion Detection for Automated Response. Proceedings of RAID, 2820, 136-154.
- Jahnke, M., Thul, C. and Martini, P. (2007) Graph Based Metrics for Intrusion Response Measures in Computer Networks. Proceedings of the IEEE LCN, Dublin, 15-18 October 2007, 1035-1042.
- Yu, S. and Rubo, Z. (2008) Automatic Intrusion Response System Based on Aggregation and Cost. International Conference on Information and Automation, Changsha, 20-23 June 2008, 1783-1786.
- Papadaki, M. and Furnell, S.M. (2006) Achieving Automated Intrusion Response: A Prototype Implementation. Information Management and Computer Security, 14, 235-251. http://dx.doi.org/10.1108/09685220610670396
- Haslum, K., Abraham, A. and Knapskog, S. (2007) DIPS: A Framework for Distributed Intrusion Prediction and Prevention Using Hidden Markov Models and Online Fuzzy Risk Assessment. 3rd International Symposium on Information Assurance and Security, Manchester, 29-31 August 2007, 183-188. http://dx.doi.org/10.1109/ISIAS.2007.4299772
- Mu, C.P. and Li, Y. (2010) An Intrusion Response Decision Making Model Based on Hierarchical Task Network Planning. Expert Systems with Applications, 37, 2465-2472. http://dx.doi.org/10.1016/j.eswa.2009.07.079
- Kanoun, W., Cuppens-Boulahia, N., Cuppens, F. and Dubus, S. (2010) Risk-Aware Framework for Activating and Deactivating Policy-Based Response. 4th International Conference on Network and System Security, Melbourne, 1-3 September 2010, 207-215.
- Kheir, N., Cuppens-Boulahia, N., Cuppens, F. and Debar, H. (2010) A Service Dependency Model for Cost Sensitive Intrusion Response. Proceedings of the 15th European Conference on Research in Computer Security, 6345, 626-642.
- Denning, D. (1999) Information Warfare and Security. Addison-Wesley.
- Northcutt, S. (1999) Intrusion Detection: An Analyst’s Handbook. New Riders Publishing.
- Lee, W., Fan, W., Millerand, M., Stolfo, S. and Zadok, E. (2002) Toward Cost-Sensitive Modeling for Intrusion Detection and Response. Journal of Computer Security, 10, 5-22.
- Tanachaiwiwat, S., Hwang, K. and Chen, Y. (2002) Adaptive Intrusion Response to Minimize Risk over Multiple Network Attacks. ACM Trans on Information and System Security.
- Durst, R., Champion, T., Witten, B., Miller, E. and Spag-nuolo, L. (1999) Testing and Evaluating Computer Intrusion Detection Systems. ACM, 42, 53-61. http://dx.doi.org/10.1145/306549.306571
- Saydjari, O.S. (2000) Designing a Metric for Effect. Presented at DARPA: IDS Evaluation Re-Think Meeting, Lake Geneva, 23-24 May.
- Stolfo, S., Fan, W., Lee, W., Prodromidis, A. and Chan, P. (2000) Costbased Modeling for Fraud and Intrusion Detection: Results from the JAM Project. Proceedings of DARPA Information Survivability Conference and Exposition, Los Alamitos, 2, 130-144.
- McHugh, J., Christie, A. and Allen, J. (2000) Defending Yourself: The Role of Intrusion Detection Systems. IEEE Software, 17, 42-51. http://dx.doi.org/10.1109/52.877859
- Graf, I., Lippmann, R., Cunningham, R., Fried, D., Kendall, K., Webster, S. and Zissman, M. (1998) Results of DARPA 1998 Off-Line Intrusion Detection Evaluation. Presented at DARPA PI Meeting, Cambridge, 15 December.
- (2012) Verizon Business Data Breach Investigations Report. http://www.verizonenterprise.com/DBIR/2013/
- Widup, S. (2010) The Leaking Vault—Five Years of Data Breaches. Digital Forensics Association.
- An Osterman Research White Paper (2011) Why You Need to Eliminate False Positives in Your Email System. http://www.ostermanresearch.com.