Materials Sciences and Applications
Vol.4 No.7A2(2013), Article ID:34833,9 pages DOI:10.4236/msa.2013.47A2001
Chemical and Morphological Surface Modification of Epoxy Based Thermosets
![]()
1Composite Materials Group, Institute of Materials Science and Technology, University of Mar del Plata and National Research Council, Mar del Plata, Argentina; 2Nanostructured Polymeric Materials Group, Institute of Materials Science and Technology, University of Mar del Plata and National Research Council, Mar del Plata, Argentina; 3Surfaces and Interfaces Laboratory, Federal University of Parana, Politécnico, Curitiba, Brazil.
Email: elisabeth@fi.mdp.edu.ar
Copyright © 2013 Marcela E. Penoff et al. This is an open access article distributed under the Creative Commons Attribution License, which permits unrestricted use, distribution, and reproduction in any medium, provided the original work is properly cited.
Received May 22nd, 2013; revised June 24th, 2013; accepted July 4th, 2013
Keywords: Fluoropolymer; Nanoparticles; Thermoset; Surface; Hydrophobic
ABSTRACT
Recently developed low fluorine containing polymers are advanced materials which confer advantageous properties to surfaces at a lower cost than conventional fluoropolymers (like PTFE), and are also more easily processable. Fluoropolymer surfaces are characterized by a low surface energy, high oleo and hydrophobicity, low coefficients of friction, among many other properties. This makes them desired materials in microelectronics, antifogging, antifouling and medical applications, to name a few. Fluorinated compounds are not easily coupled with macromolecules or common organic systems, and great efforts are made to compatibilize fluorinated species with hydrocarbon polymers. In this work, two chemical routes were explored in order to incorporate perfluorinated alkyl chains in an epoxy-amine based thermoset. On one side, a perfluoroalkyl thiolated molecule was used as a stabilizing ligand for silver nanoparticles, which were incorporated in the matrix polymer. On the other hand, fluorinated chains containing epoxy functionalities, were used as the matrix modifier. In the first case, fluorinated chains covering the nanoparticles, were mixed with the matrix, while in the second case, the fluoroalkyl chains were chemically linked to the network. Fluorine migration to the air—polymer interface was confirmed by X-Ray photoelectron spectroscopy (XPS). The materials hydrophobicity was then studied in terms of their contact angle with water (CA), as a function of the surface composition and the topography. Scanning electron microscopy (SEM) and atomic force microscopy (AFM), operated in moderate and light tapping modes, were used to morphologically describe the surfaces. An exhaustive surface analysis was made in order to explain the different hydrophobicity grades found.
1. Introduction
Cross-linked epoxies exhibit outstanding properties that have placed them as the standard option for a variety of applications such as adhesives, coatings, composites for structural applications, etc. Some of the reasons are the flexibility in the election of monomers and co-monomers enabling one to obtain a variety of products, from low Tg rubbers to high Tg materials, a very high adhesion to a variety of surfaces due to the polar groups present in the structure, the possibility of introducing different modifiers to generate optical properties, to increase toughness [1], or to make a functional polymer, for example, a self cleaning or low friction coating by the incorporation of low surface energy compounds [2-4].
In this sense, fluorine-containing materials are not only used as engineering plastics and high-tech elastomers, but also find considerable application in the coatings industry because of their interesting properties like water and oil repellency, low coefficient of friction, and chemical resistance. Fluorine-containing coatings can be based on thermoplastic or thermosetting binders. However, the synthesis and high costs of fluorinated bulk materials and the additional intrinsic processing problems have limited their application to niche segments of the market [5].
Fluorinated surfaces derive their characteristics from the unique molecular properties associated with the C-F bond that imparts a specific, unique chemistry and physics at interfaces. It is well known that the low surface free energy of a component provides a thermodynamic driving force for migration to the air-polymer interface.
In a perfluoroalkyl chain, the CF2 and CF3 groups would be the responsible of bringing the driving force for migration. The properties of fluorinated surfaces depend not only on the coverage of the surface by the fluorocarbons, but also on the degree of order in the surface [6,7]. Moreover, the roughness and, more generally the topography, play a role when defining a hydrophobic surface [8-11].
Different morphologies can be achieved and controlled varying polymers composition and processing. For example, Y. Funaki et al. [12] have found a variety of morphologies when used different solvents to obtain microphase-separated copolymers structures by casting, Valéry Rebizant and coworkers [13] controlled the morphology of expoy-amine networks modified with tetrablock copolymers, S. Ritzenthaler et al. [14] found a nanostructure in triblock-epoxy/diamine blends.
In this work epoxy-amine thermosets were modified with perfluoroalkyl chains by incorporating them in two different ways, i.e. as nanoparticles ligands and as a reactive oligomer. Both, chemical surface composition and topography where analyzed in order to explain the degrees of hydrophobicity originated.
2. Materials and Methods
2.1. Nanoparticles Synthesis
Silver nanoparticles (NPs) were synthesized employing a method previously described [15]. A thiolated fluorocarbon molecule, 1H,1H,2H,2H-perfluorodecanethiol from Aldrich, (C10H5F17S) was used as the stabilizing ligand. Water was deionized before use. An aqueous silver ion solution (AgNO3), an acetonic solution of phase transfer catalyst ((C8H17)4NBr) and an aqueous sodium borohydride solution (NaBH4), also from Aldrich, were used. Ag nanoparticles were precipitated in a water/acetone mixture, redispersed and centrifugated several times. Finally, the NPs were dispersed in acetone and analyzed.
2.2. Synthesis of Epoxy Thermosets Modified with Nanoparticles (FNPs)
The epoxy monomer was a diglycidyl ether of bisphenol A (DGEBA, DER 332, Dow, equivalent weight = 172.6 g/eq), and the curing agent was propyleneoxide diamine (Jeffamine D-230, Huntsman).
Defined volumes of the NPs dispersion were added to DGEBA (see Table 1). Then the acetone was removed from the mixture by heating under vacuum at 90˚C, overnight. The DGEBA containing Ag-NPs was reacted with Jeffamine in order to obtain thermoset plaques. The reaction was carried out in an oven using stoichiometric epoxy-amine ratios, following this curing cycle: first, 2 h at 100˚C, then the temperature was raised immediately and kept at 145˚C for 50 min.

Table 1. Composition and surface characterization.
2.3. Synthesis of Epoxy Thermoset Modified with a Fluorinated Oligomer (FEs)
The molecule used to obtain the fluorinated oligomer was 2,2,3,3,4,4,5,5,6,6,7,7,8,9,9,9-hexadecafluoro-8-(trifluoromethylnonyl)-oxirane (EPF-D3, Aldrich). In a first stage, EPF-D3 reacted with an excess of Jeffamine for 2 h at 100˚C in closed tubes. The amount of EPF-D3 used was given by the desired fluorine weight percentage in the final material (see Table 1), and the mass of Jeffamine necessary to obtain a stoichiometric epoxy-amino groups in the final product, was employed. The mixture of this reaction stage containing the fluorinated oligomer and unreacted Jeffamine, was added to DGEBA and the curing cycle described in the previous section was used to obtain the thermosets.
• 2.4. Characterization Techniques
• Glass transition temperatures (Tg) were determined by differential scanning calorimetry (DSC). A Shimadzu DSC-50 was used, operating under nitrogen flow. Measurements of Tg were conducted at a heating rate of 10˚C/min. It was taken as the temperature corresponding to the onset of heat capacity base-line change.
• Thermogravimetric analysis (Shimadzu TGA-50) was used in an air atmosphere at 10˚C/min in order to quantify the organic matter contained in the silver nanoparticles.
• A Ramé Hart model 500 Advanced Contact Angle Goniometer with DROP image Advanced Software was employed to determine the contact angles of epoxy thermoset flat plaques with water, using the sessile drop method.
• Ultraviolet-visible (UV-Vis) spectra were collected using an Agilent 8453 spectrophotometer. Measurements were performed at room temperature in a quartz cuvette.
• Transmission electron microscopy (TEM) was performed using a Philips CM-12 equip with an acceleration voltage of 100 kV.
• A Jeol JSM-6460LV microscope was used to obtain secondary and backscattered electrons in scanning electron microscopy (SEM). In order to coat the polymeric surface with a thin Au film, a Denton Vacuum Desk II metallization machine was employed.
• X-Ray Photoelectron spectra were taken using a commercial VG ESCA 3000 system. The base pressure in the experimental chamber was in the low 10−9 mbar range. The spectra were collected using Mg Ka (1253.6 eV) radiation and the overall energy resolution was about 0.8 eV. All spectra were collected at an angle of 45˚ with respect to the normal to the surface. Surface charging effects were compensated by referencing the binding energy (BE) to the C1s line of residual carbon set at 285 eV BE [16]. Sputtering of the sample surface was performed with an argon ion gun under an accelerating voltage of 3 kV.
• Atomic force microscopy measurements were performed using Agilent Technologies 5500 SPM equipment. The silicon probe employed (Nanosensors), had a tip radius of curvature, cantilever force constant and resonance frequency of 10 nm, 42 N/m and 330 kHz, respectively. The amplitude of the free oscillation (A0) and the set-point amplitude ratio, rsp = Asp/A0, where Asp is the set-point amplitude, were controlled during the experiments, in order to perform moderate and light tapping scans. These modes of operation generate a contrast inversion in phase images and sometimes in topography images, which allows the distinction between different hydrophilicity zones [17-20].
3. Surface Characterization
3.1. Nanoparticles Analysis
UV-Vis spectra revealed that a wide size distribution of spherical Ag nanoparticles had been obtained, while the TEM micrographs also showed a size distribution and agglomerates (see Figures 1(a) and (b)). The average size of NPs was 10 nm.
The TGA experiments were conducted in the presence of oxygen in order to determine the amount of organic matter in the NPs. The degradation residue was Ag0 and a 27 wt% of organic matter was found, which means that Ag/C atomic ratio in the NPs is 0.17. Two maxima in the mass derivative curve (see Figure 1(c)) confirm the fluorinated thiol adsorption in the silver nanoparticles. These results agree with the literature findings concerning the Ag0 residue (not a silver oxide) and the mass loss occurring between 180 and 330˚C, either gradually or by steps [21-23]. In the studied case, the adsorbed fluori-

Figure 1. NP’s characterization. (a) UV-Vis spectrum, (b) TEM micrographs, (c) mass derivative with respect to temperature, from TGA.
nated thiol molecules loss would occur by desorption of the fluorinated chains and the gradual and stepwise formation of fluorinated disulfides, due to their low volatility.
3.2. Surface Composition and Hydrophobicity
The neat and modified matrices were studied in terms of their hydrophobicity by measuring the contact angle with water. The surface elemental composition of modified thermosets was determined by XPS. The average F/C atomic ratio (F/Cav) was calculated in all cases from the nominal bulk composition, in order to determine the fluorine surface enrichment factor (FSE). FSE is defined as the experimental surface F/C ratio measured by XPS (F/Csurf), divided by the average bulk F/C (F/Cav).
In Table 1, the average and surface F/C atomic ratios are presented together with the FSE calculations and the CA measurements, for the different fluorinated polymers synthesized. The FSE follows a known tendency [24-27] with the average fluorine concentration, i.e. the lower the average fluorine content, the higher the FSE. In addition, a higher FSE was found for the FEs series, compared to the FNPs.
As it has already been discussed [26], there is a critical composition from which this decreasing tendency is observed, so that for very low fluorine bulk concentrations a lower FSE may be found. This is the case for FEa, which has the lowest F/Cav and the lowest FSE of its series. The presence of fluorinated groups in the surface would prevent the further fluorinated species migration to the surface, when the fluorine content in the bulk reaches a critical value [28].
The CA of the neat matrix was increased when fluorine was incorporated following any of the studied modifications. When the chemical composition of a surface is responsible of the hydrophobicity, a linear relationship is found between the CA and the measured F/Csurf ratio [27, 29,30]. When the plot of CA versus F/Csurf is not linear, not only the composition, but other effects play a rol in the surface hydrophobicity.
It is well known [31-33] that the topography can affect the CA. Figure 2 is a plot of the CA measurements against the experimental F/Csurf ratio, with the aim of comparing the neat (E, rhombus) and the modified polymers, FEs (squares) and FNPs (circles) hydrophobicity. The data legends (1 - 4, a - c) identify the samples presented in Table 1. A linear relationship between the CA and the F/Csurf ratio is found for the FEs series, indicating that the hydrophobicity is function of the surface composition. The fluorinated oligomer confers the water repellency even when very low fluorine contents are introduced in the polymer (0.05% to 0.2 wt% F). The low surface energy of the fluorinated compounds gives the driv-

Figure 2. Contact angles with water as a function of the F/Csurf atomic ratio measured by XPS.
ing force necessary to promote their natural migration to the air-polymer interface during the polymerization.
In contrast, the FNPs series shows a different behavior. While some samples enhance their water repellency when F/Csurf increases (FNP2 and FNP4), there are two other groups: FNP2 and FNP3 show the same CA but different F/Csurf ratio; FNP1, FNP3 and FNP4 show similar F/Csurf ratio, but different CA values. It is evident that the composition itself cannot explain these differences in hydrophobicity. In the next section, the analysis of the topographies will help to understand these findings.
3.3. Surface Morpholofy and Hydrophobicity
FNPs samples were studied by SEM in the backscattering mode, because atoms of higher atomic number, i.e., Ag atoms, look brighter. This way one can infer how Ag nanoparticles agglomerates are distributed in the samples surface. Figure 3 shows SEM micrographs of FNP2 (a) and FNP3 (b). At least two observations can be made from these images: first, the NPs are agglomerated in the microns scale; second, there are more NPs agglomerates in the FNP3 sample. The higher amount of NPs agglomerates would be responsible for the higher F/Csurf ratio in FNP3. When looking FNP2 and FNP3 with higher magnifcation (not shown), smaller NPs agglomerates appear, confirming what was found in TEM and UV-Vis experiments, i.e., the nanoparticles show a wide size agglomerates dispersion. It is also possible that bigger agglomerates form during polymerization [34]. In the case of FNP4 (c) the NPs agglomerates are more abundant, have a bigger size and look brighter.
Considering that a fluorinated alkyl thiolated chain was used as a stabilizing ligand, the presence of bigger

Figure 3. Backscattering SEM images of FNPs.
agglomerates would indicate that the stabilizer would not be present in such an amount as in the smaller ones. The bigger the agglomerates, the lower the stabilizer content. The fact that FNP4 had similar F/Csurf ratio than FNP3 is consistent with the idea of FNP4 having bigger agglomerates in a higher number, compensating the fluorinated ligand amount.
FNP1, FNP3 and FNP4 samples have the same type of modification, similar F/Csurf ratio, but different CA. Figure 4 shows FNP1 and FNP4 AFM topography (left) and phase (right) images. While FNP1 (upper left image) has a topography of a continuous flat surface with nanometric particles (bright points), FNP4 (third left mage) has a worm-like topography. This topography would be re-
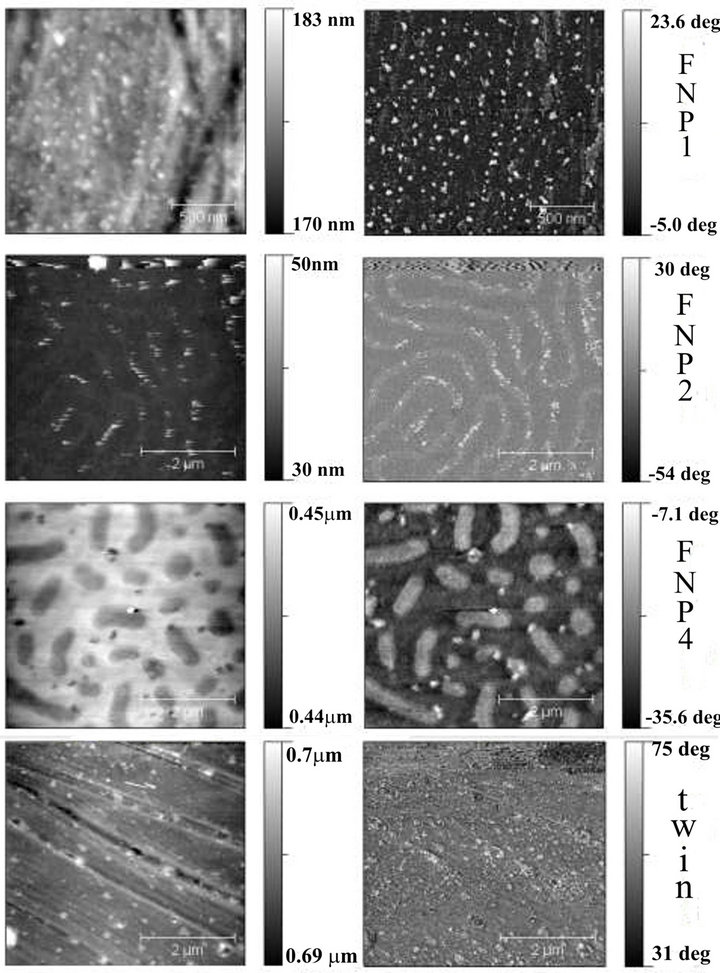
Figure 4. Topography (left) and Phase (right) AFM images of FNPs. Scans were taken in 5 m2 in moderate tapping conditions.
sponsible for the higher CA, which is consistent with a higher CA for FNP2 (second left image) compared to FNP1, where the former has a lower F/Csurf ratio, but a crease topography. Instead, FNP1 is a flat surface partially covered with NPs, and lower CA. FNP2 and FNP4 topographies are similar, in the sense that the first one has a continuous crease, and the second would show the same crease but cut into pieces. The crease topography found is probably caused by the solvent evaporation in the curing process [12,35-38]. Although acetone was removed from DGEBA before curing, some solvent may remain in the system and evaporate during the polymerization. DSC analysis sustains this hypothesis, as lower Tg were found for the FNPs (Tg = 70˚C) compared to the neat system prepared without solvents (Tg = 80˚C). Free surface crease or wrinkle topography resulting from polymer being processed by casting methods has been extensively reported [12-14,38]. Differences between FNP2 and FNP4 topographies may arise from the different solvent volumes added to the DGEBA.
When analyzing the AFM topography and phase images of the FEs series (see Figure 5), a different topography is detected. For the lowest fluorine content (FEa), a quite flat surface with a large number of 100 - 300 nm

Figure 5. Topography (left) and Phase (right) AFM images of FEs. The scan was taken in 10 μm2, except for FEa phase image, which is the zoom of its topography (dotted square) in 5 μm2. Topography was obtained in moderate tapping mode and phase, in light tapping mode, for the same scanned area.
phase separated domains, can be observed. The same topography with 50 - 200 nm separated domains, but now in a higher number, appears in FEb surface.
In FEc spherical 1 - 3 μm epoxy domains covered with 200 nm - 2 μm separated phases can be distinguished. This type of morphology has already been found by S. Ritzenthaler et al. when they studied a microphase separation in a triblock copolymer-epoxy mixture [14]. Here, AFM phase images were scanned using a light tapping mode, so that the darker regions are the more hydrophobic. This is consistent with the fluorine rich phase being separated from the matrix and covering the air-polymer interface, where it reduces the overall surface free energy.
The scheme shown in Figure 6 is a theoretical representation of the morphology evolution when fluorine content increases from 0.05% to 0.2 wt% in the FEs. First, small balls cover a bigger sphere (a), so that a panoramic of such a conformed surface would look like the FEa

Figure 6. Scheme of the FEs morphology with separated microphase domains.
topography image: balls follow parts of circumferences in different planes, circumferences being the contour of epoxy matrix spheres. When the amount of small balls increases, better defined circumferences can be distinguished (b). If balls content continues increasing, it allows them to be close enough to each other, that in a panoramic view they may look like undefined spots (c). Because the higher fluorinated compound concentration promotes the phase separation, FEc shows the epoxy spheres well distinguished and covered by the separated fluorine rich microphase.
The topography is not dramatically changed when the fluorine content varies up to 0.2 wt%, which explains the CA vs F/C relationship being proportional, i.e., only the fluorine concentration affects the hydrophobicity.
There is one more sample named “twin”, which is a combination of the two types of modifications studied. Apart from using the EPF-D3 in the same amount it would be used to obtain FEb, 3 ml/gDGEBA of the NPs dispersion were added to the system (the same than in FNP1). This modification resulted in the highest surface F/C ratio and highest CA. The topography is also a flat surface partially covered with NPs (see Figure 4, bottom, left). Taking into account that the twin sample is in part a FE series, it is quite below the straight line which defines the CA-F/Csurf linear relationship of the FEs. This is not surprising since a linear relationship between CA and F/Csurf may exist also for FNP series, if considering only the flat-NPs topography, and this linear dependence may have a different slope compared to the FEs. In this work, the F/Csurf influence in the FNP’s CAs has not been studied as an independent variable, because the processing method used to obtain increasing fluorine concentrations led to different topographies. It is also difficult to say if the F/Csurf ratio of the twin sample is higher than the value which could be obtained by only using EPF-D3 as a modifier, or on the contrary, mixing EPF-D3 and NPs enhances the FSE more than their separate contributions.
To prove that experimentally, higher fluorine contents should be used to prepare a FE, and that requires adding considerable amounts of a solvent to keep the solubility of the system. It is evident from this work, that incorporating solvents may probably change the topography and affect results in a different way.
To theoretically estimate if the F/Csurf ratio of the twin sample is achievable from a fluorine richer FE, FSE data could be employed: the product between the twin F/Cav and the corresponding FSE (available from extrapolated FE data), would result in the F/Csurf for that nominal fluorine concentration.
Although the experimental evidence is not conclusive, the “twin” sample behavior allows being optimistic about a fluorinated moieties and NP synergic effect.
Summarizing the results, the following observations can be highlighted:
• FEs show a single topography and a hydrophobicity linearly dependant on the F/Csurf ratio.
• The difference in the CA for the samples FNP1 and FNP2 is caused by the topography generated in the preparation process.
• The difference in the F/Csurf ratio in FNP2 and FNP3 is due to the higher surface density of NPs agglomerates.
• The CA similitude between FNP2 and FNP3 is given by the similar size of NPs agglomerates and similar topographic structure generated during processing.
• The difference between CAs of FNP1, FNP3 and FNP4 is a result of the size of the topographic creases generated during processing, and in the case of FNP4, also by the NPs agglomerates size.
4. Conclusions
Two chemical routes were explored to modify an epoxyamine thermoset: the incorporation of a reactive perfluoroalkyl chain containing molecule, chemically linked to the thermoset network, and the incorporation of silver nanoparticles covered with a perfluoroalkyl chain containing ligand. The first modification resulted in the more efficient chemical way for increasing the polymer hydrophobicity. Higher FSE, and higher CAs for the same F/Csurf ratio were found for the polymer modified with the reactive fluoroalkyl chain. Increasing the fluorine content up to 0.2 wt% did not affect the topography.
In the second case, although fluorinated alkyl chains were found to be adsorbed in the silver nanoparticles surface, NPs were hardly dispersed in acetone. A wide size distribution and agglomerates were obtained; NPs aggregation could have increased during polymerization. The method employed to vary the fluorine content in the modified polymer led to different topographies, causing the CA being dependant not only on the surface composition, but also on the topography. Different F/Csurf ratios were achieved, but the CA resulted more dependent on the topography.
When combining the two types of modifications, the values of CA, F/Csurf and FSE, resulted higher than the separate contributions of each modifier.
5. Acknowledgements
We acknowledge Dr. C. Hoppe for her help and guidelines in the nanoparticles synthesis.
REFERENCES
- J. P. Pascault and R. J. Williams, “Epoxy Polymers: New Materials and Innovations,” Wiley-VCH, Weinheim, 2010. doi:10.1002/9783527628704
- W. Brostowa, M. Duttaa and P. Rusek, “Modified Epoxy Coatings on Mild Steel: Tribology and Surface Energy,” European Polymer Journal, Vol. 46, No. 11, 2010, pp. 2181-2189. doi:10.1016/j.eurpolymj.2010.08.006
- W. Brostow, W. Chonkaewa, K. P. Menarda and T. W. Scharf, “Modification of an Epoxy Resin with a Fluoroepoxy Oligomer for Improved Mechanical and Tribological Properties,” Materials Science and Engineering, Vol. 507, No. 1-2, 2009, pp. 241-251. doi:10.1016/j.msea.2008.12.008
- W. Brostow, V. M. Castaño, G. Martinez-Barrera and D. Pietkiewicz, “Pressure − Volume − Temperature Properties of an Epoxy + Fluorinated Poly(aryl ether ketone) System,” Physica B: Condensed Matter, Vol. 344, No. 1-4, 2004, pp. 206-213. doi:10.1016/j.physb.2003.09.260
- R. D. van de Grampel, “Surfaces of Fluorinated Polymer Systems,” Ph.D. Thesis, Technische Universiteit Eindhoven, Eindhoven, 2002.
- S. C. Yoon and B. D. Ratner, “Surface Structure of Segmented Poly(ether urethanes) and Poly(ether urethane ureas) with Various Perfluoro Chain Extenders. An XRay Photoelectron Spectroscopic Investigation,” Macromolecules, Vol. 19, No. 4, 1986, pp. 1068-1079. doi:10.1021/ma00158a023
- S. C. Yoon and B. D. Ratner, “Surface and Bulk Structure of Segmented Poly(ether urethanes) with Perfluoro Chain Extenders. 2. FTIR, DSC, and X-Ray Photoelectron Spectroscopic Studies,” Macromolecules, Vol. 21, No. 8, 1988, pp. 2392-2400. doi:10.1021/ma00186a016
- R. N. Wenzel, “Surface Roughness and Contact Angle,” The Journal of Physical Chemistry, Vol. 53, No. 9, 1949, pp. 1466-1467. doi:10.1021/j150474a015
- M. Iwamatsu, “Contact Angle Hysteresis of Cylindrical Drops on Chemically Heterogeneous Striped Surfaces,” Journal of Colloid and Interface Science, Vol. 297, No. 2, 2006, pp. 772-777. doi:10.1016/j.jcis.2005.11.032
- E. Bormashenko, “General Equation Describing Wetting of Rough Surfaces,” Journal of Colloid and Interface Science, Vol. 360, No. 1, 2011, pp. 317-319. doi:10.1016/j.jcis.2011.04.051
- C. Della Volpe, D. Maniglio, M. Morra and S. Siboni, “The Determination of a ‘Stable-Equilibrium’ Contact Angle on Heterogeneous and Rough Surfaces,” Colloids and Surfaces, A: Physicochemical and Engineering Aspects, Vol. 206, No. 1-3, 2002, pp. 47-67. doi:10.1016/S0927-7757(02)00072-9
- Y. Funaki, K. Kumano, T. Nakao, H. Jinnai, H. Yoshida, K. Kimishima, K. Tsutsumi, Y. Hirokawa and T. Hashimoto “Influence of Casting Solvents on Microphase-Separated Structures of Poly(2-vinylpyridine)-block-polyisoprene,” Polymer, Vol. 40, No. 25, 1999, pp. 7147-7156. doi:10.1016/S0032-3861(99)00112-3
- V. Rebizant, V. Abetz, F. Tournilhac, F. Court and L. Leibler, “Reactive Tetrablock Copolymers Containing Glycidyl Methacrylate. Synthesis and Morphology Control in Epoxy-Amine Networks,” Macromolecules, Vol. 36, No. 26, 2003, pp. 9889-9896. doi:10.1021/ma0347565
- S. Ritzenthaler, F. Court, L. David, E. Girard-Reydet, L. Leibler and J. P. Pascault, “ABC Triblock Copolymers/ Epoxy-Diamine Blends. 1. Keys to Achiev Nanostructured Thermosets,” Macromolecules, Vol. 35, No. 16, 2002, pp. 6245-6254. doi:10.1021/ma0121868
- S. P. Shah, J. D. Holmes, R. Ch. Doty, K. P. Johnston and B. A. Korgel, “Steric Stabilization of Nanocrystals in Supercritical CO2 Using Fluorinated Ligands,” Journal of the American Chemical Society, Vol. 122, No. 22, 2000, pp. 4245-4246.
- B. S. Kim, H. Y. Jeong and B. K. Kim, “Surface Characterizations of Polyurethanes Having Different Types of Soft Segment,” Colloids and Surfaces A: Physicochemical and Engineering Aspects, Vol. 268, No. 1, 2005, pp. 60-67. doi:10.1016/j.colsurfa.2005.05.045
- M. E. Penoff, W. Schreiner, P. A. Oyanguren and P. E. Montemartini, “Fluorinated Polyurethanes: XPS and AFM Characterization,” Macromolecular Symposia, Vol. 321- 322, No. 1, 2012, pp. 186-190. doi:10.1002/masy.201251133
- S. John T. Van Noort, Kees. Van der Werf, Bart G. De Grooth, Niek F. Van Hulst and Jan Greve, “Height Anomalies in Tapping Mode Atomic Force Microscopy in Air Caused by Adhesion,” Ultramicroscopy, Vol. 69, No. 2, 1997, pp. I 17-I 27.
- R. Brandsch and G. Bar, “On the Factors Affecting the Contrast of Height and Phase Images in Tapping Mode Atomic Force Microscope,” Langmuir, Vol. 13, No. 24, 1997, pp. 6349-6353. doi:10.1021/la970822i
- I. Revenko, Y. Tang and J. P. Santerre, “Surface Structure of Polycarbonate Urethanes Visualized by Atomic Force Microscopy,” Surface Science, Vol. 491, No. 3, 2001, pp. 346-354. doi:10.1016/S0039-6028(01)01298-5
- A. Dass, R. Guo, J. B. Tracy, R. Balasubramanian, A. D. Douglas and R. W. Murray, “Gold Nanoparticles with Perfluorothiolate Ligands,” Langmuir, Vol. 24, No. 1, 2008, pp. 310-315. doi:10.1021/la702651y
- L. Mo, D. Liu, W. Li, L. Li, L. Wang and X. Zhou, “Effects of Dodecylamine and Dodecanethiol on the Conductive Properties of Nano-Ag Films,” Applied Surface Science, Vol. 257, No. 13, 2011, pp. 5746-5753. doi:10.1016/j.apsusc.2011.01.090
- I. Capek, “Preparation of Metal Nanoparticles in Waterin-Oil (w/o) Microemulsions,” Advances in Colloid and Interface Science, Vol. 110, No. 1-2, 2004, pp. 49-74. doi:10.1016/j.cis.2004.02.003
- Y. Yuan and M. S. Shoichet, “Surface Enrichment of Poly(trifluorovinyl ether)s in Polystyrene Blends,” Macromolecules, Vol. 33, No. 13, 2000, pp. 4926-4931. doi:10.1021/ma000147a
- Y. S. Kim, J. S. Lee, Q. Ji and J. E. McGrath, “Surface Properties of Fluorinated Oxetane Polyol Modified Polyurethane Block Copolymers,” Polymer, Vol. 43, No. 25, 2002, pp. 7161-7170. doi:10.1016/S0032-3861(02)00458-5
- W. Ming, L. van Ravenstein, R. van de Grampel, W. van Gennip, M. Krupers, H. Niemantsverdriet and R. van der Linde, “Low Surface Energy Polymeric Films from Partially Fluorinated Photocurable Solventless Liquid Oligoesters,” Polymer Bulletin, Vol. 47, No. 3-4, 2001, pp. 321-328. doi:10.1007/s289-001-8188-7
- R. D. van de Grampel, W. Ming, A. Gildenpfennig, W.J.H. van Gennip, M. J. Krupers, J. Laven, J.W. Niemantsverdriet, H. H. Brongersma and R. van der Linde, “Surface Studies of Partially Fluorinated Polymethacrylates: A Combined XPS and LEIS Analysis,” Progress in Organic Coatings, Vol. 45, No. 2-3, 2002, pp. 273-279. doi:10.1016/S0300-9440(02)00043-7
- A. Synytska, D. Appelhans, Z. G. Wang, F. Simon, F. Lehmann, M. Stamm and K. Grundke, “Perfluoroalkyl End-Functionalized Oligoesters: Correlation between Wettability and End-Group Segregation,” Macromolecules, Vol. 40, No. 2, 2007, pp. 297-305. doi:10.1021/ma061139i
- F. Levine, J. La Scala and W. Kosik, “Properties of Clear Polyurethane Films Modified with a Fluoropolymer Emulsion,” Progress in Organic Coatings, Vol. 69, No. 1, 2010, pp. 63-72. doi:10.1016/j.porgcoat.2010.05.006
- J. M. Deitzel, W. Kisik, S. H. McKnight, N. C. Beck Tan, J. M DeSimone and S. Crette, “Electrospining of Polymer Nanofibers with Specific Surface Chemistry,” Polymer, Vol. 43, No. 3, 2002, pp. 1025-1029. doi:10.1016/S0032-3861(01)00594-8
- L. Jiang, Y. Zhao and J. Zhai, “A Lotus-Leaf-like Superhydrophobic Surface: A Porous Microsphere/Nanofiber Composite Film Prepared by Electrohydrodynamics,” Angewandte Chemie International Edition, Vol. 43, No. 33, 2004, pp. 4338-4341. doi:10.1002/anie.200460333
- J. Zhang, J. Li and Y. Han, “Superhydrophobic PTFE Surfaces by Extension,” Macromolecular Rapid Communications, Vol. 25, No. 11, 2004, pp. 1105-1108. doi:10.1002/marc.200400065
- X. Lu, Ch. Zhang and Y. Han, “Low-Density Polyethylene Superhydrophobic Surface by Control of Its Crystallization Behavior,” Macromolecular Rapid Communications, Vol. 25, No. 18, 2004, pp. 1606-1610. doi:10.1002/marc.200400256
- A. Ledo-Suárez, J. Puig, I. A. Zucchi, C. E. Hoppe, M. L. Gómez, R. Zysler, C. Ramos, M. C. Marchi, S. A. Bilmes, M. Lazzari, M. A. López-Quintela and R. J. J. Williams, “Functional Nanocomposites Based on the Infusion or In Situ Generation of Nanoparticles into Amphiphilic Epoxy Gels,” Journal of Materials Chemistry, Vol. 20, No. 45, 2010, pp. 10135-10145. doi:10.1039/c0jm01421d
- M. S. Park and J. K. Kim, “Breath Figure Patterns Prepared by Spin Coating in a Dry Environment,” Langmuir, Vol. 20, No. 13, 2004, pp. 5347-5352. doi:10.1021/la035915g
- T. Nishikawa, R. Ookura, J. Nishida, K. Arai, J. Hayashi, N. Kurono, T. Sawadaishi, M. Hara and M. Shimomura, “Fabrication of Honeycomb Film of an Amphiphilic Copolymer at the Air-Water Interface,” Langmuir, Vol. 18, No. 15, 2002, pp. 5734-5740. doi:10.1021/la011451f
- F. Pilati, M. Montecchi, P. Fabbri, A. Synytskac, M. Messori, M. Toselli, K. Grundke and D. Pospiech, “Design of Surface Properties of PET Films: Effect of Fluorinated Block Copolymers,” Journal of Colloid and Interface Science, Vol. 315, No. 1, 2007, pp. 210-222. doi:10.1016/j.jcis.2007.06.046
- H. Hasegawa and T. Hashimotot, “Morphology of Block Copolymers and Mixtures of Block Copolymers at Free Surfaces,” Polymer, Vol. 33, No. 3, 1992, pp. 475-487. doi:10.1016/0032-3861(92)90722-9