Materials Sciences and Applications
Vol.4 No.3A(2013), Article ID:29565,11 pages DOI:10.4236/msa.2013.43A025
Probabilistic Analysis of Reinforced Concrete Carbonation Depth
![]()
1Ecole Nationale Supérieure des Travaux Publics, Cité Sidi Garidi Kouba, Algiers, Algeria; 2Camp Supprt Services Integrated, Paris, France; 3Université des Sciences et de la Technologie Houari Boumedienne, Laboratoire Bâti dans l’Environnement, Algiers, Algeria.
Email: *azharbadaoui@yahoo.fr
Received December 14th, 2012; revised January 15th, 2013; accepted February 12th, 2013
Keywords: Carbonation Depth; Lognormal Random Variable; Relative Humidity; Water/Cement Ratio; Carbonic Gas CO2
ABSTRACT
Concrete carbonation relates to the diffusion of CO2 in the atmosphere through the concrete pores and to the dissolution of the hydrates. A great deal of uncertainty still remains in this subject as a result of the random nature of the infiltration of these aggressive agents as well as the material and structural properties of reinforced concrete. Consequently, in order to determine the degradation of these structures with time, it is necessary to approach the subject from a probabilistic point of view that it considers the uncertainties involved with the geometrical dimensions of these structures, with the material characteristics and with the environment and the subsequent deterioration that it provokes. The aim of this paper is the evaluation of carbonation depth (Xc) from a probabilistic analysis, focusing specifically on the study of the randomness of the most influential parameters on the reinforced concrete carbonation.
1. Introduction
Durability is a key factor for any concrete structural design. Rebar corrosion is induced by carbonation and penetration of chlorides, or others aggressive agents, and the studies of corrosion in reinforced concrete structures require very large specimens due to the heterogeneous structure of the concrete [1].
Deterministic mathematical models of carbonation used a precise knowledge of the parameters requires a probabilistic approach enable to modeling the uncertainties and analyzing their dispersion effect [2].
In this paper, a probabilistic formulation is applied to carbonation phenomenon, and statistics integrates the influence of variation coefficient of relative humidity, water to cement ratio and carbonic gas pressure.
Monte Carlo simulations are realized under the assumption that the relative humidity, the Water/Cement ratio and the pressure of the carbonic gas on the surface of the concrete are random variables with a log-normal probability distribution.
2. The Carbonation Theory
Carbonation phenomenon is due to the calcium carbonates formation by reaction between cements (mainly the Portland) and atmospheric carbon dioxide (CO2) present in the air with an average rate of 0.03% in volume. This rate is more important in urban environment than in a rural environment [3].
This reaction involves the consumption of alkaline bases present in the interstitial solution of the concretes leading to a reduction in the pH from 13 to lower than 9, the corrosion of the reinforcements can be initiated by the carbonation reaching the reinforcement faces, and a steel depassivation occurs by the reduction in the pH around 9 [2]. From a chemical point of view this reaction arises as follows:
 (1)
(1)
The Figure 1 illustrates the combined intervention of three phases: gaseous, aqueous and solid during the process of Portland carbonation.
The flux equation that is given, called “Fick’s 1st law”, with CS as the concentration of carbon dioxide and  as the diffusion coefficient for CO2, is
 (2)
(2)
Here a minus (−) sign is missing; with a positive gradient in the x-direction, the flux will be opposite to that

Figure 1. Carbonation mechanism of Ca (OH)2.
direction. The mass balance equation, called Fick’s 2nd law, is given as
 (3)
(3)
This means that the mass balance equation only includes the gaseous carbon dioxide, with a concentration CS, but not the carbon dioxide that is “bound”, in the carbonate. A binding term is missing.
This equation is said to be “difficult to solve” and all sorts of complication are listed. In spite of this, the depth of carbonation Xc is then given by a simple formula
 (4)
(4)
This is the traditional carbonation model which, in fact, is not the solution to Fick’s 2nd law, at least not where more or less a carbonation “front” is expected.
The parameter k is not further explained, just taken as a parameter to be identified. The correct flux equation should be:
 (5)
(5)
And the mass balance equation should have a binding term that includes the drop in carbon dioxide concentration due to carbonation binding it in carbonates
 (6)
(6)
The diffusion coefficient is here placed inside the first derivation, which means that it may be non-constant with depth x due to moisture profiles and the reaction of carbonation is so fast that the process is diffusion rate-limited.
The mass balance equation must be solved numerically, if all aspects are to be considered. A simple solution with certain assumptions, see next section, is
 (7)
(7)
Meso-level models for carbonation are models that calculate the depth of carbonation with a more or less simple formula. The square-root of time model could be regarded as the most simple meso-level model, but it simply lacks input parameters, however.
The most developed meso-level model for carbonation is the Duracrete Carbonation model, where the depth of carbonation is described by this equation:
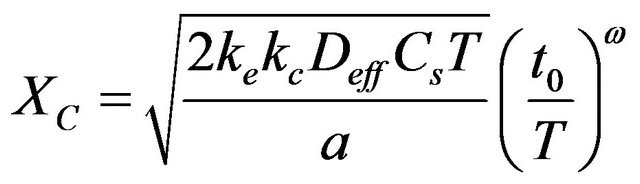 (8)
(8)
Compared to the simple square-root of time model, the Duracrete carbonation model has a number of features: the parameter in front of the square-root of time is quantified in terms of the diffusion coefficient , concentration CS of CO2 and amount a of carbon dioxide required to carbonate a unit volume.
A number of factors k is used to compensate for another climate, another test method and for another kind of curing. The square-root of time factor is multiplied by a time-factor with an age exponent w, being dependent on the environmental conditions.
All parameters were quantified in the Duracrete project [4].
Where  is the factor of environment, depending on the climatic conditions, and given by
 (9)
(9)
where  and
and  are the absolute and laboratory relative humidity, respectively.
 ,
, . The factor of environment is estimated at
 .
.
 is a parameter taking account of the conditions of curing compound concrete, given by:
 (10)
(10)
where  is the duration of cure,
  and
and 
 is the effective coefficient of diffusion of CO2
 (11)
(11)
ec is the porosity of the paste of the carbonated concrete depends on the composition of the concrete, given by the formulation.
Where ,
, .
.
Cs is the CO2 pressure on the surface of the concrete, Cs = 6.1 kg/m3.
T the expiry considers (year), t0 is the reference period (28 days), w is the meso-climatic factor w = 0.1.
 is the quantity of material carbonated given by:
 (12)
(12)
where:
•  is the degree of hydration of cement
 ;
;
•  translates the relation of the portland likely to react,
 ;
;
•  .
.
3. Probabilistic Analysis of Concrete Carbonation Depth
Carbonation is an important factor which affects reinforced concrete structures durability. Deterministic evaluation of the carbonation factors does not account on the randomness of the input parameters of the model. Consequently, the reliable behavior of reinforcement steel carbonation under random environment can’t proceed from deterministic approach and the resort to the probabilistic techniques enable modeling uncertainties by analyzing their dispersion.
This paper deals the randomness effect of the relative humidity (RH), Water/Cement ratio (W/C) and pressure of carbonic gas (Cs) on the carbonation phenomenon of the reinforced concrete. This analysis concentrates on the evaluation of carbonation depth (Xc) from a probabilistic analysis. These parameters are assumed as uncertain with a log-normal probability distribution. The parameters of the lognormal distribution of RH, W/C and Cs are expressed as follows
 (13a)
(13a)
 (13b)
(13b)
 (13c)
(13c)
where ,
,  and
and  are statistics (mean and variance) of RH, W/C and Cs, respectively [5].
In reality, one has to solve a conventional random problem for a large number of input parameters by using Monte Carlo simulations. 10,000 independent samples of the parameters RH, W/C and Cs with a log-normal distribution are generated, and the deterministic numerical procedure is applied to each individual simulation, providing 10,000 values of the depth and time carbonation parameters [6,7].
Finally, statistics of the depth and time factors (mean, standard deviation and confidence interval) are calculated.
In this study, the parameters governing the concrete carbonation are supposed to be a random variable with a log-normal distribution, which is suitable for strictly non-negative random variables with large values of coefficient of variation because in this case, simulations with normal distribution can give negative values.
4. Numerical Results and Discussion
4.1. Preliminaries
In the present section, we focus on investigating the carbonation process in a heterogeneous media, accounting for the variability of the relative humidity, water to cement ratio and carbonic gas pressure.
The mean values and the coefficients of variation of the different parameters were estimated from Model Code FIB (FIB 2006) proposals.
The relative humidity is assumed to be a log-normal random variable with a mean value of . It is known that below a relative humidity of 0.60 there is no more enough water, so that CO2 passes into solution and with a top of 0.70, the mechanism of total carbonation is limited by the diffusion of the ions carbonates in solution [3,4,6-8].
The coefficient of variation  varies from 0 (corresponding to the homogeneous case) to 10%. The mean value of the water to cement ratio is
  and the coefficient of variation
  varies between 0 and 0.5.
For the carbonic gas pressure, the mean value is  and its coefficient of variation
  also varies between 0 and 0.5 [9].
It is worth noting that carbonation statistics are evaluated from the study of 10,000 simulated samples, given the same number of values for the carbonation depth and time. In order to determine the depth and time carbonation.
The Chi-Square goodness of fit test is used to evaluate the fit of the assumed carbonation parameters probability distribution [10] and the shape of the corresponding histograms suggests a log-normal distribution, which is adopted in this study, Figure 2.
The behavior of the coefficient of variation of car-,


Carbonation depth (cm) Carbonation depth (cm)
(a) (b)


Carbonation depth (cm) Carbonation depth (cm)
(c) (d)
Figure 2. Probability density function of the carbonation depth versus E/C, Cs and HR. (a) Probability density function of the carbonation depth versus E/C; (b) Probability density function of the carbonation depth versus Cs; (c) Probability density function of the carbonation depth versus HR. (d) Probability density function of the carbonation depth versus E/C, Cs and HR.
bonation depth versus the number of realizations is also investigated, Figure 3.
As, the convergence of the final settlement coefficient of variation is observed for a number of realizations Nsamp around 300, this number is chosen equal to 10,000.
4.2. Carbonation Depth
The carbonation of the concrete starts at its surface and penetrates to a certain thickness known as carbonation depth, when the face of carbonation reaches the reinforcements, corrosion can begin. Statistics of the carbonation depth are evaluated for a time of one year. Mean and standard deviation (STD) are compared to the same parameters of the reinforcement cover to allow estimating the amount of depassivated steel [11].
The corrosion risk due to carbonation of concrete depends on the carbonation depth compared to the cover. This section concerns the analysis of the variation of the carbonation depth with relative humidity, water to cement ratio and carbonic gas pressure randomness.
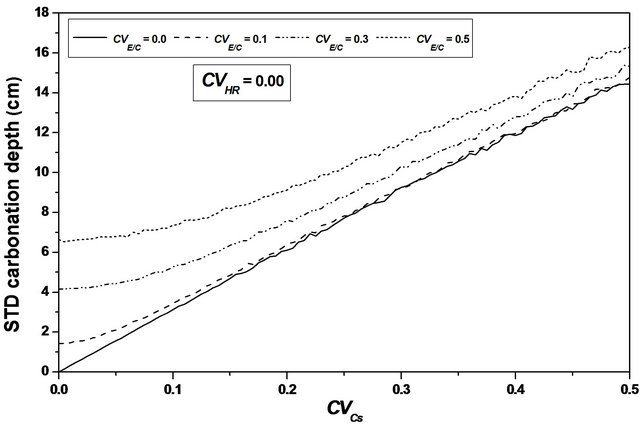
For an assumed log-normal distribution of W/C, and from the statistics (mean and standard deviation, as well as the 95% confidence interval) of the carbonation depth with respect to W/C coefficient of variation , it is shown that the mean value is constant for lower values of
 , it increases from 61 to 63 cm (3.28%) for higher ones, see Figure 4. One also notices that the standard deviation increases which indicates that W/C variability has a significant effect on the mean carbonation depth and influences strongly its dispersion, see Figure 5.
The progression of the carbonation front results mainly from movements of carbon dioxide and water present in the porous texture. More W/C is higher more the amount of free water susceptible to evaporate is important. Starting by drying or evaporation, the water leaves voids which facilitates the diffusion of carbon dioxide through the network of interconnected pores.
The carbonation kinetic is also affected by pore sizes

Figure 3. Carbonation depth coefficient of variation versus E/C, Cs and HR.
 (a)
(a) (b)
(b) (c)
(c)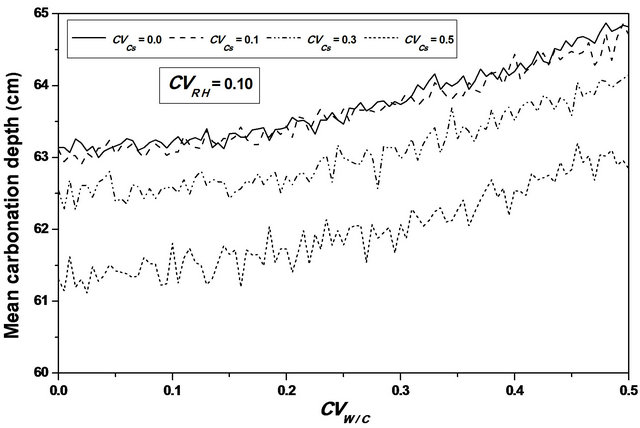 (d)
(d)
Figure 4. Carbonation depth statistics versus W/C coefficient of variation. (a), (c) Mean carbonation depth versus W/C coefficient of variation; (b), (d) STD carbonation depth versus W/C coefficient of variation.
the depth of carbonation tends to increase when the porosity of concrete increases.
Measures of mercury porosity (average pore diameter) realized after carbonation show that the solid products of carbonation enough to fill some pores, and taking into account the distribution of pore volumes (and not just the mean pore diameter) suggests that carbonation modifies complexly the pore structure of paste in concrete with the attenuation of certain porous modes and creating new modes and a statistical study of the pore size distribution becomes too complex [12].
In addition, if the correlation between the carbonation depth and porosity is not always clear, the carbonation is also dependent on the chemical composition of concrete
 (a)
(a) (b)
(b) (c)
(c) (d)
(d)
Figure 5. Carbonation depth statistics versus W/C coefficient of variation. (a), (c) Mean carbonation depth versus W/C coefficient of variation; (b), (d) STD carbonation depth versus W/C coefficient of variation.
and particularly the amount of Portland available.
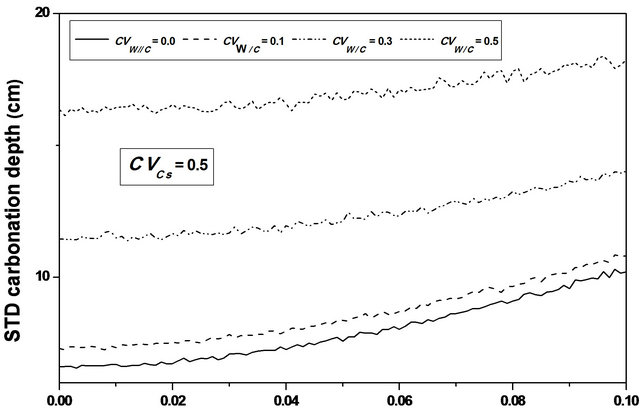
Varying  from 0.0 to 0.5, leads to a reduction in the mean carbonation depth from 65 to 63 cm (3.08%), see Figures 6 and 7.
A slight increase is observed for the standard deviation and the confidence interval remains constant for mean and standard deviation indicating that the variability of CO2 concentration does not affect the standard deviation precision, sees Figure 10.
The quantity of calcium carbonate is composed of two parts: the Calcium of (CH), (C3A.3Cs.H32) and (C3A. Cs.H12). The calcium is totally carbonated whatever the pressure of CO2. Carbonate quantity in the calcium silicate hydrates (CSH) depends on the degree of hydration of cement and the effective coefficient of diffusion of CO2 in carbonate zone.
These parameters are independent of the study material and are estimated carbonation test.
For  values ranging from 0.0 to 0.1, a stabilization of the mean value is observed, as indicating in Figures 8 and 9, and the confidence interval is appreciably constant, indicating that the relative humidity variability causes a significant variation of the carbonation depth mean variation around its average value, see Figure 10.
This remark indicates that the carbonation depth can reach significant value whereas its median value remains low.
The diffusion of atmospheric carbon dioxide through the porous structure of concrete is dependent on the state of hygroscopic pores of material.
According to Chaussadent [4], two types of penetration of carbon dioxide can exist: through the liquid phase with a transfer of water charged with carbon dioxide dissolved, or when the water is already present in the diffusion aqueous phase through the gas phase, i.e. the network contains more porous aqueous phase.
The speed of carbonation at 20˚C for traditional concrete is obtained for a relative humidity between 50% and 70% [8].
For low values of  corresponding a low relative humidity dispersion (below of 50%), the amount of water is insufficient to dissolve carbon dioxide.
For larger values of  (>70%), the structure of porous material is saturated with water, the diffusion process of carbon dioxide to the surface of mineral reagents is extremely low. The diffusion coefficient of carbon dioxide in liquid phase is 104 fold lower than in gaseous form [3].
The volumetric parameters used to compare the diffusion with the reaction rate are porosity ec and rate or degree of pore saturation S, these parameters are empirically related to the coefficient of diffusion.
The gas diffusion is important in a porous concrete and the gas fraction available for transfer of CO2 is indeed
 (a)
(a) (b)
(b) (c)
(c)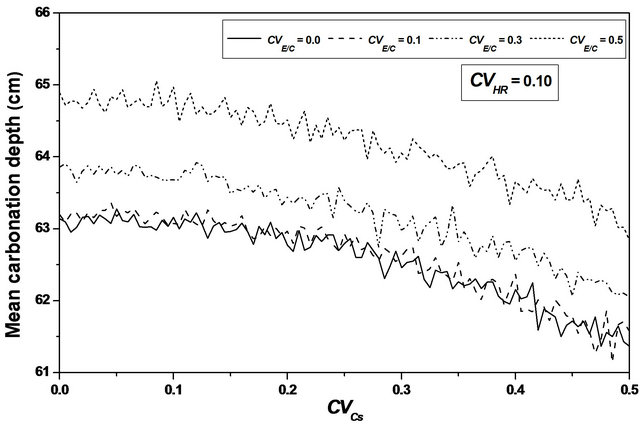 (d)
(d)
Figure 6. Carbonation depth statistics versus Cs coefficient of variation. (a), (c) Mean carbonation depth versus Cs coefficient of variation; (b), (d) STD carbonation depth versus Cs coefficient of variation.


(a) (b)


CVCs CVCs
(c) (d)
Figure 7. Carbonation depth statistics versus Cs coefficient of variation. (a), (c) Mean carbonation depth versus Cs coefficient of variation; (b), (d) STD carbonation depth versus Cs coefficient of variation.


CVRH CVRH
(a) (b)

CVRH CVRH
(c) (d)
Figure 8. Carbonation depth statistics versus RH coefficient of variation. (a), (c) Mean carbonation depth versus RH coefficient of variation; (b), (d) STD carbonation depth versus RH coefficient of variation.
 (a)
(a) (b)
(b) (c)
(c)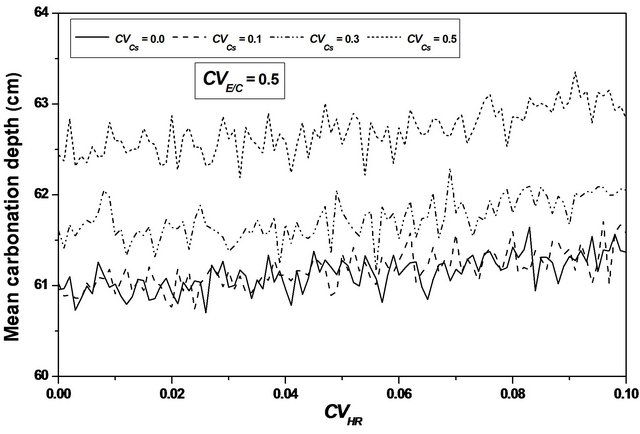 (d)
(d)
Figure 9. Carbonation depth statistics versus RH coefficient of variation. (a), (c) Mean carbonation depth versus RH coefficient of variation; (b), (d) STD carbonation depth versus RH coefficient of variation.
ec(1-S), and if the material is saturated S = 1, the CO2 diffusion impossible that through the interstitial solution which lows the progression of carbonation, conversely if the saturation level is too low S ® 0, the dissolution of CO2 is very limited and the carbonation kinetic is very slow.
The confidence interval for the mean and the standard deviation is substantially constant with important values; see Figure 10.
Taking into account the uncertainty on the three parameters instantly, allows to obtain confidence intervals defined. The confidence intervals obtained by considering the uncertainties of the three parameters simultaneously, are appreciably constant. We can conclude that heterogeneity of the three parameters act in opposition.
5. Conclusions
The present paper deals with the effect of the water to cement ratio, the relative humidity and the pressure of the carbonic gas randomness on the carbonation depth.
The water to cement ratio variability influences mainly the dispersion of the carbonation depth, but slightly the median value. Statistics values of the carbonation time are independent of the W/C coefficient of variation. Indeed, this parameter has an important influence on the interconnection of the porous network, and consequently on the permeability of the concrete and the diffusivity of CO2 within it.
Carbonic gas concentration variability effect on the carbonation depth is weak; this parameter can be assumed as deterministic for carbonation depth determination to decrease the computation time during a probabilistic treatment.
Strong variation interval of the mean carbonation depth around its average value is observed with relative humidity variability, indicating that the carbonation depth can reach significant value whereas its median value remains low.
The confidence interval for the mean and the standard deviation increases when one parameter is considered a random variable and it is substantially constant with im-


CVW/C CVW/C
(a) (b)
 (c)
(c) (d)
(d) (e)
(e) (f)
(f)
Figure 10. Carbonation depth statistics and confidence intervals versus W/C, Cs and RH coefficient of variation. (a) Mean carbonation depth versus Cs coefficient of variation; (b) STD carbonation depth versus Cs coefficient of variation; (c) Mean carbonation depth versus Cs coefficient of variation; (d) STD carbonation depth versus Cs coefficient of variation; (e) Mean carbonation depth versus RH coefficient of variation; (f) STD carbonation depth versus RH coefficient of variation.
portant values in the case where the three parameters are considered random variables.
Taking into account the uncertainty on the three parameters instantly, allows to obtain confidence intervals defined.
REFERENCES
- H. Böhni, “Corrosion in Reinforced Concrete Structures,” CRC Press, Boca Raton, 2005.
- F. Deby, “Probabilistic Approach to the Durability of Concrete in Marine Environment,” Doctoral Thesis, University of Toulouse, Toulouse, 2008.
- E. Roziere, “Study of the Durability of Concrete with a Performance,” Doctoral Thesis, University of Nantes, Nantes, 2007.
- Duracrete, “Statistical Quantification of the Variables in the Limit Stat Functions,” Contract BRPR-CT95-0132, Project BE95-1347, The EU-Brite EuRam III, January 2000.
- E. V. Volpe and D. Baganoff, “Maximum Entropy Pdfs and the Moment Problem under Near-Gaussian Conditions,” Probabilistic Engineering Mechanics, Vol. 18, No. 1, 2003, pp. 17-29. doi:10.1016/S0266-8920(02)00038-3
- M. Badaoui, M. K. Berrah and A. Mébarki, “Soil Height Randomness Influence on Seismic Response: Case of an Algiers Site,” Computers and Geotechnics, Vol. 36, No. 1-2, 2009, pp. 102-112. doi:10.1016/j.compgeo.2008.04.001
- M. Badaoui, M. K. Berrah and A. Mébarki, “Depth to Bedrock Randomness Effect on the Design Spectra in the City of Algiers (Algeria),” Engineering Structures, Vol. 32, No. 2, 2010, pp. 590-599. doi:10.1016/j.engstruct.2009.11.005
- J. Cowie and F. P. Glasser, “The Reaction between Cement and Natural Waters Containing Dissolved Carbon Dioxide,” Advances in Cement Research, Vol. 4, No. 15, 1992, 119-134. doi:10.1680/adcr.1992.4.15.119
- FIB, “Model Code for Service Life Design,” Task Group 5.6, February 2006.
- A. H. S. Ang and W. H. Tang, “Probability Concepts in Engineering Planning and Design,” John Wiley & Sons, Hoboken, 2005.
- F. Kharchi and A. Badaoui, “Reinforced Concrete in Arid and Aggressive Conditions,” CANMET/ACI International Conference, Thessalonica, 2003.
- V. Baroghel, “Microstructural and Hydric Characterization of Cement Pastes, Ordinary Concrete and Very High Performance,” Doctoral Thesis, École des Ponts ParisTech, Paris, 1994.
NOTES
*Corresponding author.