Materials Sciences and Applications
Vol.3 No.3(2012), Article ID:18054,8 pages DOI:10.4236/msa.2012.33021
Through-Thickness Thermal Conductivity Prediction Study on Nanocomposites and Multiscale Composites
![]()
1Florida State University, High-Performance Materials Institute, Tallahassee, USA; 2National High Fields Magnetic Laboratory, Tallahassee, USA.
Email: mmzimmer@gmail.com
Received January 4th, 2012; revised February 2nd, 2012; accepted March 5th, 2012
Keywords: Thermal Conductivity; Micromechanical Models; Finite Element Models; Nanocomposites; Multiscale Composites; Carbon Nanotubes
ABSTRACT
In this research, a modeling and experimental study was conducted to explore the effects of nanoparticle type (aluminum nanoparticles and carbon nanotubes), filler concentration and interactions between the nanoparticle and reinforcing fibers on through-thickness conductivity of nanoparticle/epoxy nanocomposites and nanoparticle/fiber-reinforced multiscale composites. Multiple, notable micromechanical models were evaluated to predict through-thickness thermal conductivity of both composite systems, and then compared to the experimental results. The results showed that filler volume fraction ranges and thermal conductivity differences of the constituent materials for the thermal conductivity ratio (km/kf or kf/km) used in the models can affect the resulting predictions. Certain models were found to be suitable for varying conditions on the thermal conductivity ratio. Finite element models (FEM) were developed to reveal heat transport mechanisms of the resultant nanocomposites and multiscale composites. The nanocomposite design for finite element analysis (FEA) provided close predictions and performed better than the micromechanical models. On the multiscale composite system, predictions were concluded to be dependent upon the FEM design where the interactions between nanoparticles and fibers are critical to accurately determine the through-thickness thermal conductivity.
1. Introduction
Composites can be placed under the following categories: metal matrix composites (MMCs), ceramic matrix composites (CMCs), carbon-carbon composites (CCCs) and polymer matrix composites (PMCs) [1]. MMCs and CCCs demonstrate great propensity to have high thermal conductivity in both in-plane and through-thickness directions. CMCs and PMCs have the lowest thermally conductive values in the through-thickness direction, specifically but can produce high mechanical values [1]. In the area of thermal management, it would be ideal to take advantage of the lightweight and mechanical strength properties of PMCs. However, their low thermal conductivity creates disadvantages. Improving the through-thickness thermal conductivity of PMCs would increase its value for use in thermal management applications [2].
Constituent matrix materials in PMCs, the polymeric resins, such as epoxy resin, have a low thermal conductivity of around 0.2 W/mK [3,4] because the throughthickness heat transport is largely dominated by resin matrices due to composite laminate structures. This correlates to lower through-thickness thermal conductivity since resin works as an insulator due to its stable chemical bonding, composition and structure [3]. The electron orbits are filled making strong covalent bonds. The elements used in the molecular chains are not conductors and semiconductors. Instead, resins are made of non-conducting elements such as oxygen, nitrogen and hydrogen [3].
To increase the thermal conductivity of PMCs, high conductive fillers and reinforcing materials can compensate for the low thermal conductivity of the matrix. Nano-metallic fillers can be used to compensate for the low thermal conductivity of the matrix [5-10]. Singlewalled carbon nanotubes (SWNTs), multi-walled carbon nanotubes (MWNTs) and vapor-grown carbon nanofibers (VCNFs) are being used as fillers for developing thermal conductive resins [11-13]. PAN and pitch-based carbon fibers are typical reinforcing materials in PMCs, having a thermal conductivity range between 15 - 1100 W/mK in the direction of the fiber axis [14]. Particularly, pitchbased carbon fibers range from 120 - 1100 W/mK [3,14]. However, in the through-thickness direction, the thermal conductivity of the carbon fiber-reinforced composite is no more than 1 W/mK due to the laminate structure [15].
This research investigates the thermal conductivity improvements of epoxy resin using carbon nanotubes (CNTs) and aluminum nanoparticles (AlNPs) at high loadings. AlNP enhanced resin is combined with IM7 (HexTowTM IM7 HS-CP-5000 plain woven fabric) and EWC-300X (ThermalGraph® Fabric EWC-300X, 8 Harness Satin) carbon fibers to make multiscale composite systems to improve the through-thickness properties. Additionally, this research uses multiple micromechanical models and finite element analysis to understand the resultant thermal property improvements. An objective is to reveal the effectiveness of various models for thermal conductivity predictions and explore the reasons behind the effectiveness or ineffectiveness of the models used.
2. Experimentation
2.1. Micromechanical Models
Table 1 shows the micromechanical models widely used for through-thickness thermal conductivity predictions of composites [16-19]. This research uses each model to predict the conductivity of the AlNPs, CNTs and multiscale composite samples based on their constituent materials properties. The prediction results were compared to the measured value of the samples to evaluate the effecttiveness of each model. The following notations are universal for each model.
Notations:
K = Composite through-thickness thermal conductivity;
kf = Fiber thermal conductivity;
km = Matrix thermal conductivity;
vf = Fiber volume fraction;
vm = Matrix volume fraction.
2.2. Nanoparticle/Epoxy Nanocomposite
Epoxy nanocomposites samples were made using SWNTs obtained from Thomas Swan, MWNT from Sigma-Aldrich, and 150 nm diameter AlNP from Sigma-Aldrich. Epon 862 (Shell Chemical Company) and the SWNTs and MWNTs were mixed at 1%, 2%, 5%, 10%, 15% and 23% volume fraction through sonication and three-roll milling mixing machine at the Florida State University

Table 1. Micromechanical models.
High-Performance Materials Institute (HPMI) [20]. Due to the lower aspect ratio of the AlNPs, the AlNPs were able to be mixed with Epon 862 at 20%, 30%, 40% and 50% weight fractions [20].
Each sample was cured at 177˚C for 2 hours and made into a 10 × 10 mm squares to be tested at room temperature in a Netzsch LFA 457 laser flash system for thermal diffusivity measurements. With TA Instrument Q100 differential scanning calorimetry (DSC), the specific heat (Cp) values of the samples were measured. Gathering the diffusivity (α) results along with the measured density (ρ) and Cp, using Equation (1), the thermal conductivity (K) of the samples was calculated.
 (1)
(1)
2.3. AlNP Multiscale Composites
The Epon 862/AlNP epoxy nanocomposites at the respective weight fractions were applied to make multiscale composites with two types of carbon fibers: IM7 carbon fiber (HexTowTM HS-CP-5000 plain woven fabric) and EWC-300X (ThermalGraph® Fabric 8 Harness Satin) with roughly a 60% fiber volume fraction [20]. IM7, being a PAN-based carbon fiber, has a low thermal conductivity of 15 W/mK [13]. EWC-300X is pitch-based carbon fiber with high thermal conductivity rated at 300 W/mK. The samples underwent the same curing process and were cut into 10 × 10 mm squares to conduct thermal conductivity tests.
Calculating the through-thickness conductivity of the resultant multiscale composite using the micromechanical models required two steps. The combined AlNP and epoxy nanocomposites were considered as the matrix material. The carbon fiber reinforcements were the other constituent material. The measured AlNP/epoxy material thermal conductivity value was used as the value for km (matrix), and the thermal conductivity of the fiber as kf (fiber) was used for the models to predict thermal properties.
2.4. Finite Element Modeling
A representative unit was needed to create a functioning model of the multiscale composite for use in COMSOL Multiphysics. Figure 1 shows the representative unit created based on 60% fiber volume fraction correlating to the size ratio with fibers at 5 microns diameter in a 13 micron space dimension. The AlNPs used in the experiment were 150 nm spheres, which were large enough to incorporate them in the unit representative model to provide an accurate multiscale composite system. Figure 1 shows the model design used for 20%, 30%, 40% and 50% weight fraction of AlNP that correlates to 4%, 6%, 9% and 12% volume fraction respectively distributed randomly in the multiscale composite. Figure 2 shows the represented unit of AlNP/epoxy nanocomposites of a 1 µm × 1 µm dimension representative unit with the AlNP having a 150 nm diameter size for 20%, 30%, 40% and 50% weight fractions.
The models were steady state and since the heat transport equation is second order in space, two boundary conditions were specified as known parameters. In Figure 3, two temperature conditions were set represented as T1 and T0.
The insulated surfaces prevented convection and maintained a constant temperature gradient. The direction of heat transfer was perpendicular to lines of constant temperature. With prescribed constant temperatures, the heat flux can be calculated by integrating the entire T0 surface formulated in Equation (2) [21].
 (2)
(2)
Then, using Fourier’s law, determination of the thermal

Figure 1. FEM of AlNP/carbon fiber multiscale composites with different AlNP loadings: (a) 20 wt% (b) 30 wt% (c) 40 wt% and (d) 50 wt%.
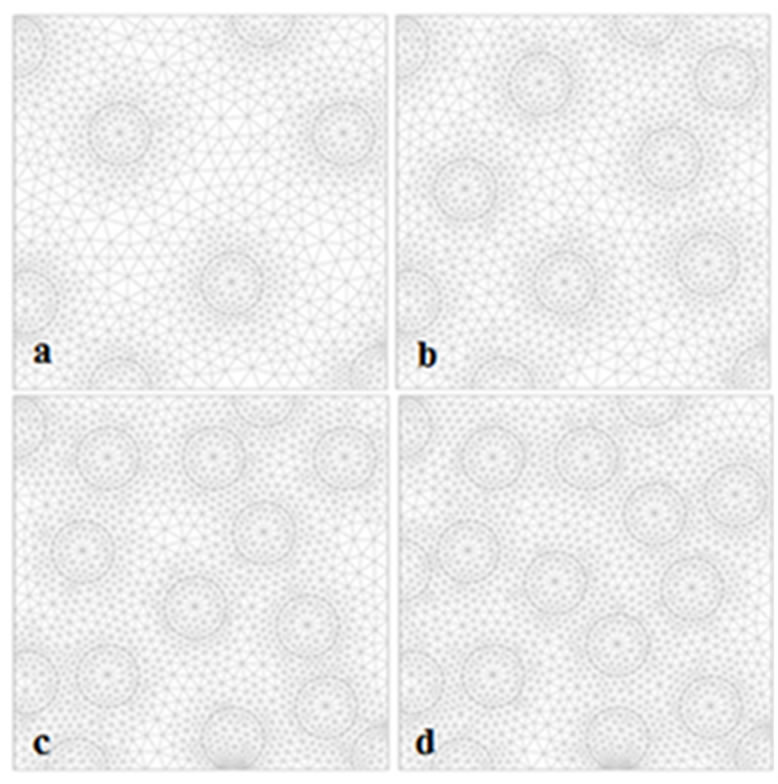
Figure 2. FEM of AlNP/Epoxy nanocomposites with different AlNP loadings: (a) 20 wt% (b) 30 wt% (c) 40 wt% and (d) 50 wt%.
conductivity (K) of the medium was made using the calculated heat flux (Q) and knowledge of the temperature distribution (T) across the distance (x) of a medium represented by Equation (3) [21,22].
 (3)
(3)
3. Results
3.1. Nanoparticle/Epoxy Nanocomposites
The results from the micromechanical models and the experiment were compiled for the SWNTs, MWNTs and AlNPs epoxy nanocomposites shown in Figures 4 and 5. The results for the parallel model are not presented in the graph due to its extreme overestimation. In no case did the parallel model come close to predicting the thermal conductivity of fillers in an epoxy matrix. The values inputted for kf for the fillers were: 6000 W/mK for SWNTs [23,24], 3000 W/mK for MWNTs [25] and 210
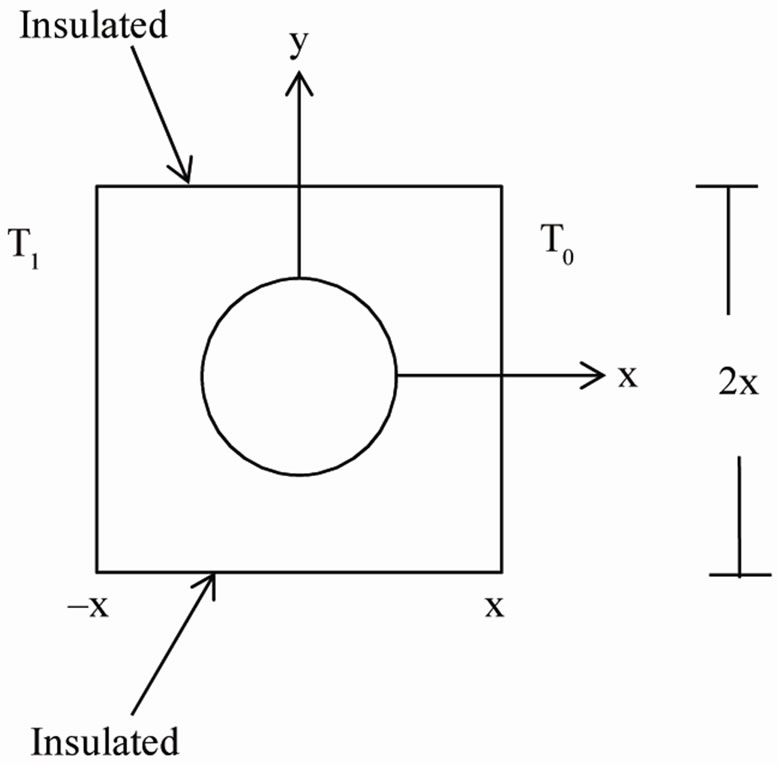
Figure 3. Illustrated conditions for model setup.

Figure 4. Thermal conductivity results for SWNT/Epoxy nanocomposites.
W/mK for AlNPs [26], which exceeded the km for the epoxy resin, which may lead to errors or off balancing of the km/kf term in the models.
For the results on the SWNT and MWNT nanocomposite samples shown in Figures 5 and 6, the Rayleigh model formula showed no change in the thermal conductivity across all volume fractions based on the high thermal conductivity values for the SWNTs and MWNTs, which affected the γ value with the km/kf ratio. The remaining models did not come close to the predictions. These models have a thermal conductivity value ratio, dividing the thermal value of the fiber by the matrix value or vice versa, which results in the models not being sensitive due to the extreme ratios. The formulations using the CNTs’ thermal conductivity greatly offset the
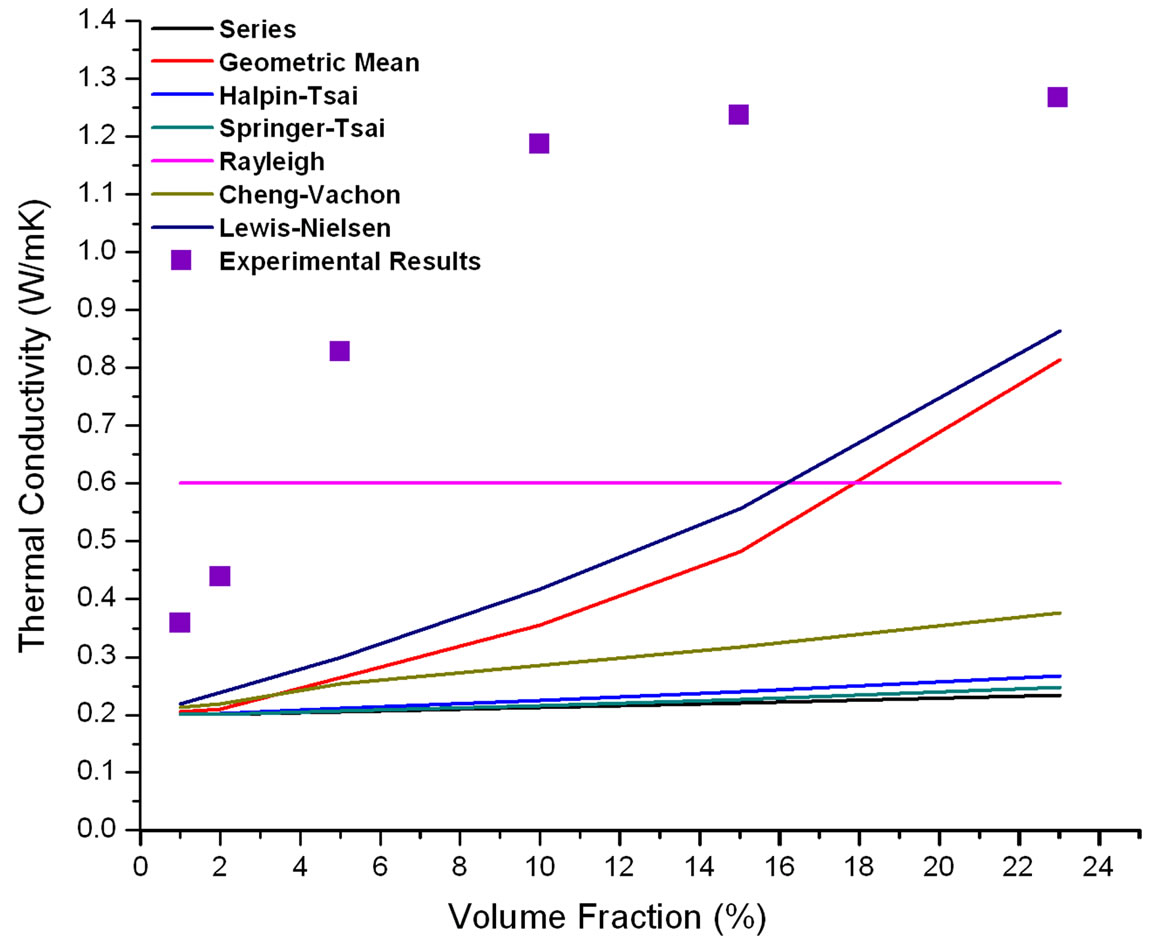
Figure 5. Thermal conductivity results for MWNT/Epoxy nanocomposites.

Figure 6. Lewis-Nielsen model for SWNT and MWNT with changes to A parameter.
predictions and underestimated the results. For all models, the thermal conductivity prediction trend did not follow in the same manner. As more CNTs were loaded into the epoxy, the experimental curve started to plateau as it reached a saturation point. If the micromechanical models continued to have increased volume fraction, the thermal conductivity would continue to increase. Perhaps only the Geometric Mean and Lewis-Nielsen models would provide reasonable results at volume fractions less than 20% to 30% for ultra-high thermal conductivity of the fillers.
The Lewis-Nielsen model considers the aspect ratio of the filler. For CNTs, the aspect ratio is enormous compared to the A value listed in Table 1. However, the A parameter could be altered for a better convergence in the predictions to the experimental results. Figure 6 shows the results of the Lewis-Nielsen model as A was changed to 10 for SWNTs and 14 for MWNs. The graph only speculates that the new A values would prove a better fit at the point of 23% volume fraction, but at lower volume fractions still falls short for a close approximation. Only perhaps at higher volume fractions could the LewisNielsen model provide good predictions with the changes to A.
The modeling results of the AlNP/epoxy composites were far more accurate than that of the CNTs except for those of the Geometric Mean shown in Figure 7. The Lewis-Nielsen, Rayleigh and Halpin-Tsai models upheld the predictions very well as they were designed to apply for spherical inclusions or some obstacle. The models were more congruent to the experimental results on two possible counts. One reason can be largely due to the higher volume fractions used for the AlNP. Second, the thermal conductivity of the AlNP was more reasonable for the models with moderate thermal conductivity ratios (kf/km or km/kf).

Figure 7. Thermal conductivity results for AlNP/Epoxy nanocomposites.
Comparing the results for each type of fillers, the thermal conductivity value and the volume fraction of the materials seemed to greatly affect how the predictions compared to the experimental results. For all models, the CNTs could be considered as short fibers due to their shape but have completely different thermal conductivity and physical values normal to that of conventional metal, graphite and carbon fibers. This feature could lead to large errors or be invalid in the models, particularly empirical or semi-empirical models. CNTs could not be generalized for such models, but must have a specific model designed around the CNTs as Bagchi and Nomura have demonstrated [27]. It can also be seen that all these nanoscale fillers are not very effective in enhancing the overall thermal conductivity values due to their discontinuous distribution, which is not able to provide effective phonon transport paths in the materials.
3.2. AlNP Multiscale Composites
The through-thickness thermal conductivity of AlNP/ IM7 and AlNP/EWC-300X multiscale composites was studied. IM7 carbon fiber, with a thermal conductivity of 15 W/mK, provided fairly good predictions with the Halpin-Tsai, Springer-Tsai, Rayleigh, and Lewis-Nielsen models, as shown in Figure 8. Perhaps the low thermal conductivity value of the fiber formulated in the models provided a means for closer predictions. No one model can be said to be better than the other.
As shown in Figure 9, the multiscale composite using EWC-300X carbon fiber, with a thermal conductivity of 300 W/mK, produced different predictions, unlike those of the IM7 carbon fiber. Only the Cheng-Vachon model proved to provide good predictions. The results of the Cheng-Vachon were highly sensitive to the volume fraction

Figure 8. Thermal conductivity of IM7/AlNP epoxy multiscale composites.
of the fiber.
The only reasonable explanation for the results changing in the modeling with the EWC-300X fiber compared to the IM7 fiber is the large thermal conductivity difference between fibers and nanocomposites. The question arises why the Lewis-Nielsen model did not provide a close prediction. The answer is in the parameter value of A. From Table 2, the A parameter was given a value of 0.5 for a uniaxially orientated fiber noted for the heat flow in transverse to fiber direction. If the A parameter was higher in value, then the model would converge closer to the experimental results. Therefore, this would seem to show that the Lewis-Nielsen model works better for lower fiber thermal conductivity. The Cheng-Vachon model can be better for higher thermal conductive fillers and fibers of at least 300 W/mK but not ultra-high values as for the CNTs in this study.
3.3. AlNP Multiscale Composites and Conductive Resins Finite Element Modeling
Figures 10 and 11 show the results of the experimental

Figure 9. Thermal conductivity of EWC-600X/AlNP epoxy multiscale composites.

Table 2. Shape factors for parameter A [19].

Figure 10. AlNP multiscale composites FEM thermal conductivity results vs. experimental results.

Figure 11. AlNP/Epoxy nanocomposite FEM thermal conductivity results vs. experimental results.
values compared to the FEM modeling results for the AlNP multiscale composite and the AlNP/epoxy nanocomposite case. The FEM results provided excellent predictions to the AlNP/IM7/epoxy multiscale composites. The method of using volume fraction ratios in the design instead of designing a system on exact size ratio differences proved to function very well in this case.
However, the modeling results for the EWC-300X multiscale composites resulted in less accuracy. Knowing that the design of the model affects the prediction could be the contributing factor that affects how the heat flow is distributed into the system. For instance, the design does not account for possible fiber filament contact where a large thermal transport would take place for high conductive materials. An alternate model design is necessary to account for higher conductive fibers or be more sensitive to the heat flux involved with the fillers when contact properties are significant.
The FEM analysis for the AlNP/epoxy nanocomposites provided excellent results in comparison to the micromechanical models. The system design used in COMSOL created a very adequate representation of the experimental systems.
4. Conclusions
The micromechanical models of composite thermal conductivities are dependent upon the thermal conductive values or ratios and the volume fraction of the constituent materials in the system. The experiments showed that each model produced varying predictions based on the inputs used. Nearly all models performed better when the volume fraction of the filler was greater than 20% and had a small thermal conductivity ratio between the nanofiller and matrix. No one model can be used for thermal predictions across any composite system within acceptable error margins. The use of models for predicting CNTs/epoxy nanocomposites was not adequate due to the extreme thermal conductivity differences between the fillers and matrix, and the low volume fraction content of the CNTs. Only the Lewis-Nielsen and Geometric Mean model could provide a reasonable trend of the thermal conductivity predictions in this study.
The issues involved with the CNT systems were not present with the AlNP nanocomposite where the models had better predictions. The Lewis-Nielsen and Rayleigh models provided the closest results. The Cheng-Vachon model considers spherical inclusions unlike the Rayleigh model. However, the difference is that the Cheng-Vachon model is designed to model a parabolic distribution of the fillers, whereas the Rayleigh model is a square array of obstacles. Interestingly, the multiscale composites with the AlNP and carbon fibers showed how the change in thermal conductivity of the filler can affect the modeling outcomes. It seems evident that the ChengVachon model is more suited for higher conductive fillers. Despite the experiment giving possible parameters for which micromechanical models to be used, the models can be considered unreliable at best. Only finite element modeling proved to be the effective means for accurate predictions of all systems studied. This accuracy would largely be dependent on the appropriate model design to cover actual microstructure features and heat flux flow of the composites, limiting conductivity ratio effects. It would require more extensive research work with experimental results to validate that each model design provides adequate tools for thermal conductivity predictions of nanofiller-based composites.
5. Acknowledgements
I would like thank all the researchers and advising staff at the High-Performance Materials Institute, especially to the co-authors for their continuous support, time and knowledge.
REFERENCES
- C. Zweben, “Thermal Materials Solve Power Electronics Challenges,” Power Electronics Technology, No. 2, 2006, pp. 40-47.
- K. Stevens, “AFRL/MLBC Thermal Management Workshop,” Wright Patterson Air Force Base, Greene, 2005.
- W. D. Callister Jr., “Materials Science and Engineering,” 6th edition, John Wiley & Sons Inc., Hoboken, 2003.
- H. He, F. Fu, Y. Shen, Y. Han and X. Song, “Preparations and Properties of Si3N4/PS Composites Used for Electronic Packaging,” Composites Science and Technology, Vol. 67, No. 11-12, 2007, pp. 2493-2499. doi:10.1016/j.compscitech.2006.12.014
- D. D. L. Chung, “Materials for Thermal Conduction,” Applied Thermal Engineering, Vol. 21, No. 16, 2001, pp. 1593-1605. doi:10.1016/S1359-4311(01)00042-4
- Epoxies Etc., 2005. http://www.epoxies.com
- B. Weidenfeller, M. Hofer and F. R. Schilling, “Thermal Conductivity, Thermal Diffusivity, and Specific Heat Capacity of Particle Filled Polypropylene,” Composites Part A: Applied Science and Manufacturing, Vol. 35, No. 4, 2004, pp. 423-429. doi:10.1016/j.compositesa.2003.11.005
- F. Danes, B. Garnier and T. Dupuis, “Predicting, Measuring, and Tailoring the Transverse Thermal Conductivity of Composites from Polymer Matrix and Metal Filler,” International Journal of Thermophysics, Vol. 24, No. 3, 2003, pp. 771-784. doi:10.1023/A:1024096401779
- G.-W. Lee, M. Park, J. Kim, J. I. Lee and H. G. Yoon, “Enhanced Thermal Conductivity of Polymer Composites Filled with Hybrid Filler,” Composites Part A: Applied Science and Manufacturing, Vol. 37, No. 5, 2005, pp. 727-734. doi:10.1016/j.compositesa.2005.07.006
- Y. Xu, D. D. L. Chung and C. Mroz, “Thermally Conducting Aluminum Nitride Polymer-Matrix Composites,” Composites Part A: Applied Science and Manufacturing, Vol. 32, No. 12, 2001, pp. 1749-1757. doi:10.1016/S1359-835X(01)00023-9
- M. J. Biercuk, M. C. Llaguno, M. Radosavljevic, J. K. Hyun and A. T. Johnson, “Carbon Nanotube Composites for Thermal Management,” Applied Physics Letters, Vol. 80, No. 15, 2002, pp. 2767-2769. doi:10.1063/1.1469696
- S. A. Gordeye, F. J. Macedo, J. A. Ferrerira, F. W. J. van Hattum and C. A. Bernardo, “Transport Properties of Polymer-Vapor Grown Carbon Fiber Composites,” Physica B: Condensed Matter, Vol. 279, No. 1-3, 2000, pp. 33-36. doi:10.1016/S0921-4526(99)00660-2
- H. O. Pierson, “Hand book of Carbon, Graphite, Diamond and fullerenes Properties, Processing and applications,” William Andrew Publishing, Noyes, 1993.
- P. K. Mallick, “Fiber-Reinforced Composites—Materials, Manufacturing, and Design,” 2nd edition, Marcel Dekker Inc., New York, 1993.
- E. P. Scott and J. V. Beck, “Estimation of Thermal Properties in Epoxy Matrix/Carbon Fiber Composite Materials,” Journal of Composite Materials, Vol. 26, No. 1, 1992, pp. 132-149. doi:10.1177/002199839202600109
- I. H. Tavman and H. Akinci, “Transverse Thermal Conductivity of Fiber Reinforced Polymer Composites,” International Communications in Heat and Mass Transfer, Vol. 27, No. 2, 2000, pp. 253-261. doi:10.1016/S0735-1933(00)00106-8
- J. C. Halpin and J. L. Kardos, “The Halpin-Tsai Equations: A Review,” Polymer Engineering and Science, Vol. 16, No. 5, 1976, pp. 344-352. doi:10.1002/pen.760160512
- G. S. Springer and S. W. Tsai, “Thermal Conductivity of Unidirectional Materials,” Journal of Composte Materials, Vol. 1, No. 2, 1967, pp. 166-173. doi:10.1177/002199836700100206
- S. C. Cheng and R. I. Vachon, “The prediction of the Thermal Conductivity of Two Andthree Phase Solid Heterogeneous Mixtures,” International Journal of Heat & Mass Transfer, Vol. 12, No. 3, 1969, pp. 249-264. doi:10.1016/0017-9310(69)90009-X
- M. Zimmer, “Thermal Management Composites Utilizing Carbon Nanotubes and High-Conducting Carbon Fibers: Design, Fabrication and Characterization,” Ph.D. Thesis, Florida State University, Tallahassee, 2009.
- Md. R. Islam and A. Pramila, “Thermal Conductivity of Fiber Reinforced Composites by FEM,” Journal of Composite Materials, Vol. 33, No. 18, 1999, pp. 1699-1715. doi:10.1177/002199839903301803
- Wolfram Mathworld, “Fourier’s Law,” 2009. http://mathworld.wolfram.com
- K. Berber and D. Tomanek, “Unusually High Thermal Conductivity of Carbon Nanotubes,” Physical Review Letters, Vol. 84, No. 20, 2000, pp. 4613-4616. doi:10.1103/PhysRevLett.84.4613
- J. Hone, M. Whitney, C. Piskoti and A. Zettl, “Thermal Conductivity of Single-Walled Carbon Nanotubes,” Physical Review B, Vol. 59, No. 4, 1999, pp. 2514-2516. doi:10.1103/PhysRevB.59.R2514
- P. Kim, L. Shi, A. Majumdar and P. L. McEuen, “Thermal Transport Measurements of Individual Multiwalled Nanotubes,” Physical Review Letters, Vol. 87, No. 21, 2001, Article ID: 215502. doi:10.1103/PhysRevLett.87.215502
- G. S. Brady, H. R. Clauser, “Materials Handbook,” 13th edition, McGraw-Hill Inc., New York, 1991.
- A. Bagchi and S. Nomura, “On the Effective Thermal Conductivity of Carbon Nanotube Reinforced Polymer Composites,” Composite Science and Technology, Vol. 66, No. 11-12, 2006, pp. 1703-1712. doi:10.1016/j.compscitech.2005.11.003