Journal of Environmental Protection
Vol. 3 No. 9 (2012) , Article ID: 22637 , 10 pages DOI:10.4236/jep.2012.39113
Modelling Visible Foliar Injury Effects on Canopy Photosynthesis and Potential Crop Yield Losses Resulting from Fluoride Exposure
![]()
School of Agriculture and Food Sciences, The University of Queensland, Brisbane, Australia.
Email: d.doley@uq.edu.au
Received June 26th, 2012; revised July 20th, 2012; accepted August 18th, 2012
Keywords: Photosynthesis Model; Oil Palm; Airborne Fluoride; Foliar Injury; Crop Production Loss
ABSTRACT
Crop production models are highly developed to account for different nitrogen, light, temperature and water availability conditions and, in some species, disease or air pollutant effects. There is very limited knowledge on responses of many tropical crops, such as oil palm (Elaeis guineensis), to air pollutants although predictions of these effects are essential for industrial planning in several countries. In the absence of limitations due to water supply, the effects of leaf area loss due to necrosis and chlorosis are much more important to canopy photosynthesis than are changes in the physiological attributes that influence the efficiency of light use. Therefore, potential losses of crop production due to air pollutants such as fluoride can be inferred usefully from the extent of visible injury to foliage that may be associated with different levels of pollutant exposure.
1. Introduction
The effects of environmental or physiological stresses on dry matter production in plants are difficult to determine precisely without extensive experimentation. Many detailed studies have been carried out on the responses of important crop and forest species to air pollutants and these have been critical to the development of environmental standards, especially for the temperate environments of northern Europe [1].
In contrast, dose-response relationships for the effects of major pollutants on crop plants are scarce in regions of the world undergoing industrialisation, particularly tropical countries [2,3]. Where growth responses to pollutants have been measured, it is common to find large differences in the quantitative responses between species. As a result, general dose-response functions for a collection of species may not be precise enough to predict either the response of an individual species [4] or actual yield loss on a regional scale in developing countries [5]. Pollutant responses of vegetation in tropical countries are more commonly reported in terms of visible injury to foliage [6-13]. Consequently, while dose-response functions obtained from studies in the temperate Northern Hemisphere can lead to suitably conservative air quality goals in tropical countries [5], they leave unresolved the prediction of growth or yield responses of species for which there is no prior experimental evidence. However, a refusal to predict the possible effects of pollutant exposure may not be socially acceptable and the precautionary principle that all species are extremely sensitive to any pollutant may not be appropriate. This paper examines how the extent of visible foliar injury may be used to indicate possible losses of crop dry matter production or harvestable product, using oil palm (Elaeis guineensis) exposed to airborne fluoride as a case study.
Crop Characteristics of Oil Palm
Oil palm cultivation is a large and expanding industry, managed as intensive monocultures on large estates in low-lying humid equatorial regions [14,15]. In the most favourable environments, crops can be dense, with a leaf area index (LAI) in 10- to 30-year-old plantations of 6 m2·m–2 [14,16]. In an equatorial climate, leaf production in the oil palm is continuous, often at intervals of 18 days and leaves may persist for 20 months [14]. Consequently, the oldest leaves in the uppermost LAI layer of the canopy will be exposed to full sunlight for about 85 days. The lowest shaded leaves are removed in the process of harvesting fruit bunches. Leaf duration is important in affecting both the level of physiological activity and the opportunity for uptake of air pollutants. Leaf and leaflet arrangements are not random, but the average leaflet orientation is slightly erect so that light penetrates into the canopy.
Physiological characteristics of oil palm are summarised in Table 1. The C3 photosynthetic pathway means that photosynthesis in individual leaves becomes light saturated at approximately half of full sunlight (1000 μmol·quanta·m–2·s–1) [16] but canopy photosynthesis and fruit yield per tree are closely related to the total light energy intercepted by the tree [17] (Figure 1).
Oil palm photosynthesis and crop production are sensitive to atmospheric and soil water deficits [16,18-21], but these stresses will not be considered further here.
If the effect of foliar injury is to reduce the photosynthetic capacity of the canopy in direct proportion to the leaf area injured, there should be a proportional reduction in fruit yield. Such a relationship would make the prediction of the effects of air pollutants on crop yield a simple matter, but this may not always be the case.
2. Visible Injury and Impact on Plant Function
Many reviewers, e.g., [3,22,23] have concluded that air pollutants may reduce plant growth in the absence of visible injury as a result of asymptomatic biochemical and physiological effects. However, while asymptomatic growth effects occur in species recognised as tolerant to a pollutant such as fluoride, this condition is not universal [24]. It is important to know whether asymptomatic yield reductions are likely to accompany exposure of oil palm, which may be assumed to be sensitive to an accumulateing air pollutant such as fluoride.
Accurate prediction of the effects of environmental stresses on crop yield may be impossible without direct experimental evidence, but empirical physiological and growth models allow estimates to be made of the relative rates of photosynthesis or crop growth under different stress scenarios. In addition, it is possible to compare the effects of changes in different environmental or physiological factors and thereby to identify those most likely to affect crop production.
When air pollutants have an immediate impact on physiological processes, other environmental conditions are often critical to the expression of effects. For example, high light and conditions conducive to wide stomatal

Table 1. Crop and plant variables used in calculation of oil palm canopy photosynthesis.

Figure 1. Relationship between bunch dry weight (Wb) in oil palm and short wave radiation intercepted (Ii) by oil palm tree canopies at different sites in Malaysia. Redrawn from [17].
opening exacerbate the effects of ozone [25,26]. Transient conditions may be less critical in determining the responses of plants when environmental stresses result in developmental changes, such as chlorosis and necrosis of leaves and when toxicity is associated with progressive accumulation of a pollutant. Fluoride is known to result in both chlorosis and necrosis in a wide range of plant species and in the absence of unusually high ambient concentrations fluoride is not associated with the sudden onset of extensive foliar injury [27]. Instead, fluoride sensitive species commonly exhibit chlorosis or necrosis of the extremities (tips or margins) of leaves while plant growth may not be measurably impaired [24]. Therefore, it is appropriate to examine potential effects of fluoride on crop production of oil palm in terms of the relative effects of fluoride on the functioning and growth of the species by the application of physiological and growth models.
3. Photosynthetic Models
The responses of the rate of photosynthesis to variations in environmental factors can be described in terms of the biochemical processes of electron transport and carbon dioxide fixation [27], or carbon dioxide assimilation by leaves and plant canopies [16,28,29], or by dry matter accumulation at the crop level [30,31]. The modelling approaches differ in the way in which this conversion is expressed, and the interactions with other processes that are incorporated into the energy conversion coefficient. At the whole plant canopy level, the interception and conversion of light energy is critical and harvestable yield in oil palm can be related directly to whole plant light interception for plants of different size under different growing conditions (Figure 1). This direct approach is satisfactory where the processes within the plant respond in consistent ways to plant and environmental conditions, but this constancy cannot be assumed in the presence of stress factors [20].
The biochemical model provides fundamental information about the condition of the electron transport and carboxylation enzyme systems in leaves. When stomatal conditions can be determined, it can be applied to comprehensive models of leaf or canopy gas exchange [32] and, for example, the prediction of ozone effects on photosynthesis and leaf duration in wheat [33].
In spite of the theoretical superiority of the biochemical model and because detailed biochemical and physiological information is lacking for many crop species, empirical leaf and canopy models still provide satisfactory empirical predictions of the relative effects of environmental factors on crop yield or forest production [29, 31,34,35]. Where variations in plant condition or soil or atmospheric water deficits [16,17,20] may influence carbon dioxide assimilation and dry matter production, it is necessary to extend the model beyond the effects of the factors considered in Table 1.
Hyperbolic equations are commonly used to describe the light response of canopy photosynthesis because they incorporate an initial slope that describes the relative efficiency (a) of conversion of incident quanta (I) to net assimilated carbon dioxide (Anet) and they allow for the saturation of the light reaction and the identification of a maximum rate of assimilation (Amax) and dark respiration of the leaf (Rd). In contrast to the rectangular hyperbola, the non-rectangular form [28,36] (Equation (1)) incorporates a coefficient (T) that allows for variation in the shape of the light response curve for leaves exposed at different levels in a plant canopy without the need to assume fundamental differences in their functioning.
 (1)
(1)
3.1. Variation in Physiological Characteristics within the Canopy
Differences in photosynthetic attributes between species and between different growing environments have been recognised as important in the adaptation of plants to widely varying light environments and they also affect plant response to pollutant stress. Among the attributes that can alter in this way, the characteristics of chloroplasts are important, particularly their density, orientation, and the organization of membranes within them [37]. It is necessary to consider how these attributes may vary within a canopy in order to indicate the impact of air pollutant injury on crop canopy functioning.
Quantum efficiency of assimilation, a, alpha. This attribute is considered to vary comparatively little between C3 species under satisfactory growing conditions. Values of about 0.05 (mol.CO2)·(mol.quanta)–1 are commonly reported for healthy green leaves produced under sunlit or shaded conditions [29], although for some species, the value of a for a leaf may increase in a shaded environment [37]. In contrast to individual leaves, the value of a for a complete crop canopy may decrease from about 0.055 at low light to less than 0.02 at full sunlight [35].
With more deeply shaded conditions, it is common for the disposition of the approximately discoid chloroplasts to change so that they are located on cell surfaces approximately normal to the incoming radiation, whereas in bright light more chloroplasts are located on the cell surfaces parallel to the incoming radiation and their edges are commonly presented to the radiant beam [38-40]. An increase in thylakoid organization in shaded conditions [41] and changes in leaf structure [42] also result in more efficient light harvesting. Accordingly, it is reasonable to allow for an increase in quantum efficiency of leaves at lower levels in a plant canopy, from about 0.05 to 0.075 (mol.CO2)·(mol.quanta)–1 between the top and bottom of a relatively dense plant canopy. An increment of 0.005 mol·mol–1 per LAI layer has been assumed here. The a for a given LAI layer, L, (aL), is derived from the a for the uppermost (youngest) layer (ao) by Equation (2):
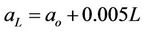 . (2)
. (2)
Curvature of light response function, T, theta. Accompanying the increase in quantum efficiency in shaded environments is an increase in the sharpness of curvature of the light response curve [37]. Consequently, light saturation is reached at considerably lower quantum flux densities in shaded than in sunlit leaves and in many situations leaves that are adapted to shade have higher rates of net photosynthesis under these conditions than do leaves that have adapted to full sunlight. Changes in T can be due to rapid adjustment of the photosynthetic apparatus to altered light conditions [38,40] and to more enduring changes in leaf orientation and internal structure [42]. Variation in T from 0.7 to 0.82 between the youngest and oldest leaves was incorporated into the photosynthesis model. The T for a given leaf area index layer, L, (TL), is derived from the T for the uppermost (youngest) layer (To) by Equation (3):
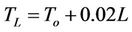 (3)
(3)
Variation in maximum rate of gross photosynthesis, Amax with leaf age depends on the species and particularly on the life span of the leaf. Amax increases during the process of leaf expansion and greening and is commonly maximal at the completion of expansion [43]. It then declines progressively as the leaf ages, and the rate of change may be rapid in short-lived leaves, or slow in species where the leaves persist for several years. Amax may also vary, sometimes considerably, between fully sunlit and deeply shaded leaves [37]. A progressive decrease in Amax may occur in some species, while in others (e.g. oil palm) there is a small decrease over most of the canopy and a more rapid change in older leaves near the bottom. In the present analysis, it was assumed that there was a linear decrease in Amax with distance from the top of the canopy and that the value at the base was twothirds of that at the top.
Where the change in Amax within a plant canopy is important, it can be determined as a function of leaf age if the LAI is small or as a function of LAI if this is large and the leaves persist for a sufficient period of time. For oil palm, leaves remained photosynthetically active for up to two years and there was a small change in the rate of photosynthesis for the first 18 months [19] but for simplicity, it is possible to apply a linear decrease in Amax with increasing leaf age. Amax for a given LAI layer, L, (AmaxL), is derived from Amax for the uppermost (youngest) layer (Amaxo) by Equation (4):
 . (4)
. (4)
Variation in dark respiration RD with leaf position. Canopy respiration is related to the rate of dark respiretion in a leaf at the top of the canopy and to the propagation of light through the canopy [44]. Therefore, it is possible to calculate dark respiration at any LAI layer (RDL) in terms of dark respiration of the uppermost layer (RD0), the maximum rates of gross photosynthesis in the uppermost layer (Amax0) and in the layer concerned (AmaxL) (Equation (5)):
 (5)
(5)
3.2. Photosynthesis in a Plant Canopy
Photosynthesis in a plant canopy will be influenced by the pattern of light penetration through the canopy, the light extinction coefficient k, and by the number of effective layers of leaves, which can be expressed by the leaf area index, L [45] (Equation (6)).
 . (6)
. (6)
The value of the light extinction coefficient, k, is often characteristic for a crop species in which leaf development occurs at the top of the canopy and in which leaf disposition does not alter substantially with age. Where leaves may develop at different positions in the canopy, the growth environments may vary sufficiently that k changes considerably between the upper and lower canopy levels [37]. It is possible to calculate light interception for varying values of k in the canopy that are associated with changing leaf disposition in the canopy [44]. In the first instance and for a mature and fully stocked monoculture plantation or a crop, a constant value of k is commonly assumed in both the vertical and horizontal directions and this convention will be adopted here, using a value of 0.47 [14,19]. An example of instantaneous light response functions derived for the attributes in Table 1 is shown in Figure 2.
3.3. Daily Integral of Net Photosynthesis
The effects of stress on oil palm dry matter production and fruit yield are assumed to be proportional to the effects on the daily integral of photosynthesis [16]. By extension, the relative rates of daily net photosynthesis in fluoride-affected as compared with uninjured canopies can be used as an indicator of the effect of fluoride on crop production. The daily integral of net photosynthesis is a function of the variation in quantum flux incident on the top of the canopy (Io) and the penetration of this light through the canopy. Io can be approximated for any hour of the day (t) by a half sine wave function of the quantum flux on a horizontal surface at noon (Imax) and the number of hours of daylight (h) [45] (Equation (7)):
 . (7)
. (7)
The relationship between instantaneous net photosynthesis under full sunlight and dry matter accumulation by a crop is influenced by the maintenance respiration of the photosynthesising leaves (including during darkness), and the maintenance and growth requirements of other plant parts as the plant develops [14,16,46].
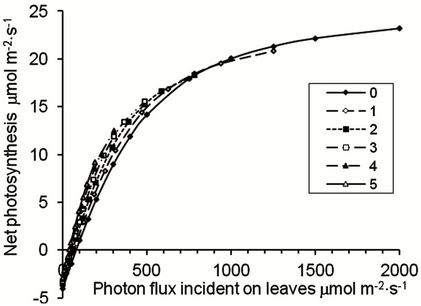
Figure 2. Relationship between instantaneous net photosynthesis in leaf area index (LAI) layers identified by the number of overtopping layers (0 - 5), and photon flux incident on each layer of an oil palm canopy in which alpha increases by 10%, theta increases by 0.02 units, Amax and Rd decrease by 5% per LAI layer from the top of the canopy.
The importance of incorporating variations in leaf functioning into daily photosynthetic dry matter production was tested. A reference (Basic) condition assumed that there is no variation in photosynthetic attributes throughout the canopy. Effects of variation in quantum efficiency (alpha) with increasing LAI resulted in a progressive increase in relative daily net photosynthesis lower in the canopy (Figure 3). Changes in curvature of the response curve (theta) and the maximum rate of photosynthesis in each LAI layer (Amax) did not themselves greatly alter Anet throughout the canopy. However, a reduction in dark respiration (Rd) had a similar effect to the increase in alpha. When all factors were included, a positive daily photosynthetic carbon balance was predicted for more than five LAI layers below the top of the canopy (Figure 3).
This analysis suggests that it is important to obtain the best data possible on the variation in quantum efficiency and dark respiration rates at different positions in the canopy, but it is sufficient to assume that the curvature factor and maximum rate of gross photosynthesis determined in the uppermost LAI layer are applicable to all layers.
4. Effects of Fluoride Injury
4.1. Symptom Expression and Development
The occurrence of chronic fluoride injury in monocotyledonous species with linear venation (e.g., palms) is commonly expressed as the progressive advance of necrosis from the leaf or leaflet tip, sometimes associated with chlorosis of the adjacent living tissues [22]. Other
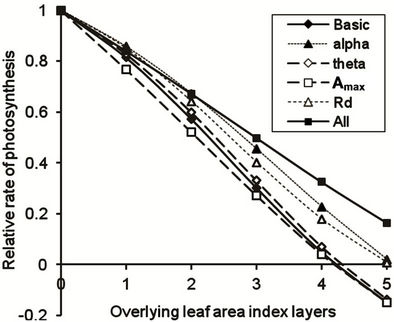
Figure 3. Instantaneous net photosynthesis in successive leaf area index layers of a crop canopy under full sunlight, relative to uppermost layer, estimated by a non-rectangular hyperbola (Basic), with the individual adjustment of: quantum efficiency of CO2 conversion (alpha), curvature coefficient, (theta), light-saturated rate of photosynthesis (Amax), and dark respiration (Rd) with increasing LAI, and for adjustment of all factors with increasing LAI (All).
species may develop chlorosis, either during leaf development [24] or as a progressive symptom accompanying necrosis [22]. No information is available for the pattern of injury expression in oil palm, but other palm species from the same family and with similar venation (Euterpe edulis and Chrysalidocarpus lutescens) show tip necrosis of leaf pinnae underlain by varying amounts of chlorosis [13]. Both of these species are listed in the most fluoride-sensitive group of plants, along with well-known species such as Gladiolus hybridum [13] and Hemerocallis flava, which has been used as an indicator species in Brazil [6,7]. Leaf age is an important determinant of the extent of injury as it is related to the total exposure to a pollutant [22,24]. For fluoride-sensitive monocotyledonous species such as gladiolus or Pinus ponderosa, injury extending to 20 per cent of leaf length or area has been associated with exposure to fluoride that is equal to an average ambient concentration of 0.5 ug·m–3 [47]. The extent of injury in these species appeared to be linearly related to ambient fluoride concentration, with an approximate conversion factor of 40 between ambient concentration and the percentage of leaf length injured. In the absence of direct evidence, a similar sensitivity to fluoride may be assumed for oil palm.
4.2. Light Transmission
Foliar necrosis may alter the pattern of light transmission through a crop canopy because the reflectance, absorbance and transmittance characteristics of the necrotic tissues could differ from those of the living tissues. However, it is assumed that, because leaves of many tropical forest canopy species have an absorptance of about 0.9 [37,48], similar amounts of radiation will be intercepted by both living and necrotic tissues and that the canopy light extinction coefficient, k, is independent of the fraction of necrotic tissue. Partial foliar chlorosis may also affect light penetration through the plant canopy. Chlorosis may be associated with reduced chlorophyll concentrations per unit leaf area and light absorptance but the magnitude of these changes need to be evaluated in relation to other effects. Here, the optical properties of leaves are assumed to be independent of the extent of chlorosis.
4.3. Rate of Photosynthesis
Necrosis reduces functional leaf area and photosynthetic production, usually in direct proportion to its extent [23]. Chlorosis is commonly associated with a reduction in the quantum efficiency from about 0.05 to 0.03 (mol.CO2). (mol.quanta)–1 and in the rate of photosynthesis at low light [43], but under full sunlight and sufficiently high CO2 concentrations, chlorotic leaves of Zea mays [49], Hordeum vulgare [50], Brassica napus [51] reached similar rates of photosynthesis to green leaves.
For practical assessment of chlorosis, the quantum efficiency of the partially chlorotic leaf can be calculated as the mean efficiencies of the green and chlorotic portions, allowing for the extent and intensity of chlorosis [52]. This conclusion is supported by the observation that the rate of photosynthesis in chlorotic leaves resulting from rust infection was reduced, but by less than the proportion of chlorotic area [23]. Figure 4(a) shows that constant necrosis throughout the canopy results in a proportional loss of photosynthetic production in each leaf area index layer while constant chlorosis has an initially smaller but increasing effect towards the base of the canopy. The combined effect of necrosis and chlorosis tends to be dominated by necrosis. Where injury increases by a constant proportion in successive LAI layers from the top, the effects of necrosis and chlorosis are similar until the leaves are shaded by four or more LAI layers (Figure 4(b)). At this point, leaves cannot maintain a positive carbon balance and are deemed to have died, reducing the effective LAI.
A decrease in the leaf area available for photosynthesis may also occur as a result of pruning lower leaves to access fruit for harvesting. This reduction in functioning leaf area may decrease dry matter production, but it could also be associated with an increase in the rate of photosynthesis of the remaining functioning leaf area [14]. A conservative assumption is that photosynthesis is proportional to the live leaf area in a plant canopy.
Effects of injury on canopy photosynthesis can be indicated for situations where different extents of necrosis plus chlorosis affect the leaves, both where the severity of injury is uniform throughout the canopy (Figure 5(a)) and where the injury increases by a fixed percentage of leaf area between each leaf area index layer (Figure 5(b)).
Where injury is constant and where necrosis and chlorosis each affect up to 20% of the leaf area throughout the oil palm canopy, it is predicted that leaves are retained up to a LAI of 6 (Figure 5(a)) and that the lowest leaves are still contributing to the daily carbon balance of the canopy. Where injury is incremental between LAI layers (Figure 5(b)), leaf death occurs in the lowest LAI layer when injury in the uppermost LAI layer is 10% necrosis and 10% chlorosis. If injury to the youngest LAI layer is 20% necrosis plus 20% chlorosis, the canopy LAI is reduced to 3 and daily photosynthetic production is reduced by more than 60 % (Figure 5(b)). The impact of the reduction in photosynthetic activity in the lower leaves is shown when the daily integral of canopy photosynthesis is compared for different injury scenarios (Figure 6). With constant injury throughout the canopy, there is a linear decrease in daily canopy photosynthesis
 (a)
(a) (b)
(b)
Figure 4. Effects on daily net photosynthesis of chlorosis (chl) and necrosis (nec), and their combination (Chl & Nec), in leaves at different positions in the canopy with characteristics as specified in Table 1. (a) Injury to 10% of leaf area distributed uniformly throughout the plant canopy; (b) chlorosis and necrosis each extending to 10% of leaf area in the uppermost leaf area index layer, and their combination, and incrementing by 10% in leaves at each successively lower leaf area index position in the canopy (Inc nec, Inc chl, Inc N & C).
at a rate of 0.83 times the total percentage of injured leaf area. With incremental injury in each LAI layer, there is an exponential decrease in relative daily canopy photosynthesis. If up to 10 % of the total area of the uppermost LAI layer is injured (contributed equally by necrosis and chlorosis) and if injury increases by the same amount in each successive LAI layer, the percentage loss of photosynthetic production is approximately 2.5 times the total percentage of leaf area showing injury in the uppermost LAI layer.
Because the nature of injury due to an accumulating contaminant such as fluoride is commonly for injury to increase approximately in proportion to the duration of exposure [22,47] the exponential pattern of canopy production loss can be expected to apply for most species in which leaves are retained for several months. A similar approach can be used if there are distinct cohorts of
 (a)
(a)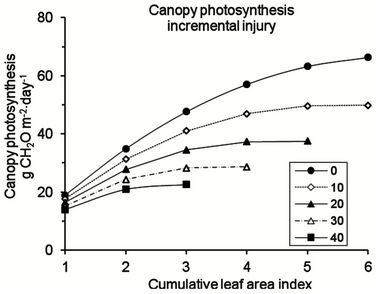 (b)
(b)
Figure 5. Cumulative daily net photosynthesis for canopies with increasing leaf area index and increasing total percentage of injured leaf area contributed equally by necrosis and chlorosis which is (a) constant throughout the canopy or (b) increasing by equal increments in successive LAI layers from the top of the canopy, while a positive daily integral of photosynthesis is maintained.

Figure 6. Relative daily integrals of canopy photosynthesis (Prel) when a constant extent of necrosis plus an equal extent of chlorosis (Ai) occurs on all leaves throughout the canopy (Constant) and when a certain extent of necrosis plus an equal extent of chlorosis occurs in the uppermost LAI layer and increases by that amount in successively lower LAI layers (Incremental).
leaves and where these may be retained for more than one year, as in numerous coniferous and some tropical species.
If oil palm is assumed to have the same fluoride sensitivity as Pinus ponderosa [47], and if a growing season average ambient concentration of 0.5 μg·HF·m–3 results in 20% necrosis, this common air quality criterion might be associated with a crop production loss of 45%. In order to restrict potential crop loss to less than 10%, the ambient fluoride concentration would need to be about 0.1 μg·HF·m–3. This would require that any large fluoride source was far removed from an oil palm plantation.
5. Conclusions
Models of photosynthesis and associated fruit production have been applied widely and effectively to oil palm plantation management and deal with the effects of light, temperature, nutrition and water supply. Extension of a model to assess the potential effects of air pollutant injury suggests that the loss of functioning leaf area through necrosis is more important than the changes in photosynthetic characteristics that occur with increasing distance from the top of an oil palm canopy or those associated with chlorosis. If increasing injury is associated with increasing leaf age, and if potential crop losses are to be no more than 10%, the extent of injury in the uppermost leaf area index layer should not be more than about 3% of leaf area. For practical purposes, visible injury associated with fluoride accumulation should be avoided.
This model could expedite testing of fluoride sensitivity of crop species by relating fluoride exposure to the appearance of visible injury and, if facilities are available, experimental studies of photosynthesis. It should then be possible to identify at an early stage of planning those activities and areas most at risk from prospective industrial fluoride emissions and to avoid potential crop yield losses resulting from exposure to atmospheric fluoride.
REFERENCES
- World Health Organization (WHO), “Air Quality Guidelines for Europe. 2nd Edition. WHO Regional Publications, European Series, No. 91,” WHO Regional Office for Europe, Copenhagen, 2000.
- J. L. Innes and A. H. Haron, Eds., “Air Pollution and the Forests of Developing and Rapidly Industrializing Regions: Report No. 4 of the IUFRO Task Force on Environmental Change,” CABI Publishing, Wallingford, 2000.
- L. Emberson, M. Ashmore and F. Murray, Eds., “Air Pollution Impacts on Crops and Forests,” Imperial College Press, London, 2003.
- F. Murray, “Air Pollution Impacts on Vegetation in Australia,” In: L. Emberson, M. Ashmore and F. Murray, Eds., Air Pollution Impacts on Crops and Forests, Imperial College Press, London, 2003, pp. 103-118. doi:10.1142/9781848161276_0005
- L. Emberson, J. Kuylenstierna and M. Ashmore, M “Assessing the Extent of Air Pollution Impacts in Developing Country Regions,” In: L. Emberson, M. Ashmore and F. Murray, Eds., Air Pollution Impacts on Crops and Forests, Imperial College Press, London, 2003, pp. 309-335. doi:10.1142/9781848161276_0014
- A. Klumpp, G. Klumpp, M. Domingos and M. D. da Silva, “Fluoride Impact on Native Tree Species of the Atlantic Forest near Cubatao, Brazil,” Water, Air and Soil Pollution, Vol. 87, No. 1-4, 1996, pp. 57-71. doi:10.1007/BF00696829
- G. Klumpp, A. Klumpp, M. Domingos and R. Guderian, “Hemerocallis as Bioindicator of Fluoride Pollution in Tropical Countries,” Environmental Monitoring and Assessment, Vol. 35, No. 1, 1995, pp. 27-42.
- A. Wahid, “Air Pollution Impacts on Vegetation in Pakistan,” In: L. Emberson, M. Ashmore and F. Murray, Eds., Air Pollution Impacts on Crops and Forests, Imperial College Press, London, 2003, pp. 189-213. doi:10.1142/9781848161276_0009
- M. L. De Bauer, “Air Pollution Impacts on Vegetation in Mexico,” In: L. Emberson, M. Ashmore and F. Murray, Eds., Air Pollution Impacts on Crops and Forests, Imperial College Press, London, 2003, pp. 263-286. doi:10.1142/9781848161276_0012
- B. H. Sheu and C. P. Liu, “Air Pollution Impacts on Vegetation in Taiwan,” In: L. Emberson, M. Ashmore and F. Murray, Eds., Air Pollution Impacts on Crops and Forests, Imperial College Press, London, 2003, pp. 145-163. doi:10.1142/9781848161276_0007
- M. Domingos, A. Klumpp and G. Klumpp, “Disturbances to the Atlantic Rainforest in Southeast Brazil,” In: L. Emberson, M. Ashmore and F. Murray, Eds., Air Pollution Impacts on Crops and Forests, Imperial College Press, London, 2003, pp. 287-308. doi:10.1142/9781848161276_0013
- L. H. Weinstein and A. W. Davison, “Native Plant Species Suitable as Bioindicators and Biomonitors for Airborne Fluoride,” Environmental Pollution, Vol. 125, No. 1, 2003, pp. 3-11. doi:10.1016/S0269-7491(03)00090-3
- U. Arndt, F. Flores and L. H. Weinstein, “Fluoride Effects on Plants: Diagnosis of Injury in the Vegetation of Brazil,” Editora de Universidade/UFRGS, Porto Alegre, Rio Grande do Sul, 1995.
- R. H. V. Corley and P. B. Tinker, “The Oil Palm,” 4th Edition, Blackwell Science, Oxford, 2003. doi:10.1002/9780470750971
- E. B. Fitzherbert, M. J. Struebig, A. Morel, F. Danielsen, C. A. Bruhl, P. F. Donald and B. Phalan, “How Will Oil Palm Expansion Affect Biodiversity?” Trends in Ecology and Evoluton, Vol. 23, No. 10, 2008, pp. 539-545. doi:10.1016/j.tree.2008.06.012
- E. Dufrene, R. Ochs and B. Saugier, “Oil Palm Photosynthesis and Productivity Linked to Climatic Factors,” Oleagineaux, Vol. 45, No. 8-9, 1990, pp. 345-355.
- B. G. Smith, “The Effects of Soil Water and Atmospheric Vapour Pressure Deficit on Stomatal Behaviour and Photosynthesis in the Oil Palm,” Journal of Experimental Botany, Vol. 40, No. 215, 1989, pp. 647-651. doi:10.1093/jxb/40.6.647
- E. Dufrene and B. Saugier, “Field Studies of Leaf Gas Exchange in Oil Palm Tree (Elaeis guineensis Jacq.),” Annales des Sciences Forestieres, Vol. 46, 1989, pp. 439s- 442s. doi:10.1051/forest:19890598
- E. Dufrene and B. Saugier, “Gas Exchange of Oil Palm in Relation to Light, Vapour Pressure Deficit, Temperature and Leaf Age,” Functional Ecology, Vol. 7, No. 1, 1993, pp. 97-104. doi:10.2307/2389872
- I. E. Henson, “Modelling the Effects of ‘Haze’ on Oil Palm Productivity and Yield,” Journal of Oil Palm Research, Vol. 12, No. 1, 2000, pp. 123-134.
- G. R. Squire and R. V. H. Corley, “Oil Palm,” In: M. R. Sethuraj and A. S. Raghavendra, Eds., Tree Crop Physiology, Elsevier, Amsterdam, 1987, pp. 141-167.
- L. H. Weinstein and A. W. Davison, “Fluorides in the Environment,” CABI Publishing, Wallingford, 2004.
- C. Robert, M.-O. Bancal, P. Nicolas, C. Lannou and B. Ney, “Analysis and Modelling of Effects of Leaf Rust and Septoria tritici Blotch on Wheat Growth,” Journal of Experimental Botany, Vol. 55, No. 399, 2004, pp. 1079- 1094. doi:10.1093/jxb/erh108
- D. Doley, “Plant-Fluoride Relationships,” Inkata Press, North Clayton, 1986.
- P. B. Reich “Quantifying Plant Response to Ozone. A Unifying Theory,” Tree Physiology, Vol. 3, No. 1, 1987, pp. 63-91.
- R. F. Heath, “Possible Mechanisms for the Inhibition of Photosynthesis by Ozone,” Photosynthesis Research, Vol. 39, No. 3, 1994, pp. 439-451. doi:10.1093/jxb/erh108
- G. D. Farquhar, S. von Caemmerer and J. A. Berry, “A Biochemical Model of Photosynthetic CO2 Assimilation in Leaves of C3 Species,” Planta, Vol. 149, No. 1, 1980, pp. 78-90. doi:10.1007/BF00386231
- I. R. Johnson and J. H. M. Thornley, “A Model of Instantaneous and Daily Canopy Photosynthesis,” Journal of Theoretical Biology, Vol. 107, No. 4, 1984, pp. 531-545. doi:10.1016/S0022-5193(84)80131-9
- M. G. R. Cannell and J. H. M. Thornley, “Temperature and CO2 Responses of Leaf and Canopy Photosynthesis: A Clarification Using the Non-Rectangular Hyperbola Model of Photosynthesis,” Annals of Botany, Vol. 82, No. 6, 1998, pp. 883-892. doi:10.1006/anbo.1998.0777
- J. L. Monteith, “Climate and the Efficiency of Crop Production in Britain,” Philosophical Transactions of the Royal Society of London, Series B, Vol. 281, No. 980, 1977, pp. 277-294. doi:10.1098/rstb.1977.0140
- J. Goudriaan and J. L. Monteith, “A Mathematical Function for Crop Growth Based on Light Interception and Leaf Expansion,” Annals of Botany, Vol. 66, No. 6, 1990, pp. 695-701.
- E. Falge, W. Graber, R. Siegwolf and J. D. Tenhunen, “A Model of the Gas Exchange Response of Picea abies to Habitat Conditions,” Trees, Vol. 10, No. 5, 1996, pp. 277- 287. doi:10.1007/BF02340773
- F. Ewert and J. R. Porter, “Ozone Effects on Wheat in Relation to CO2: Modelling Short-Term and Long-Term Responses of Leaf Photosynthesis and Leaf Duration,” Global Change Biology, Vol. 6, No. 7, 2000, pp. 735-750. doi:10.1046/j.1365-2486.2000.00351.x
- J. J. Landsberg and R. H. Waring, “A Generalised Model of Forest Productivity Using Simplified Concepts of Radiation-Use Efficiency, Carbon Balance and Partitioning,” Forest Ecology and Management, Vol. 95, No. 3, 1987, pp. 209-228. doi:10.1016/S0378-1127(97)00026-1
- X.-G. Zhu, S. P. Long and D. R. Ort, “Improving Photosynthetic Efficiency for Greater Yield,” Annual Review of Plant Biology, Vol. 61, No. 1, 2010, pp. 235-261. doi:10.1146/annurev-arplant-042809-112206
- J. H. M. Thornley, “Mathematical Models in Plant Physiology,” Academic Press, London, 1976.
- N. K. Boardman, “Comparative Photosynthesis of Sun and Shade Plants,” Annual Review of Plant Physiology, Vol. 28, 1977, pp. 355-377. doi:10.1146/annurev.pp.28.060177.002035
- E. Brugnoli and O. Bjorkman, “Chloroplast Movement in Leaves: Influence on Chlorophyll Fluorescence and Measurements of Light-Induced Absorbance Changes Related to pH and Zeaxanthin Formation,” Photosynthesis Research, Vol. 32, No. 1, 1988, pp. 23-35. doi:10.1007/BF00028795
- W. Haupt and R. Scheurlein, “Chloroplast Movement,” Plant Cell and Environment, Vol. 13, No. 7, 1990, pp. 595-614. doi:10.1111/j.1365-3040.1990.tb01078.x
- M. Wada, T. Kagawa and Y. Sato, “Chloroplast Movement,” Annual Review of Plant Biology, Vol. 54, No. 1, 2003, pp. 455-468. doi:10.1146/annurev.arplant.54.031902.135023
- J. M. Anderson, W. S. Chow and D. J. Goodchild, “Thylakoid Membrane Organisation in Sun/Shade Acclimation,” Australian Journal of Plant Physiology, Vol. 15, No. 1, 1988, pp. 11-26. doi:10.1071/PP9880011
- J. R. Evans, I. Jakobsen and E. Ogren, “Photosynthetic Light-Response Curves. Gradients of Light Absorption and Photosynthetic Capacity,” Planta, Vol. 189, No. 2, 1993, pp. 191-200.
- O. V. S. Heath, “The Physiological Aspects of Photosynthesis,” Heinemann, London, 1969.
- D. A. Charles-Edwards, “The Mathematics of Photosynthesis and Productivity,” Academic Press, London, 1981.
- J. L. Monteith, “Light Distribution and Photosynthesis in Field Crops,” Annals of Botany, Vol. 92, No. 1, 1965, pp. 17-37.
- J. S. Amthor, “The McCree-de Wit-Penning de Vries-Thornley Respiration Paradigms: 30 Years Later,” Annals of Botany, Vol. 86, No. 1, 2000, pp. 1-20. doi:10.1006/anbo.2000.1175
- D. F. Adams, J. W. Hendrix and H. G. Applegate, “Atmospheric Pollution, Relationship among Exposure Periods, Foliar Burn, and Fluorine Content of Plants Exposed to Hydrogen Fluoride,” Journal of Agricultural and Food Chemistry, Vol. 5, No. 2, 1957, pp. 108-116. doi:10.1021/jf60072a002
- H. W. Gausmann, W. A. Allen, V. I. Myers and R. Cardenas, “Reflectance and Internal Structure of Cotton Leaves, Gossypium hirsutum L.,” Agronomy Journal, Vol. 61, No. 3, 1968, pp. 374-376. doi:10.2134/agronj1969.00021962006100030011x
- G. E. Edwards, E. Johnson, A. Laland and J. O. P. Krall, “Quantum Yields of Photosystem II and Photosynthesis in an Aurea Mutant of Tobacco (C3) and an Oil Yellow Mutant of Maize (C4) which have High Capacities for Photosynthesis Despite Low Chlorophyll Contents,” Plant and Cell Physiology, Vol. 34, No. 8, 1993, pp. 1205- 1212.
- G. Havaux and F. Tardy, “Loss of Chlorophyll with Limited Reduction of Photosynthesis as an Adapting Response of Syrian Barley Landraces to High-light and Heat Stress,” Australian Journal of Plant Physiology, Vol. 26, No. 6, 1999, pp. 569-578. doi:10.1071/PP99046
- A. Baryla, P. Carrier, F. Franck, C. Coulomb, C. Sahut and M. Havaux, “Leaf Chlorosis in Oilseed Rape Plants (Brassica napus) Grown on Cadmium-Polluted Soil: Causes and Consequences for Photosynthesis and Growth,” Planta, Vol. 212, No. 5-6, 2001, pp. 696-708. doi:10.1007/s004250000439
- D. Doley, “Rapid Quantitative Assessment of Visible Injury to Vegetation and Visual Amenity Effects of Fluoride Air Pollution,” Environmental Monitoring and Assessment, Vol. 160, No. 1-4, 2010, pp. 181-198. doi:10.1007/s10661-008-0686-7