Soft Nanoscience Letters
Vol.2 No.2(2012), Article ID:18576,4 pages DOI:10.4236/snl.2012.22003
Study of Ionic Conduction and Dielectric Behavior of Pure and K+ Doped Ag2CdI4
![]()
Physical Chemistry Division, Department of Chemistry, Faculty of Sciences, Aligarh Muslim University, Aligarh, India.
Email: *chemdocprof@gmail.com
Received January 10th, 2012; revised February 5th, 2012; accepted February 24th, 2012
Keywords: Electrical Conductivity; Dielectric Constant; Ionic Conductor; Nanocrystalline
ABSTRACT
The ionic conductivity of 8, 9 and 10 mol% K+ doped Ag2CdI4 showed slight decrease whereas the phase transition was observed almost at the same temperature as it reported for pure Ag2CdI4. This decrease in conductivity likely results from decrease in free volume because of the larger K+ ions ( = 133 pm and
  = 129 pm) entering Ag2CdI4 lattice which is unchanging in size. The dielectric constant of Ag2CdI4 was found to increase with increasing temperature as the orientation of dipoles is facilitated in rising temperature.
1. Introduction
Ag2CdI4 compound belongs to the so called superionic materials of A2BI4 type (A = Cu, Ag, In, Tl; B = Hg, Cd, Zn), that undergo phase transition into superionic state. Structural investigation of superionic materials Ag2HgI4, Cu2HgI4 and others show the existence of low temperature b-phase, as a rule, tetragonal syngony, and high temperature a-phase [1,2]. It is considered that during b®a phase transition iodine sub-lattice remains, while there in a phase A+, B2+ ions and stoichiometric vacancies,  , which are distributed randomly in crystal lattice determine high conductivity of the material.
Ag2CdI4 compounds possess smeared phase transitions into the superionic state in the temperature region 330 - 380 K. The solid fast ion conductor Ag2CdI4 exhibits a number of solid state phase transitions upon heating. Room temperature, covalent phase Ag2CdI4 crystallizes in a well-defined structure. Ag2CdI4 at T < 330 K belongs predominantly to hexagonal, with space group P6/mmm and unit cell dimensions a = 4.578 Ǻ and C = 7.529 Ǻ and changes to cubic at T > 380 K with space group Pm3m and unit cell dimension a = 5.05 Ǻ [3].
Sudharsanan et al. [4,5] studied the IR and Raman spectra of this compound. Bolesta et al., [6] calculated the band structure of Ag2CdI4 by semi-empirical method using strong band approximation. Yunakova et al. [7], studied the temperature dependence of the spectral position and half-width of the A band in the range 90 - 430 K in Ag2CdI4. Nair et al. [8] studied the behaviour of Ag+ in Ag2CdI4 by cation substituted smaller Li+ and the larger Tl+ ions. Beeken et al. [9] tried to determine the effect of Cu-substitution on the conductivity and phase transition temperature of Ag2CdI4. Inspired by the results we have tried to prepare Ag2CdI4 and study the effect of K+ substitution on the conductivity and phase transition temperature of Ag2CdI4.
2. Experimental
2.1. Material Preparation
Silver tetraiodocadmiate (Ag2CdI4) was prepared from AgI and CdI2 obtained from BDH (India), with stated purity 99.2% and 99.6% respectively, by the solid state reaction method. AgI and CdI2 were mixed in the requisite composition in an agate mortar and were heated at 400˚C for 48 hours in a silica crucible with intermittent grinding. X-ray diffraction studies were carried out for the material after the reaction was completed. X-ray diffraction pattern suggest the formation of the product Ag2CdI4.
Potassium ion was mixed with Ag2CdI4 in requisite amount in an agate mortar by solid state reaction and the powder is kept for 24 hours at 473 K with intermittent grinding so that the reaction takes place properly.
2.2. Measurements
2.2.1. Electrical Conductivity Measurements
Electrical conductivity was measured by preparing pellet of the compound by pouring its fine powder into a stainless steel die and applying a pressure of about 4 tonnes/cm2 with the help of hydraulic press, SPECTRA LAB, model LB-89. The pellet so formed has area of 4.524 cm2 and thickness of 0.1 cm. The pellet is annealed at 400 K for 12 hours in order to eliminate any grain boundary effect. The electrical conductivity measurements were performed by means of a two probe method. The pellet was mounted on a stainless steel samples holder assembly between copper leads using two polished platinum electrodes. The copper leads were electrically insulated from the samples holder by Teflon sheets. The electrical conductivity of the samples was measured in the temperature range of 298 - 473 K by using a GenRad 1659 RLC Digibridge at a fixed frequency.
2.2.2. Dielectric Measurement
The dielectric constant of Ag2CdI4 was calculated over the frequency range 100Hz to 10 KHz and in the temperature range of 298 - 473 K using the relation given as,

where e0 is the constant of permittivity for free space, C is the capacitance which is measured by the RLC Digibridge (mentioned above), d the thickness of the pellet and A is the cross-sectional area of the flat surface of the pellet.
3. Result and Discussion
The temperature dependence of conductivity is given by the Arrhenius expression
 (1)
(1)
 (2)
(2)
where n is the number of ions per unit volume, e the ionic charge, l the distance between two jumps positions, n the jump frequency, g the intersite geometric constant, k the Boltzmann constant and DG*, DS* and DH* are activation free energy, entropy and enthalpy terms. The equation can be written in a simpler form as
 (3)
(3)
 (4)
(4)
where so = ne2l2ng/k exp (–DS*/k) and DH* = Ea, i.e., the activation enthalpy equals experimental activation energy for ionic motion, which may include a defect formation enthalpy contribution [10].
Figure 1 shows a typical heat and cool mode plots of log σT vs 1/T for undoped Ag2CdI4, using Equation (4). It observed that the conductivity data were reproducible within experimental error (≤ ±2%) for heating and cooling cycles. The conductivity values of undoped Ag2CdI4 were found to have increased slowly initially but a sharp increase in conductivity was noted above 380 K. The presence of hysterisis loop in the heating and cooling phase of conductivity in the unannealed sample of Ag2CdI4 confirm the fact that abrupt change in conductivity is due to the phase transition.
Electrical conductivity (σ), measurements were performed on several potassium doped Ag2CdI4 sample throughout the temperature range 298 - 473 K. Arrhenius plot of pure Ag2CdI4 shows gradual increase in conductivity up to 380 K and above this temperature a sharp change in conductivity indicates the occurrence of phase transition at 380 K (Figure 2). The conductivity data of doped Ag2CdI4 samples with K+ ion found to exceed in conductivity as compare to the Li+ and Na+ ions [2,8].
The conductivity increase observed in the present investigation can be explained on the basis of the space charge model reported by Maier et al. [11]. In thermal equilibrium, the surface and grain boundaries of an ionic crystal may carry an electric charge resulting from the presence of excess ions of one sign. This charge is just compensated by a space charge cloud of the opposite sign

Figure 1. Temperature dependence electrical conductivity of Ag2CdI4.

Figure 2. Effect of the cation dopant on the conductivity of Ag2CdI4.
adjacent to the boundary. For a pure material, this charge arises if the energies to form anion and cation vacancies or interstitials at the boundary are different. The magnitude and sign of the boundary charge changes if there are aliovalent solutes present in the matrix which alter the concentration of the lattice defects in the crystal. Space charge effects will be predominantly important in very small crystals since the grain boundaries contain a large number of defects compared to the coarser grained polycrystalline materials.
K+ ion was chosen as the dopant with the expectation that it would enhance the conductivity of Ag2CdI4 on the basis of lattice expansion due to the larger K+ radius, ( = 133 pm and
  = 129 pm). But during the course of reaction the conductivity of Ag2CdI4 doped with different mol % of K+ ions was found to decrease. This observed decrease likely results from decrease in free volume as larger potassium ion entering Ag2CdI4 lattice which is unchanging in size. Another important feature observed in the K+ doped Ag2CdI4 is erratic conductivity behaveiour in the post transition region of 9 and 10 mol% K+ doped Ag2CdI4. After 433 K the conductivity further decreases which are due to the collapse of
  framework and subsequently recovered on cooling which implies the restructuring of that sub-lattice [12].
The dielectric constant, e' of Ag2CdI4 was calculated over the frequency range 100 Hz to 10 KHz and in the temperature range of 298 - 473 K using relation mentioned in experimental section.
The plot between log e' and temperature (Figure 3), shows almost linear increase in e' with temperature. There is a small upward shift in the values of e' with decrease of frequencies near the transition temperature of Ag2CdI4, the slope of the graph before and after the transition remains the same.
This increase in dielectric constant of Ag2CdI4 with temperature may be attributed due to the reason that the
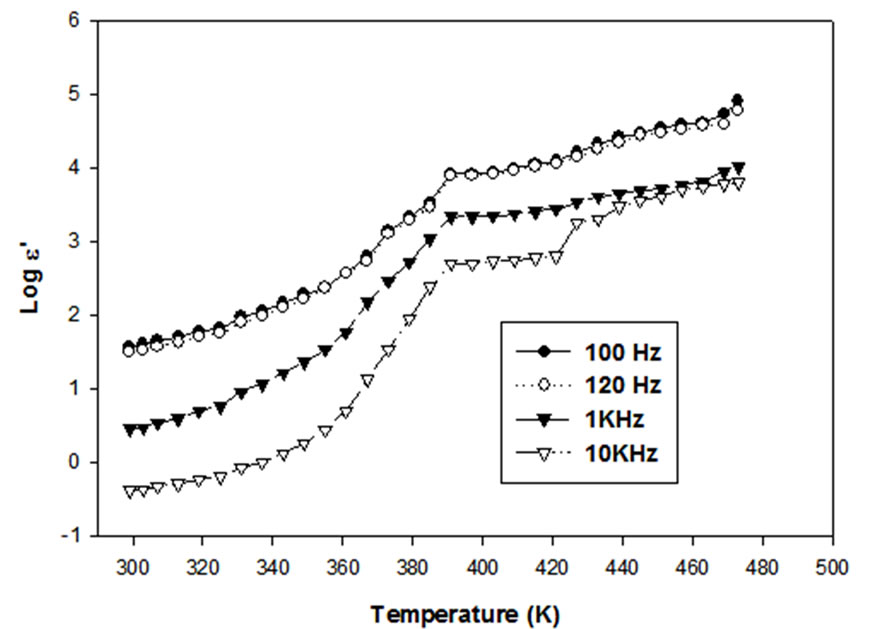
Figure 3. Temperature dependence dielectric constant of Ag2CdI4 on different frequency.
molecules cannot orient themselves in dielectrics. As temperature rises, the orientation of dipoles is facilitated and ionic polarization increases resulting in the increase of dielectric constant (e') [13,14]. Also at higher temperatures, the conductivity due to the hopping of mobile ions becomes important and increased dielectric constant results.
According to Samara [15], higher the dielectric constant of an ionic crystal, lower the energy of formation of lattice defects. Since the grain boundary of nanoparticles contain a large density of defects [16,17], it can be argued that the dielectric constant of nanoparticles should have higher values.
Nano-crystalline materials consist of grain or interphase boundaries. These boundaries contain defects such as dangling bond, vacancies, vacancy clusters etc. [18]. These defects can cause a positive or negative space charge distribution at interfaces. The space charges can move under the application of an external field and when they are trapped by the defects, lots of dipole moments are formed (space charge polarization). Hence the space charge effect will be an important factor which decides the dielectric properties in materials with small particles sizes [11]. In addition, ion jump polarization may also be greater in nanocrystalline materials since there will be a number of position in the grain boundaries for the ions to occupy. Thus the high values of the dielectric constant in Ag2CdI4 may be attributed to the increased ion jump orientation effect and the increased space charge effect exhibited by nanoparticles.
4. Conclusion
Electrical conductivity (σ) plots of several K+ doped Ag2CdI4 samples show decrease in conductivity. This observed decrease in conductivity was due to decrease in free volume which results from the larger potassium ion entering Ag2CdI4 lattice. The erratic conductivity behaveiour observed in the post transition region of K+ doped Ag2CdI4 was due to the collapse of CdI4 framework. The dielectric constant of Ag2CdI4 was found to increase with temperature which facilitates the orientation of dipoles in Ag2CdI4.
5. Acknowledgements
We thankfully acknowledge Department of Chemistry, Aligarh Muslim University, Aligarh, India, for providing necessary facilities to carryout this work.
REFERENCES
- H. G. LeDuc and L. B. Celeman, “Far-Infrared Studies of the Phase Transition and Conduction Mechanism in the Fast-Ion Conductors Ag2HgI4 and Cu2HgI4,” Physical Review B, Vol. 31, No. 2, 1985, pp. 933-941. doi:10.1103/PhysRevB.31.933
- S. M. Nair, A. I. Yahiya and A. Ahmad, “Ion Conduction in the Ag2HgI4-Cu2HgI4 Systems Doped with Cd2+, K+, and Na+,” Journal of Solid State Chemistry, Vol. 122, No. 2, 1996, pp. 349-352. doi:10.1006/jssc.1996.0125
- I. M. Bolesta, O. V. Futey and O. G. Syrbu, “Optical Investigations of Superionic Phase Transition in Ag2CdI4 Thin Films,” Solid State Ionics, Vol. 119, No. 1-4, 1999, pp. 103-107. doi:10.1016/S0167-2738(98)00489-5
- R. Sudharsanan, S. Radhakrishna and K. Hariharan, “Electrical Conductivity and Electronic Absorption Studies on Ag2CdI4 Thin Films,” Solid State Ionics, Vol. 9-10, No. 2, 1983, pp. 1473-1476. doi:10.1016/0167-2738(83)90198-4
- R. Sudharsanan, T. K. K. Srinivasan and S. Radhakrishna, “Raman and Far IR Studies on Ag2CdI4 and Cu2CdI4 Superionic Compounds,” Solid State Ionics, Vol. 13, No. 4, 1984, pp. 277-283. doi:10.1016/0167-2738(84)90069-9
- I. Bolesta, O. Futey and S. Velgosh, “Crystalline and Band Energy Structure of Ag2CdI4,” Ukrainian Journal of Physical Optics, Vol. 1, No. 1, 2000, pp. 13-15. doi:10.3116/16091833/1/1/13/2000
- O. N. Yunakova, V. K. Miloslavskii and E. N. Kovalenko, “The Absorption Spectrum and Excitons in an Ag2CdI4 Ionic Conductor,” Physics of the Solid State, Vol. 43, No. 6, 2001, pp. 1072-1076. doi:10.1134/1.1378146
- S. M. Nair and A. Ahmad, “Effect of Cation Substitution on Fast Ag+ Ion Conductivity in Ag2CdI4,” Journal of Physics and Chemistry of Solids, Vol. 58 No. 2, 1997, pp. 331-333. doi:10.1016/S0022-3697(96)00116-3
- R. B. Becken, J. C. Falud, W. M. Schreier and J. M. Tritz, “Ionic Conductivity in Cu-Substituted Ag2CdI4,” Solid State Ionics, Vol. 154-155, 2002, pp. 719-722. doi:10.1016/S0167-2738(02)00433-2
- K. Siraj and Rafiuddin, “Electrical Conductivity Behavior of CdHgI4-CuI Mixed System,” International Journal of Chemical, Vol. 3, No. 2, 2011, pp. 174-179.
- J. Maier, S. Prill and B. Reichert, “Space Charge Effects in Polycrystalline, Micropolycrystalline and Thin Film Samples: Application to AgCl and AgBr,” Solid State Ionics, Vol. 28-30, 1988, pp. 1465-1469. doi:10.1016/0167-2738(88)90405-5
- M. S. Kumari and E. A. Secco, “IV. Order-Disorder Transitions: Solid State Kinetics, Thermal Analyses, X-Ray Diffraction and Electrical Conductivity Studies in the Ag2SO4-K2SO4 System,” Canadian Journal of Chemistry, Vol. 63, No. 2, 1985, pp. 324-328. doi:10.1139/v85-054
- B. Tareev, “Physics of Dielectric Materials,” Mir Publication, Moscow, 1979.
- W. D. Kingery, “Introduction to Ceramics,” John Wiley, New York, 1976.
- G. A. Samara, “High-Pressure Studies of Ionic Conductivity in Solids,” Solid State Physics, Vol. 38, 1984, pp. 1-80. doi:10.1016/S0081-1947(08)60311-2
- W. P. Halperin, “Quantum Size Effects in Metal Particles,” Reviews of Modern Physics, Vol. 58, No. 3, 1986, pp. 533-607. doi:10.1103/RevModPhys.58.533
- H. Gleiter, “Nanocrystalline Materials,” Progress in Materials Science, Vol. 33, No. 4, 1989, pp. 223-315. doi:10.1016/0079-6425(89)90001-7
- C.-M. Mo, L. D. Zhang and G. Z. Wang, “Characteristics of Dielectric Behavior in Nanostructured Materials,” Nanostructured Materials, Vol. 6, No. 5-8, 1995, pp. 823- 826. doi:10.1016/0965-9773(95)00186-7
NOTES
*Corresponding author.