Advances in Chemical Engineering and Science
Vol.3 No.1(2013), Article ID:26465,8 pages DOI:10.4236/aces.2013.31001
Effect of Two Liquid Phases on the Separation Efficiency of Distillation Columns
Department of Chemical Engineering, Federal University of Campina Grande, Campina Grande, Brazil
Email: *romildo.brito@deq.ufcg.edu.br
Received September 5, 2012; revised October 7, 2012; accepted October 16, 2012
Keywords: Distillation; Azeotropic; Two Liquid Phases; Separation Factor
ABSTRACT
Distillation is one of the oldest and most important separation processes used in the chemical and petrochemical industries. On the other hand, it is a process the thermodynamic efficiency of which is very low, and therefore reducing the consumption of energy is one of the targets of research studies on distillation. This article arose from seeking to reduce energy consumption in a distillation train of 1,2-dichloroethane (ethylene dichloride-EDC) of a commercial plant producing vinyl monochloride (VMC), which involves an azeotropic distillation column. The reduction in the reboiler heat duty caused significant changes in concentration and temperature profiles throughout the column due to the formation of two liquid phases. The results show that, although very small in percentage terms (less than 2.5%), the appearance of the 2nd liquid phase causes significant changes in the operation of the column and the separation achieved.
1. Introduction
Distillation is one of the oldest and most important separation processes used in chemical processes. On the other hand, its thermodynamic efficiency is extremely low, which accounts for the high percentage of global energy consumed in a plant. In general, distillation column reboilers consume over 50% of the energy involved in the process of heat exchange in a plant (Soave and Feliu, 2002 [1]).
The term azeotropic distillation is applied to the class of techniques based on fractional distillation in which azeotropic behavior is exploited to achieve separation. Traditionally, the specie that causes the azeotropic behavior is added as a mass separating agent: the entrainer. In some situations it may be present in the feed mixture (self-entraining) of the azeotropic column (Perry et al., 1999 [2]).
Although a large number of studies involve azeotropic distillation, most involve columns in which a third component is added in order to further the separation. Such studies are about choosing the third component, the influence of a thermodynamic model, evaluating the existence of multiple steady states and the study of process control (Laroche et al., 1992 [3]; Bekiaris et al., 2000 [4]; Magnussen et al., 1979 [5]; Rovaglio and Doherty, 1990 [6]; Wang et al., 1997 [7]; Luyben, 2008 [8]; Wu and Chien, 2009 [9]). Another striking feature of the articles cited is that they consider the formation of two liquid phases only in the reflux vessel.
Lao and Taylor (1994) [10] reviewed the literature on the separation efficiency of distillation columns involving three-phase systems, and cite several sources which give rise to their finding that the conclusions drawn on these systems are contradictory. Some studies claim that overall efficiency was not influenced by the number of liquid phases present. Other studies indicate that the introduction of a second liquid phase may have a strong (positive or negative) influence on the mass transfer.
Widagdo and Seider (1996) [11] published one of the most complete (and even to this day, one of the most cited) articles on the azeotropic distillation process. They showed that knowledge contained in the literature is scant both as to a real understanding of the process and the difficulties regarding control of azeotropic columns. They also emphasized the issue of the formation of two liquid phases within the column, but there is no consensus on the efficiency of separation when columns operating with one and with two liquid phases are compared.
In 1997 Wang et al. [7] observed experimentally the formation of two liquid phases inside a column, depending on the reflux and the reboiler heat duty, as well as the presence of multiple steady states; the study evaluated the dehydration of isopropanol, using cyclohexane as the entrainer.
According to Higler et al. (2004) [12], azeotropic distillation is characterized by its operational complexity, due to the possible formation of two liquid phases inside the column. The authors used an equilibrium and a non-equilibrium stage model and claimed the formation of two liquid phases in the distillation column influences the mass transfer process, thus affecting efficiency.
The equilibrium stage model, widely used in modeling and simulating distillation processes, does not represent the reality that few stages actually operate in equilibrium. This problem can be solved by introducing Murphree efficiencies. However, some authors (Cairns and Furzer, 1990 [13]) warned against incorporating Murphree efficiencies into equilibrium stage models of three-phase systems. In fact, the projections may be more accurate if a non-equilibrium stage model is considered. However, calculations are complex, thus requiring more computational time, which is not desirable for control applications. But, the biggest obstacle is that the parameters required to perform the calculations are rarely available.
Junqueira et al. (2009) [14] analyzed the formation of two liquid phases in the azeotropic column in the production of anhydrous ethanol, and, in order to decrease this phenomenon, many process configurations have been studied as well as variations in operating conditions. It was concluded that the formation of the second liquid phase may affect the performance of the column and consequently reduce its efficiency.
Silva et al. (2003) [15] evaluated the dynamics of an azeotropic distillation column similar to the one considered in this article; however, the entrainer was already present in the feed, which was held in the intermediate region of the column, and the formation of two liquid phase occurred only in the reflux vessel.
Guedes et al. (2007) [16] followed the same procedure as the one studied in this paper and, in the steady state, evaluated the process sensitivity relative to the feed temperature; and, dynamically evaluated the influence in feed temperature, including the operation condition with two liquid phases in some plates.
The distillation column considered in this article shows characteristics of an azeotropic distillation, since two liquid phases form in the reflux vessel and, depending on the operation condition, in some stages throughout the column. However, another feature makes the system unconventional: the feed takes place in the reflux vessel. In the research literature few studies have considered systems with these characteristics.
2. Problem Statement
The distillation column considered in this study is part of the purification train of 1,2-dichloroethane (ethylene dichloride-EDC) of a commercial plant which produces vinlyl chloride monomer (VCM).
The process of obtaining EDC occurs through the direct chlorination of ethylene (C2H4), as shown in the reaction: C2H4 + Cl2 ® C2H4Cl2. The EDC product (high purity) leaves the reactor and moves on to the purification system, where it undergoes aqueous washing. Figure 1 shows the flow diagram of the EDC dehydration process, where it can be observed that aqueous washing is conducted in the separating vessel (or reflux vessel). After the top condenser and in the reflux vessel, there are two liquid phases: an organic one, saturated in H2O, and an aqueous one, saturated in organic matter. The organic phase returns to the reflux of the column, while the stream of the aqueous phase is discarded.
Although less volatile than the EDC, the H2O leaves from the top of the column due to the reversal in the value of the constant K (Figure 2), which is due to the fact that H2O forms a minimal azeotrope, not only with the EDC, but with almost all organic compounds present in the process.
Note that in the stream coming from the reactor (FROMR1) there is no H2O, so that during washing, the stream that carries out the reflux of the column (TODRY 2) becomes saturated in H2O.
A close analysis of Figure 1 leads to the conclusion that the system as a whole can be seen as a conventional column (with reboiler, condenser and reflux vessel), with the feed (FROMR1 and WATER) in the reflux vessel. In industry, although the analysis of the degree of freedom indicates two variables will be manipulated, only the reboiler heat duty is used, since the reflux flow rate is used to control the level (organic phase) of the vessel and the distillate flow rate (WASTE) cannot return to the process.
The study by Guedes et al. (2007) [16] aimed at reducing the consumption of energy in the azeotropic column. The question to be answered was: if the reboiler heat duty is the only manipulated variable used, to what extent can it be reduced without compromising the quality of the bottom product (the H2O mass fraction)?
Accordingly, by performing tests in the plant, the reboiler heat duty was gradually reduced, which resulted in plate temperatures (top, middle and bottom) that were much smaller than those observed historically, being indicated. In spite of the amount of moisture in the bottom stream being below the specification (10 ppm), the tests were discontinued after 7 hours of operation, and a new operating condition (lower heat duty) was established.
According to Guedes et al. (2007) [16], a more significant change in the temperature profile occurs because of the formation of a 2nd liquid (aqueous) phase in the plates of the column. And, the good agreement between

Figure 1. Flowsheet of the EDC dehydration process.
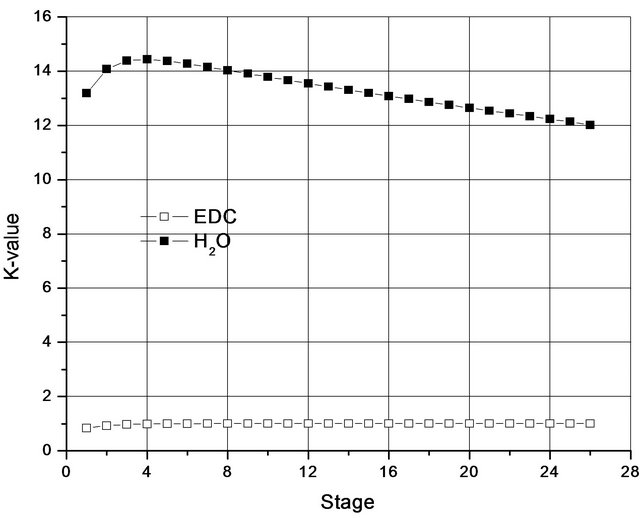
Figure 2. K-values along a column working with a single liquid phase.
azeotropic data (Azeotropic Data, 1973 [17]) and solubility (Dechema, 1990) found in the literature for EDC-H2O and those predicted by the simulations, are the mainstays of this conclusion. However, the simulations were carried out without formally defining an objective function and constraints (optimization). Furthermore, no evaluation of the effect of the possible presence of a 2nd liquid phase in separation was performed. Thus, this study aimed to: formalize optimizing the consumption of energy, and evaluate the efficiency of separation taking two operating conditions into account: without the formation of two liquid phases (Case I) and with the formation of two liquid phases (Case II).
3. Modeling and Simulation
The simulation was performed using Aspen PlusTM commercial simulator. In order to represent the real system, the system was modeled using reboiled absorption, followed by a condenser (Heater) and a decanter (Decanter). To model the column in question, the RadFrac™ routine was used.
The RadFracTM routine detects the possible formation of a second liquid phase (the main component was H2O) at any stage; assumes there is an equilibrium stage model; and uses specified values for stage efficiencies. These efficiencies can be manipulated to adapt to the plant data. In this study, a Murphree efficiency equal to 64% for all plates and 100% for the reboiler was used. In the industrial plant, the column has 25 stages (numbered from top to bottom) and a reboiler type thermosyphon. In the Aspen PlusTM simulator, the pressure in each plate of the column, as well as in the other equipment, is kept constant.
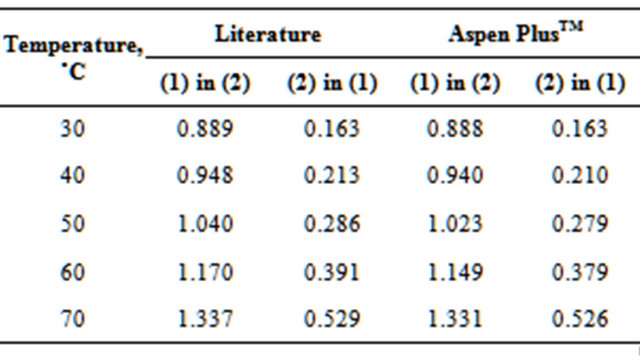
To represent the equilibrium between liquid-liquidvapor phases (ELLV), a γ-φ procedure was used. Even with the column operating under low pressure, the vapor phase was represented by the Redlich-Kwong Equation of State (EOS). The activity coefficient γ was determined from the NRTL model (Perry et al., 1999 [2]), which represents the ELLV system effectively. Tables 1 and 2, respectively, show the comparison between the azeotropic (Azeotropic Data, 1973) and solubility data (Dechema, 1990 [18]) found in the literature for the EDC-H2O system (main components) and those predicted by the simulations.
In order to determine the optimal energy consumption, the objective function (J) to be minimized was defined as the reboiler heat duty (Qr).
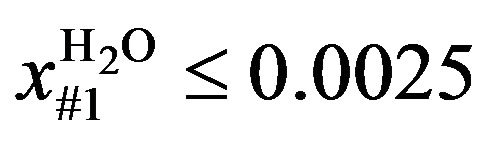
The restriction in the case of optimization without the presence of two liquid phases (Case I) is the mass fraction of H2O in the liquid phase (global): if it was not desired to form two liquid phases over the column, the restriction imposed was 2500 Parts Per Million (ppm) (approximately the saturation value of EDC with H2O at 45˚C) for the first stage (numbered from top to bottom) of the column. The choice of this plate was due to its being found that the formation of two liquid phases starts in this plate.
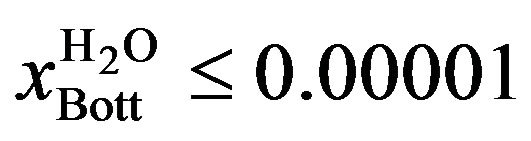
For the operation with two liquid phases (Case II), the restriction imposed was 10 ppm in the bottom stream of the column (the maximum permitted in the plant). Mathematically, the problem was formulated as follows:
 (1)
(1)
Subject to
 (2)
(2)
Or
 (3)
(3)
The optimization procedure considered the distillate flowrate (stream OCSUM1) as the manipulated variable
Table 1. Comparison of azeotropic data for EDC(1)-H2O(2) system.
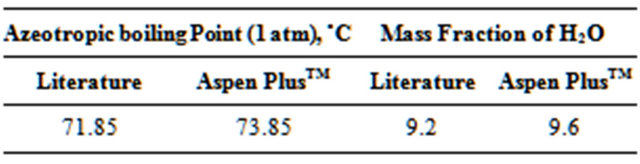
Table 2. Solubility (% weight) of EDC(1)-H2O(2) system.
(OCSUM1). The objective function was inserted via the Analysis/Optimization Model of the Aspen PlusTM tool, which uses the Sequential Quadratic Programming (SQP) search method for the optimum. The restrictions were inserted using the Analysis/Constraint Model.
The procedure can be implemented over the following steps:
1) Fix the number of stages of the column;
2) Specify the value of the distillate flowrate, which will be used as an initial estimate;
3) Insert, via the Analysis/Optimization Model, the objective function and the range over which the variable may be manipulated;
4) Insert, via the Analysis Constraint Model, the restriction and its tolerance.
4. Steady-State Results
A comparison of data from the plant (the historical operating conditions) and those provided by the simulation is shown in Table 3. The good agreement between real and simulated data, in fact, proves the effectiveness of the modeling and the simulation.
Table 4 shows the conditions of the stream from the reactor (FROMR1) and Table 5 presents results for two operating conditions: 1) historical and 2) optimized.
As per Table 5, with the formation of two liquid phases (Case II), the reduction in energy consumption compared with the situation with a single liquid phase (Case I) is 19.4%; a result caused by a decrease in the distillate flow rate.
The final value of the reboiler heat duty was derived and determined after the constraints were optimized. In both cases, the production of “dry” EDC (EDCDRY2) was very similar.
In Figure 3, note the large difference between the temperature profiles for the two optimal situations. For Case I, a significant variation occurs between the 1st and the 5th plate, and then the rate of increase is almost linear from there to the 26th plate (bottom). On the other hand, in case II, the variation in the rate of increase between the 1st and 16th plate is almost linear, and then there are steep increases in this rate until the 24th plate at which point the temperatures in the two cases coincide.
Table 3. Comparison between the real and simulation data (Guedes et al., 2007).
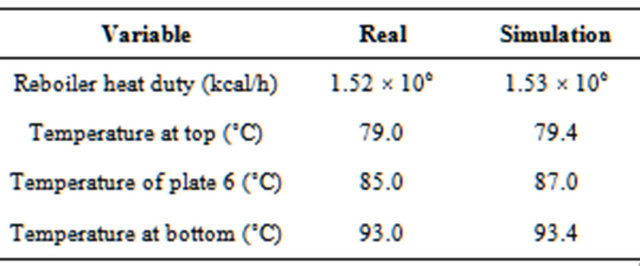
Table 4. Characteristics of the feed (FROMR1).
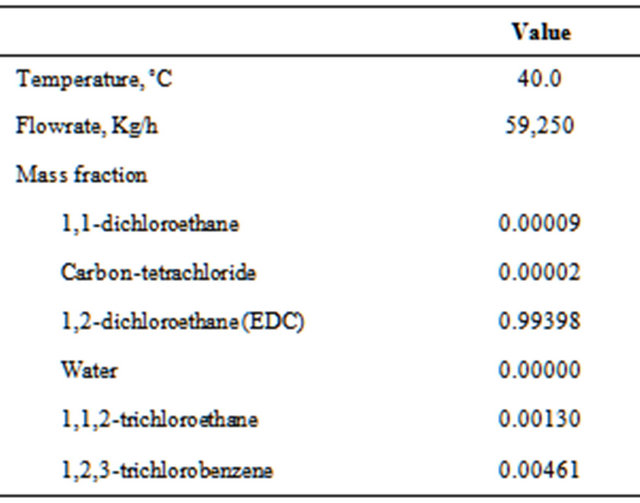
Table 5. Results for two operational conditions.
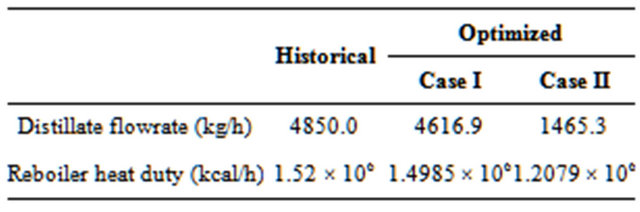
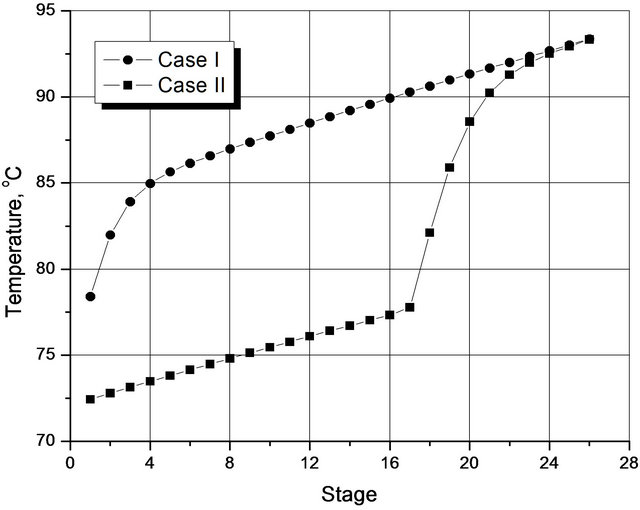
Figure 3. Temperature profiles for the two optimized situations.
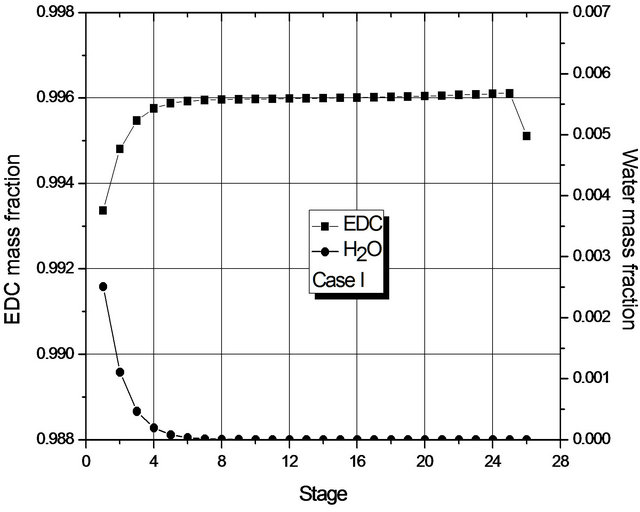
In both cases, the linear behavior of the temperature takes place basically by varying the pressure, since the change in the composition of the species along the column is very small, as shown in Figure 4. Simulations that include a negligible pressure drop along the column show the temperature profiles then remain on plateaus, rather than go straight upward, thus confirming this observation on the result of there being negligible drops in the pressure. The profiles obtained experimentally by Wang et al. (1997) [7] show qualitative forms similar to Figure 3. However, unlike the findings of this study, the
 (a)
(a)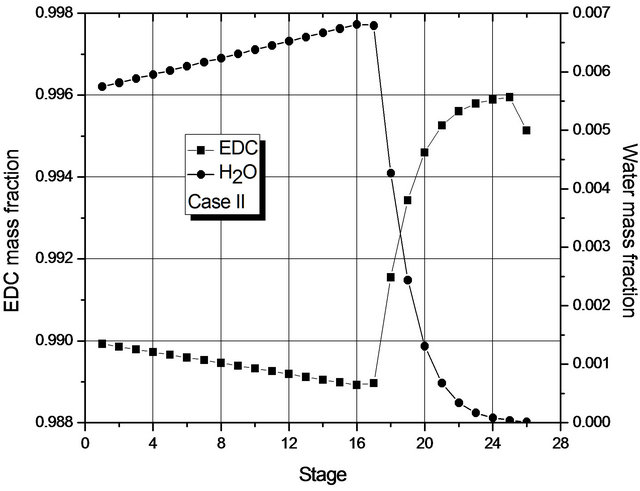 (b)
(b)
Figure 4. (a) Composition profile (EDC and H2O) in the liquid phase (global) for Case I; (b) Composition profile (EDC and H2O) in the liquid phase (global) for Case II.
percentage of H2O present in the feed was high.
Figure 4 shows the mass fraction of EDC and H2O (main components) in each stage, from which it may be seen that, in each case, the mass transfer is at its most significant in different regions of the column: for Case I in the upper region; for Case II, in the lower one. For Case II, the greatest change in composition occurs in the region where the 2nd liquid phase is not present (from the 16th stage on). In fact, in both cases, dehydration mainly occurs in a small region of the column.
Given the low transfer of mass in most of the column, Figure 4 suggests that the number of stages of the column could be smaller. In fact, if the reboiler heat duty is maintained constant, simulations for a column with 19 stages show the presence of a single liquid phase and the fraction of H2O at the bottom is within specification. However, for columns with 18 stages, two phases are present and the liquid fraction of H2O at the bottom (1000 ppm) is above the one laid down in the specification.
The reason for the formation of two liquid phases can be seen in Figure 4. For Case II, in the region of two liquid phases, the maximum mass fraction of H2O is about 0.7% by weight, so it is above the saturation value of the organic phase with H2O. For Case I, the maximum mass fraction of H2O is around 0.25% by weight (approximately the saturation value of EDC with H2O). The behavior of Case II is due to the fact that the decrease in the reboiler heat duty does not prompt the removal of H2O (in the form of azeotrope) in the early stages of the column.
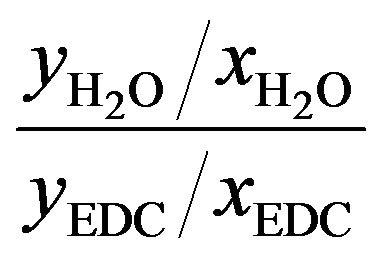
Figure 5 shows the Separation Factor (SF) defined by Equation (4) Perry et al., 1999 [2]) along the column, in which what can be noted is that the separation efficiency is increased when there is a single liquid phase. Even if the second liquid phase is present, the Separation Factor is greater in stages where this phase disappears. From this Figure, note also that, for Case II (a two liquid phase up to plate 16), dehydration occurs in the last few plates. Overall, the magnitude of the Separation Factor measured for Case I (1.15E9) was completely different from that calculated for Case II (235).
 (4)
(4)
The reduction in the SF for Case II may be explained as a direct consequence of the reduction of the reflux flow rate (caused by the decreased flow of distillate), which is usually one of the variables that most impact separations. However, what needs to be taken into account is that a simulation condition which operates immediately before the 2nd liquid phase forms and which involves a minimal reduction in the reflux flow rate, results in an SF of 1.7E9, that is, in the same order of magnitude of that calculated for Case I. This result is in accordance with various citations in the article by Widagdo and Seider (1996) [11] and as pointed out by Junqueira et al. (2009) [15]. That is to say there is a drastic reduction in the separation efficiency of columns operating with two liquid phases in some plates.
The results presented in Figure 5 were obtained after optimizing the reboiler heat duty and assuming a constant Murphree efficiency (64%). Figure 6 shows the global Separation Factor H2O/EDC depending on the Murphree efficiency, without considering the optimization. For operation with a single liquid phase (Case I) a distillate flow rate was set at 3500 kg/h, while the condition for the two liquid phases (Case II), this was set at 1450 kg/h.
From the results of Figure 6, it is possible to note that the operation with a single liquid phase in the plates is much more dependent on the operational efficiency in
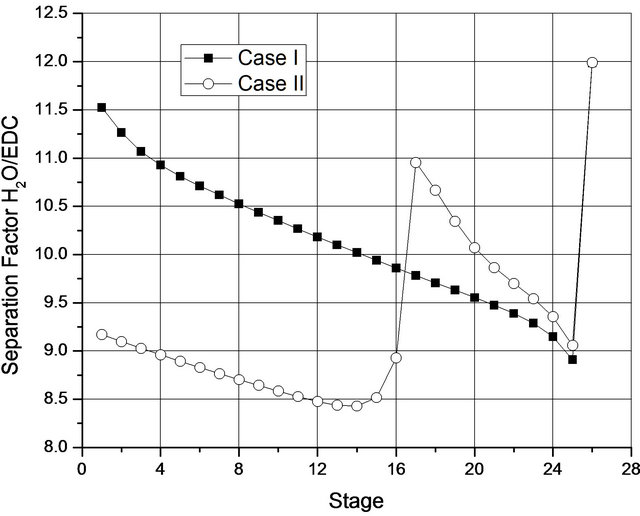
Figure 5. Separation factor H2O/EDC along the column for two optimized situations.
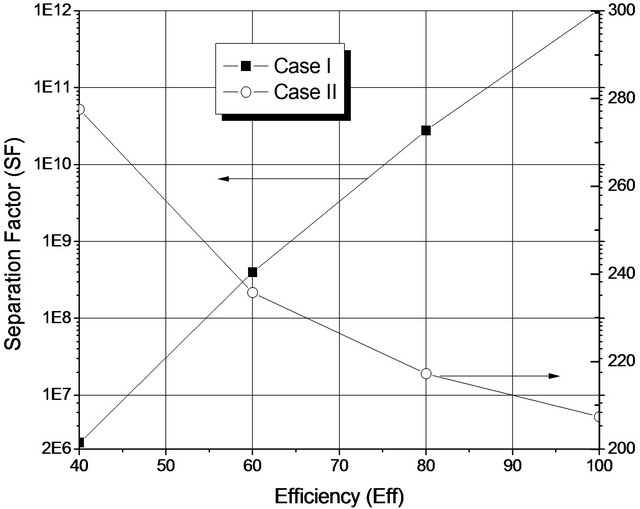
Figure 6. Global separation factor H2O/EDC for two optimized situations.
which some of the column plates have two liquid phases. For Case I, the behavior is similar to that typically observed for distillation columns: separation is directly proportional to the efficiency of the stages. Moreover, where two liquid phases are observed in some plates of the column (Case II), separation decreases when the efficiency of the plate is increased, which is caused by increasing the number of plates with two liquid phases (16 to 18).
5. Conclusions
Using as a case study the dehydration of 1,2-dichloroethane (EDC) of a commercial plant that produces vinyl chloride monomer—VCM, the study aimed to evaluate the separation efficiency for two operating conditions: one with two liquid phases (Case II) and one with a single liquid phase (Case I) throughout the stages of an azeotropic distillation column.
Although very small as a percentage (less than 2.5%), the appearance of the 2nd liquid phase causes significant changes in the operation of the column and the separation achieved.
In each case, the mass transfer is at its most significant in different regions of the column: for Case I, in the upper region, for Case II, in the lower one. In fact, the transfer of mass increases when the 2nd liquid phase is not present, that is, the separation efficiency is increased when there is a single liquid phase present.
It is not a reduction in the reflux that causes the strong decrease in the Separation Factor (Case I compared to Case II); in fact, the drastic reduction in the efficiency of separation is the result of the operation with two liquid phases in some plates of the column.
6. Acknowledgements
The authors are grateful to the Brazilian National Council for Scientific and Technological Development (CNPq) for their financial support, and also to Braskem for permission to publish the results of this study.
REFERENCES
- G. Soave and J. A. Feliu, “Saving Energy in Distillation by Feed Splitting,” Applied Thermal Engineering, Vol. 22, No. 8, 2002, pp. 889-896.
- R. H. Perry, D. W. Green and J. O. Maloney, “Perry’s Chemical Engineer’s Handbook,” 7th Edition, McGrawHill, New York, 1999.
- L. Laroche, N. Bekiaris, H. W. Andersen and M. Morari, “The Curious Behaviour of Homogeneous Azeotropic Distillation—Implications for Entrainer Selection,” AIChE Journal, Vol. 38, No. 9, 1992, pp. 1309-1328.
- N. Bekiaris, E. G. Guttinger and M. Morari, “Multiple Steady States in Distillation: Effect of VL(L)E Inaccuracies,” AIChE Journal, Vol. 46, No. 5, 2000, pp. 955-979.
- T. M. Magnussen, L. Michelsen and A. A. Fredenslund, “Azeotropic Distillation Using UNIFAC,” Chemical Engineering Progress Symposium Series, Vol. 56, No. 4, 1979.
- M. Rovaglio and F. M. Doherty, “Dynamics of Heterogeneous Azeotropic Distillation Columns,” AIChe Journal, Vol. 36, No. 1, 1990, pp. 39-52.
- C. J. Wang, D. S. Wong, I.-L. Chien, R. F. Shih, S. J. Wang and C. S. Tsai, “Experimental Investigation of Multiple Steady States and Parametric Sensitivity in Azeotropic Distillation,” Computer and Chemical Engineering, Vol. 21, 1997, pp. S535-S540.
- W. L. Luyben, “Control of the Heterogeneous Azeotropic n-Butanol/Water,” Energy and Fuels, Vol. 22, No. 6, 2008, pp. 4249-4258. doi:10.1021/ef8004064
- Y. Wu and I. Chien, “Design and Control of Heterogeneous Azeotropic Column System for the Separation of Pyridine and Water,” Industrial & Engineering Chemistry Research, Vol. 48, No. 23, 2009, pp. 10564-10576. doi:10.1021/ie901231s
- M. Z. Lao and R. Taylor, “Modeling Mass-Transfer in 3- Phase Distillation,” Industrial and Engineering Chemistry Research, Vol. 33, No. 11, 1994, pp. 2637-2650. doi:10.1021/ie00035a015
- S. Widagdo and W. D. Seider, “Azeotropic Distillation,” AIChE Journal, Vol. 42, No. 1, 1996, pp. 96-130.
- A. Higler, R. Chande, R. Taylor, R. Baur and R. Krishna, “Non-Equilibrium Modeling of Three-Phase Distillation,” Computers and Chemical Engineering, Vol. 28, No. 10, 2004, pp. 2021-2036. doi:10.1016/j.compchemeng.2004.04.008
- B. P. Cairns and I. A. Furzer, “Multicomponent 3-Phase Azeotropic Distillation—Extensive Experimental Data and Simulation Results,” Industrial and Engineering Chemistry Research, Vol. 29, No. 7, 1990, pp. 1349-1363. doi:10.1021/ie00103a040
- T. L. Junqueira, M. O. S. Dias, R. Maciel Filho, M. R. W. Maciel and C. E. V. Rossel, “Simulation of the Azeotropic Distillation for Anhydrous Bioethanol Production: Study on the Formation of a Second Liquid Phase,” Computer Aided Chemical Engineering, Vol. 27, 2009, pp. 1143-1148. doi:10.1016/S1570-7946(09)70411-0
- A. R. Silva, J. H. P. Brooman, L. R. Braga Jr., L. G. S. Vasconcelos and R. P. Brito, “Steady-State and Dynamics Behavior of an Industrial Azeotropic Distillation Column,” The 6th Italian Conference on Chemical and Process Engineering, Pisa, 8-11 June 2003.
- B. P. Guedes, M. F. Figueiredo, L. G. S. Vasconcelos, A. C. B. Araújo and R. P. Brito, “Sensitivity and Dynamic Behavior Analysis of an Industrial Azeotropic Distillation Column,” Separation and Purification Technology, Vol. 56, No. 3, 2007, pp. 270-277. doi:10.1016/j.seppur.2007.02.014
- “Azeotropic Data-III, Advances in Chemistry Series,” In: R. F. Gould, Ed., Advances in Chemistry Series, Vol. 116, American Chemical Society, Washington DC, 1973, pp. 1-6.
- Pennsylvania State University, “Dechema Chemistry Data Series,” Deutsche Gesellschaft für Chemisches Aparatewesen, Frankfurt am Main, 1990.
Nomenclature
NOTES
*Corresponding author.