Journal of Biomaterials and Nanobiotechnology
Vol.3 No.2A(2012), Article ID:18983,11 pages DOI:10.4236/jbnb.2012.322030
Transparent Electrode Materials for Simultaneous Amperometric Detection of Exocytosis and Fluorescence Microscopy
![]()
1School of Applied and Engineering Physics, Cornell University, Ithaca, USA; 2Dalton Cardiovascular Research Center, University of Missouri, Columbia, USA; 3Department of Electrical and Computer Engineering, University of Missouri, Columbia, USA; 4Departments of Biological Engineering and Medical Pharmacology and Physiology, University of Missouri, Columbia, USA.
Email: *kassandra.kisler@usc.edu
Received January 4th, 2012; revised January 19th, 2012; accepted February 6th, 2012
Keywords: Exocytosis; Amperometry; Fluorescence Microscopy; TIRF; Microelectrode; Transparent Electrode
ABSTRACT
We have developed and tested transparent microelectrode arrays capable of simultaneous amperometric measurement of oxidizable molecules and fluorescence imaging through the electrodes. Surface patterned microelectrodes were fabricated from three different conducting materials: Indium-tin-oxide (ITO), nitrogen-doped diamond-like carbon (DLC) deposited on top of ITO, or very thin (12 - 17 nm) gold films on glass substrates. Chromaffin cells loaded with lysotracker green or acridine orange dye were placed atop the electrodes and vesicle fluorescence imaged with total internal reflection fluorescence (TIRF) microscopy while catecholamine release from single vesicles was measured as amperometric spikes with the surface patterned electrodes. Electrodes fabricated from all three materials were capable of detecting amperometric signals with high resolution. Unexpectedly, amperometric spikes recorded with ITO electrodes had only about half the amplitude and about half as much charge as those detected with DLC or gold electrodes, indicating that the ITO electrodes are not as sensitive as gold or DLC electrodes for measurement of quantal catecholamine release. The lower sensitivity of ITO electrodes was confirmed by chronoamperometry measurements comparing the currents in the presence of different analytes with the different electrode materials.
1. Introduction
Neurons release transmitter molecules in a process called exocytosis, wherein membrane bound packets, or vesicles, storing transmitter molecules release their contents into the extracellular space upon stimulation. Many cell types share this release mechanism, including adrenal chromaffin cells, which release the catecholamines adrenaline and noradrenaline [1] and are widely used as a model system to study neuronal exocytosis. Release of catecholamine from chromaffin cells can be measured using the electrochemical technique of amperometry, typically using a carbon fiber microelectrode (CFE) [2]. Upon oxidization, each catecholamine molecule is thought to transfer two electrons to the amperometric electrode [3]. Release from single vesicles is indicated by an amperometric current spike [2], often preceded by a foot signal [4] indicating opening and expansion of the fusion pore [5].
To gain information about the exocytotic mechanism, it is desirable to perform simultaneous fluorescence imaging and electrochemical detection of individual release events. We previously demonstrated that amperometric signals can be measured using opaque platinum microelectrodes patterned on a glass coverslip while simultaneously viewing the release events from labeled vesicles and proteins between the electrodes with fluorescence microscopy on an inverted microscope [6,7] . However, to detect the maximum electrochemical signal and minimize diffusional broadening, it is desirable to have the electrode in direct contact with the release site on the cell membrane [8], which prohibits observation of the same membrane area by fluorescence microscopy when CFEs or opaque surface patterned electrodes are used.
Recently, planar transparent electrodes fabricated from either indium tin oxide (ITO) [9,10] , a transparent conductive material commonly used in flat screen displays, diamond-like carbon (DLC) [11], or thin transparent gold (Au) films [12] have been applied to record catecholamine release from chromaffin cells. ITO electrodes are capable of simultaneous amperometry and fluorescence imaging through the electrodes [10] and allow total internal reflection fluorescence (TIRF) excitation [13] .
Here we report the characterization of transparent planar microelectrode arrays with 12 - 50 µm2 electrode area fabricated from either ITO or thin transparent gold and with 20 µm diameter DLC electrodes. Single exocytotic catecholamine release events from chromaffin cells could be detected amperometrically, including foot signals, indicating the opening and expansion of individual fusion pores, with each electrode material. Simultaneously, release from dye-loaded vesicles could be imaged through the transparent electrodes using the widely used method of epiillumination (through-the-objective) TIRF microscopy [14]. Unexpectedly, amperometric signals measured with ITO electrodes indicated only about half as much charge as events measured with transparent gold or DLC electrodes. Chronoamperometry recordings revealed that this phenomenon is due to a lower detection efficiency of ITO electrodes.
2. Materials and Methods
2.1. Cell Culture
For fluorescence experiments and experiments comparing ITO and Au electrodes, bovine adrenal chromaffin cells were prepared as described [15] and plated on 8 mm diameter coverslips. For an experiment, coverslips with chromaffin cells were rinsed with experimental “buffer” solution consisting of (in mM): 140 NaCl, 5 KCl, 5 CaCl2, 2 MgCl2, 10 HEPES, 10.4 D-Glucose (pH = 7.22 - 7.27, Osm = 297 - 304 mOsm). Coverslips were then placed on a corner of an electrode array and covered, along with the electrodes, with ~150 μL of buffer. Individual healthy looking cells were lifted from the coverslips using a glass micropipette and placed onto electrodes, pressing gently with the pipette tips to stimulate the cells [6]. For fluorescence experiments, cells were incubated in buffer with 3 μM lysotracker green or acridine orange dye (Invitrogen, Carlsbad, CA) for 10 minutes at room temperature in the dark, then rinsed with buffer prior to placing the coverslips on the electrode arrays. Cells were used on days 2 - 5 in culture for experiments involving fluorescence detection and days 2 - 3 for the single- electrode comparison experiments.
For experiments comparing DLC and ITO electrodes, chromaffin cells were cultured in T25 culture flasks with “Hibernate A plus calcium” media (BrainBits LLC., Springfield, IL) at 4˚C in order to reduce cell aggregation and used 1 - 6 days after preparation. In preparation for an experiment, cells were washed from the flask, then spun down at 100 g for 4 min. The supernatant was discarded and the cell pellet was triturated and suspended in 2 ml standard “bath solution” consisting of (in mM): 150 NaCl, 5 KCl, 2 CaCl2, 1.2 MgCl2, 10 HEPES and 11 glucose, pH 7.2. 50 µl of the cell solution was loaded on the microchip device followed by a waiting period of 5 min to allow cell settling. Cells were stimulated to secrete by adding 100 µl of a “high-K+” depolarization buffer consisting of (in mM): 55 NaCl, 100 KCl, 5 CaCl2, 2 MgCl2, 10 HEPES and 10 glucose, titrated to pH 7.2 with KOH.
2.2. ITO Electrode Fabrication on Glass Coverslips
ITO-coated #1.5 glass coverslips (10 ohms per square, approx. 150 - 200 nm thick ITO, 33.1 mm diameter) were purchased from Bioptechs, Inc. (Butler, PA) and patterned using standard photolithography and wet etch techniques in a clean room environment. Coverslips were cleaned with acetone and isopropanol, spin-coated with Shipley S1813 (Marlborough, MA) photoresist (4000 rpm for 30 sec), then pre-baked on a 115˚C hot plate for 60 sec, resulting in a layer of resist approximately 1 μm thick. Conductor patterns were transferred to the resist from custom made masks via contact photolithography using either an ABM (San Jose, CA) or Karl Suss MA6 (Waterbury Center, VT) contact aligner. After exposure the pattern was developed by immersing the coverslips in MF-322 (Shipley) for 20 seconds. The coverslips were then post-baked on a hot plate for 60 sec at 130˚C - 135˚C and descumed in an ozone cleaner (Samco UV-1, Sunnyvale, CA) for one minute to remove any resist residue left behind by the developer in preparation for etching.
The ITO left exposed was then etched away in a solution of 6 M HCl and 0.2 M FeCl3 for 40 minutes [16]. The resist was removed by soaking the coverslips in Microposit 1165 Photoresist Remover (Shipley) for one minute, exposing the ITO conductor pattern. A second layer of photoresist, spun from S1805 (Shipley) resist to ~0.4 μm thickness was patterned, developed and descumed as above on top of the ITO conductors to act as an insulation layer, leaving exposed only the conductor tips, which act as the active electrodes. Additionally, the ozone reportedly enhances the ITO conductivity [17]. A final post-bake on a 130˚C - 135˚C hotplate for 60 sec completed the fabrication. Coverslips were cut to 25 mm squares with a wafer saw (K&S 7100, Fort Washington, PA) or by hand with a diamond scribe before or after fabrication, respectively. Conductive paint (Silver Print II, GC Electronics, Rockford, IL) was applied to the electrode contact pads to enhance the electrical connection to the amperometric amplifiers.
Electrode arrays on coverslips were fabricated in two different geometries. One geometry consisted of four ITO electrodes located at the corners of an ~12 μm square (Figure 1(A)). Individual electrodes had active areas of ~15 - 45 μm2. In the other geometry (Figure 1(B)) single electrodes were approximately circular with active areas of ~12.5 μm2 exposed near the tips of 10 μm wide conductive paths. Example images of ITO electrodes fabriccated in both fourand single-electrode geometries are shown in Figures 1 (C) and (D), respectively. Mean electrode roughness measured with AFM was 3.2 nm.
2.3. Transparent Gold Electrode Fabrication
Transparent gold microelectrodes were fabricated in a cleanroom environment using standard lithography and lift-off techniques on 25 mm square #1.5 thickness glass coverslips (0211 glass, Corning Inc., Corning, NY). Coverslips were cleaned with acetone and isopropanol. P-20 photoresist primer (Microsi, Inc, Phoenix, AZ) and S1813 resist were spun onto the coverslip, then pre-baked and patterned as for ITO. The “tone” of the exposed pattern was reversed using an NH3 image reversal oven (YES 58SM, Livermore, CA) and subsequent exposure of the coverslip to 405 nm light for 60 seconds. The pattern was developed in MF-321 (Shipley) for one minute, then post-baked and descumed as for the ITO arrays. Metals were evaporated onto the coverslips using E-beam evaporation (CVC 4500, Veeco, Plainview, NY), or sputtering (Bal-Tec SCD050, Brookline, NH). A ~2 nm thick adhesion layer of Cr, Ti, or Cu was deposited onto the coverslip, followed by a layer of gold to a final thickness of 12 - 17 nm.
Excess metal was lifted off the coverslip with the photoresist by immersing the patterned coverslip in Microposit- 1165 remover for 2 hours or more, leaving only the metal electrode array pattern on the coverslips. Coverslips were again cleaned with acetone and isopropanol, coated with P-20 primer and S1805 photoresist, pre-baked, patterned and developed as for the ITO arrays above to create an insulation layer. The resulting electrodes had similar geometries and dimensions as the ITO devices (Figures 1(A), (B)). Examples of fourand single-electrode transparent gold devices are shown in Figures 1(E), (F). Mean electrode roughness was 0.5 nm.
2.4. Transparent DLC Electrode Fabrication
DLC electrodes on ITO substrates were patterned using photolithography and etching techniques. ITO-coated glass slides (25 × 75 mm, ~1 mm thick) were purchased from Sigma-Aldrich (St. Louis, MO) and were cleaned with acetone, isopropanol, deionized water, then a 4:1 mixture of sulfuric acid to phosphoric acid for 10 min. The substrate was blow dried with air and baked on a hot plate for two minutes to remove any remaining moisture. DLC was subsequently deposited on the ITO surface using
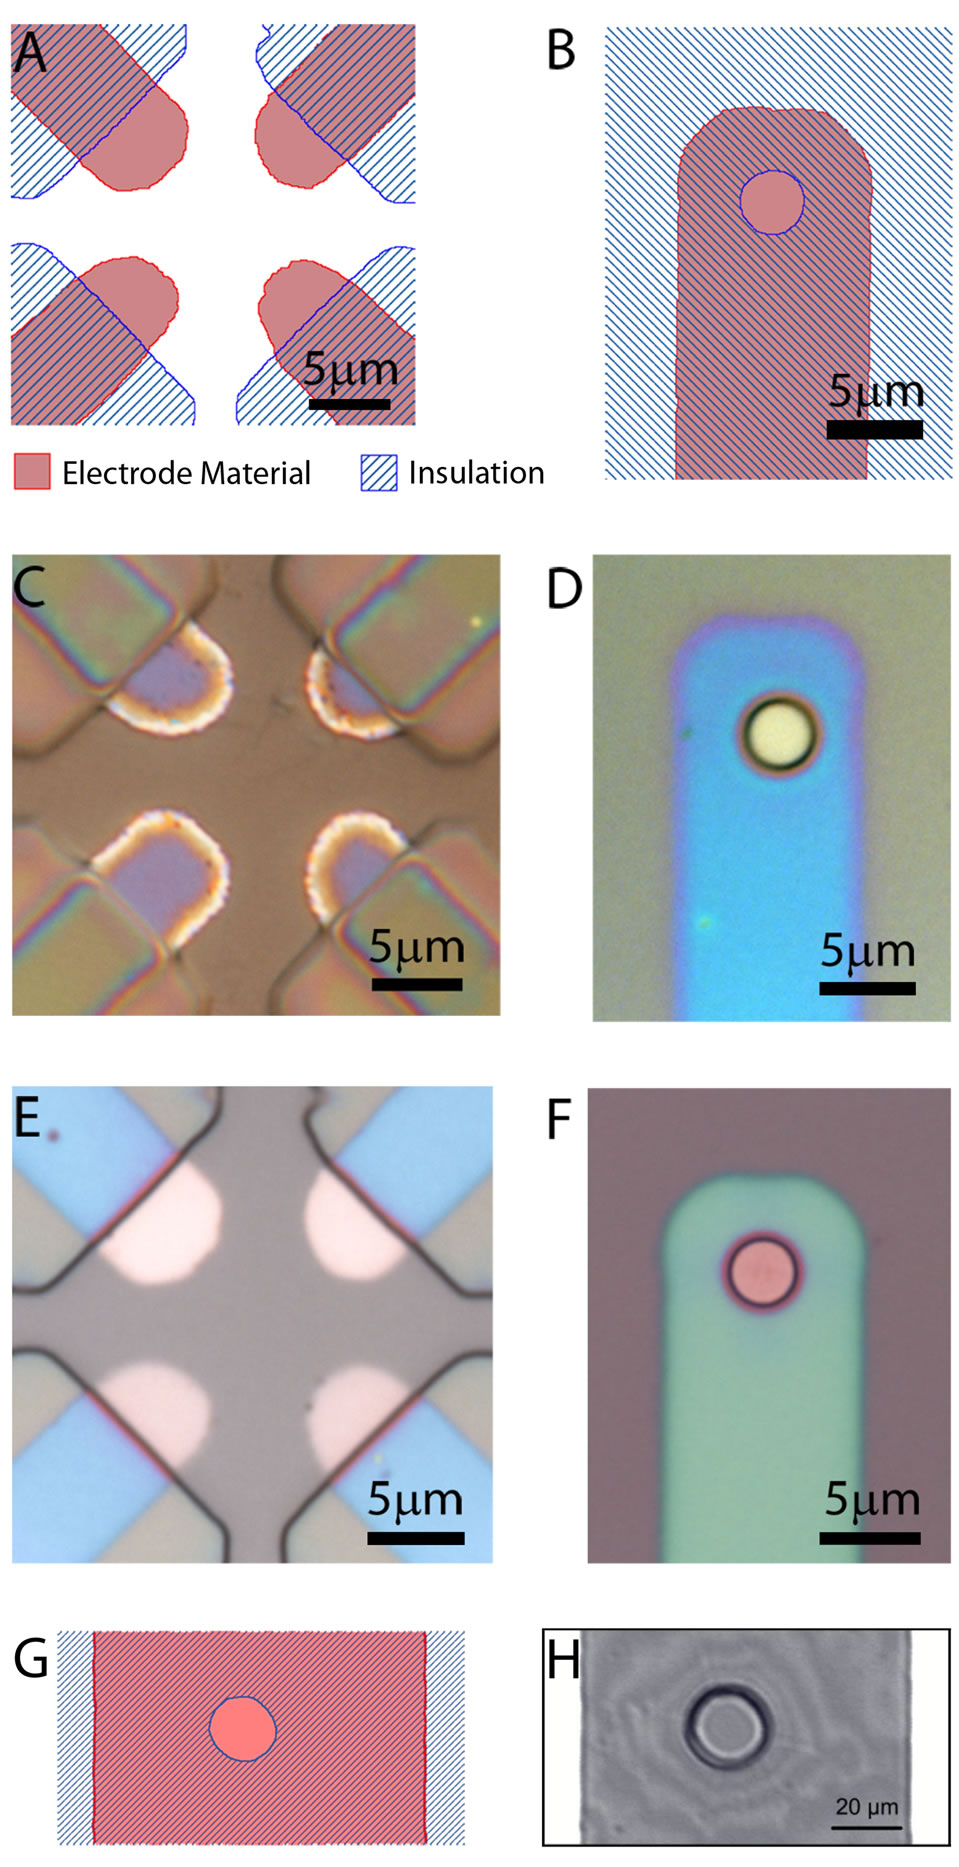
Figure 1. Schematic diagrams of ITO, transparent gold and DLC amperometric electrode geometries. ITO and gold electrodes were fabricated in both the four-electrode (A) and single-electrode (B) geometries. Electrodes are indicated in red and the insulation (photoresist) in a blue pattern; (C, D) Color differential interference contrast (DIC) images of ITO fourand single-electrode devices fabricated on glass coverslips. The bright fringes around the edges of the ITO electrodes in (C) are caused by a change in thickness near the edges of the electrodes due to the fabrication process; (E, F) Color DIC images of ultrathin gold electrodes fabricated in both geometries (A, B) on glass coverslips; (G) Schematic of DLC electrode fabrication geometry; (H) DIC image of a DLC electrode.
magnetron sputtering (ATC 2000-V, AJA international Inc., North Scituate, MA) with a graphite target at 300 watts DC power at 400˚C for 1 hr, with a pressure of 2 mTorr and gas flows of 10 sccm Ar and 2 sccm N2. The thickness of the DLC film was ~40 nm.
The DLC coated substrate was then cleaned with isopropanol, deionized water and air-dried. Shipley S1813 was spin-coated onto DLC substrates at 2500 rpm for 1 min resulting in a thickness of ~2 µm, then baked on a hot plate at 115˚C for 2 min. Electrode patterns were transferred to the DLC substrate by exposing the photoresist to UV light through a high-resolution (20,000 dpi) transparency mask (CAD/Art Services Inc., Bandon, OR) then developed in diluted 1:4 M351:H2O (MicroChem Corp, Newton, MA) for 1 min. The exposed DLC was then removed via air plasma etch at the High RF level for 15 min in a plasma cleaner/sterilizer (PDC-32G, Harrick Scientific Corp., Pleasantville, NY). The ITO exposed after the DLC etch was removed by wet etching as above [16] for 30 min. The photoresist was then removed using PRS-3000 stripper (J.T. Baker, Phillipsburg, NJ) exposing the resulting DLC-on-ITO electrode pattern. Finally, the patterned device was rinsed with deionized water and dried with compressed air. We used the thick photoresist SU-8 2025 (MicroChem Corp) both to fabricate electrode-bottomed microwells and to insulate the remaining areas of the conductive DLC wires, shown schematically in Figure 1(G). SU-8 was spin coated at 4000 rpm for 1 min to yield a film thickness of ~16 μm and subsequently baked at 65˚C for 3 min, then 95˚C for 5 min on hot plates. A second high-resolution transparency mask was used to define single 20 µm diameter microwell/electrode openings over each conductive wire and openings over each connection pad. Following manual mask alignment under a microscope, the photoresist was exposed to UV light, then post-baked at 65˚C for 1 min and 95˚C for 5 min on hot plates. The photoresist was then developed with SU-8 Developer (MicroChem Corp) for 10 min with mild agitation. Finally, the device was baked on a hot plate at 150˚C for 30 min to seal small cracks on the surface of the SU-8 film. A finished single DLC microwell/ electrode is shown in Figure 1(H). Mean DLC electrode roughness is 1.4 nm [11]. For comparison of DLC to ITO electrode responses, ITO electrodes were fabricated as above for the DLC devices in the configuration shown in Figure 1(G), omitting the DLC deposition and etching steps.
A PDMS gasket (Sylgard 184, Dow Corning, Midland, MI) was fabricated to confine the solution containing cells to the area where the working electrodes are located. A PDMS slab was cut into a rectangle with an inner opening of 8 × 5 mm and outer dimensions of 20 × 12 mm. The gasket was then placed at the appropriate location on the chip and the assembly treated with air plasma for 1 min at medium power to enhance the gasket seal to the chip.
2.5. Transmission Spectroscopy
Transmission spectra of cover slips coated with the different electrode materials were measured using a UV/ Vis/Near-IR spectrophotometer (Shimadzu UV-3101PC, Columbia, MD). Thickness of the surface coats was determined by atomic force microscopy (AFM) measurements (Veeco Dimension 3100, Woodbury, NY).
2.6. Electrochemical Recording and Analysis of Quantal Release
Electrochemical measurements were made as described previously for Platinum ECD arrays [6] using either a single-channel (EPC-10, HEKA, Lambrecht Germany) or four-channel amperometric amplifier (VA-10M, NPI, Tamm, Germany). Unless otherwise indicated, electrodes were held at 700 mV vs. Ag AgCl reference electrode. Data was low pass filtered at 500 Hz and acquired at a 5 kHz sampling frequency. For measurements comparing DLC versus ITO electrodes, signals were filtered at 2.9 kHz and sampled at 10 kHz. If needed, amperometric recordings were digitally filtered with a 60 Hz notch filter to remove line frequency interference using Igor Filter Design Lab 4 for Igor Pro (WaveMetrics, Lake Oswego, OR). The amperometric spike parameters reported were determined for all individual non-overlapping amperometric spikes with amplitude >2 pA using Amperometric Spike Analysis software as described [18]. Each cell included in the analysis had a minimum of four analyzable events. The mean amperometric spike parameters were calculated separately for each cell. Subsequently the values obtained for the different cells measured with one particular electrode material were averaged providing a mean value where the number of samples (n) equals the number of cells, not the number of measured spikes. This method prevents spurious artifacts from cell-to-cell variability [19]. Student’s t-tests were used to determine significance of differences in spike parameters between different electrode materials. For characterization of amperometric spikes recorded by ITO and gold electrodes only cells not labeled with fluorescent granule markers were used.
2.7. Chronoamperometry
Determination of the apparent number of electrons transferred from different analytes to the electrode was performed following the method described by Ciolkowski et al. [3]. The current after a voltage step from –0.2 V to 0.5 V was measured in the presence of a test analyte and the background current obtained from the electrolyte solution (150 mM NaCl, 10 mM HEPES, pH 7.3, no test analyte) was subtracted. The value of this Faradaic current was determined at 5 s after the step, a time where the current had settled to a nearly constant diffusion-limited value, Ilim = 4nappFDCre, where napp is the apparent number of electrons transferred from the analyte, F is Faraday’s constant, D is the diffusion coefficient for the analyte, C is the analyte concentration and re is the electrode radius. For these measurements surface patterned electrodes with re = 10 µm radius were used and CFEs with re = 5 µm. However, since the actual geometries vary somewhat, paired measurements were done comparing two analytes with the same set of electrodes to determine the ratio of the Ilim values. For analytes with similar diffusion coefficients as used here [20,21] , the ratio should equal the ratio of napp [3].
2.8. TIRF Imaging
A modified inverted Zeiss Axiovert 135 TV microscope capable of objective-based TIRF was used for these experiments. Fluorescence excitation was provided by a 100 W Hg arc lamp (HBO 100W/3, Osram, Danvers, MA), with 480/40 nm excitation filter, 505 nm dichroic and 535/30 nm emission filters (Chroma Technology, Rockingham, VT). An annular blocker placed at a plane conjugate to the back focal plane of the objective served to block out all “non-critical” light entering the objective for TIRF [22]. A Zeiss plan-fluar 1.45 NA 100x oil emersion objective was used to observe the bottom of the cells in TIRF illumination.
Note that due to the thickness and high index of refraction of the ITO and DLC layers, total internal reflection (TIR) occurs at the ITO-liquid or DLC-liquid interface atop the electrodes. For the thin gold electrode devices, provided that sufficient light intensity can pass through the intermediate (gold) layer between the substrate (glass) and liquid mediums, total internal reflection will occur under the same conditions and at the same angles that would be predicted for TIR between the substrate and liquid mediums in the absence of an intermediate layer [22].
TIRF images were recorded using an Andor iXon EMCCD camera (South Windsor, CT) and accompanying iXon software. The camera output signal was recorded in order to synchronize image acquisition with amperometric recordings. One to three sequences of 2000 frames were taken during each fluorescence experiment. Frame acquisition times were 49.76 - 50.78 ms, with a 1.8 ms inter-frame time.
2.9. Image Analysis
With lysotracker green, which accumulates in acidic compartments such as chromaffin granules, a release event was indicated by a sudden decrease in the fluorescence of the vesicle. Acridine orange also accumulates in acidic compartments, but at concentrations such that the fluorescence is partially quenched [23]. A release event from an acridine orange labeled vesicle is indicated by a transient fluorescence increase (flash) as the fluorescent dye dequenches upon leaving the vesicle [24,25] .
Difference images were used to determine the location and timing of release events in the fluorescence images, using custom written programs in V++ (Digital Optics, Auckland, New Zealand) as described [6]. Briefly, the average of ten images immediately prior to a sequence of six images of interest was subtracted from those six images. With lysotracker green, a release event was indicated in the difference images by a sudden localized intensity decrease that persisted over at least three frames. With Acridine Orange, a release event was indicated by a fluorescence flash due to the dye dequenching.
The precise contours of four-electrode ITO arrays used in fluorescence experiments were determined by AFM and then matched to a 2000 frame average of the fluorescence image sequence to properly locate the fluorescently labeled vesicles relative to the electrodes. The contours of gold electrodes could be determined directly from a 2000 frame average image of a fluorescence image sequence. For display purposes, images were contrast adjusted and either median filtered or Gaussian filtered (r = 0.5 pixels) in Photoshop 6.0 (Adobe, San Jose, CA).
3. Results and Discussion
3.1. Transparent Microelectrodes Allow Simultaneous Amperometry and TIRF Imaging of Exocytotic Events
ITO, DLC and ultrathin gold electrode materials each have high optical transmission in the visible range suitable for observing cells through the electrodes. Transmission efficiency of the substrate materials is not only important in terms of the amount of excitation illuminetion reaching the substrate-liquid interface, but in the detection of the fluorescence generated by the excitation light (evanescent field) that must also pass through the substrate material to be detected. The higher the transmission efficiency, the more easily the fluorescence can be detected. Transmission spectra of ITO, transparent gold and DLC are rather flat across the visible range (Figure 2). The 150 nm thick ITO film shows the highest transmission efficiency of ~90% across the visible spectrum, while the transmission of the 13 nm thick gold film was ~50% - 70% and that of the 40 nm thick DLC film was ~40% - 50%.
Simultaneous TIRF imaging and amperometric detection of catecholamine release events were performed using chromaffin cells whose granules were loaded with one of the fluorescent markers lysotracker green or acridine

Figure 2. Optical transmission spectra of transparent electrode materials across the visible and near-visible spectrum for 150 nm ITO (ITO), 13 nm gold with a Cu adhesion layer (CuAu) and 40 nm DLC deposited atop ITO (DLC) as indicated.
orange which both accumulate in acidic compartments. Exocytotic release events detected amperometrically with ITO or gold electrodes were in several cases associated with a fluorescence change observed simultaneously by TIRF microscopy (Figures 3, 4). Figure 3(A) shows an amperometric event recorded with an ITO electrode array from a lysotracker green labeled cell. With such electrode arrays (Figure 3(A) inset) amperometric events may be detected in more than one electrode [6]. The sudden localized loss of fluorescence from the granule marked with an arrowhead is indicated in the simultaneously acquired sequence of TIRF images of the cell surface (Figure 3(B)) and corresponding difference images, which reveal the changes in fluorescence more clearly (Figure 3(C)) as the appearance of a dark spot. This loss of fluorescence reflects release of the fluorescent dye from the vesicle and is coincident with the amperometric measurement of catecholamine release (Figure 3(A)). Figure 4(A) shows an amperometric event recorded by a transparent gold electrode from a cell loaded with acridine orange. In the corresponding TIRF image sequence (Figure 4(B)) and more clearly in the difference image sequence (Figure 4(C)), exocytosis of the fluorescent dye is indicated by a bright flash (transient fluorescence increase) due to the dye dequenching as it was released from the granule. The transient increase in fluorescence intensity again coincides with the amperometric spike (Figure 4(A)).
For Lysotracker green, the main intensity decrease usually occurred in the frame during which the steep rising phase of the amperometric spike occurred and thus the rapid release of catecholamine. When acridine orange was used, the initial fluorescence increase often occurred in the frame subsequent to the frame during which the amperometric spike peak occurred. This delay is likely due to the extra time needed for acridine orange to deaggregate [26] and dequench. Only those events in which there was a clear fluorescence intensity change in the image frame correlating to the steep rising phase of the amperometric spike, or the immediately following frame, were considered to be correlated.
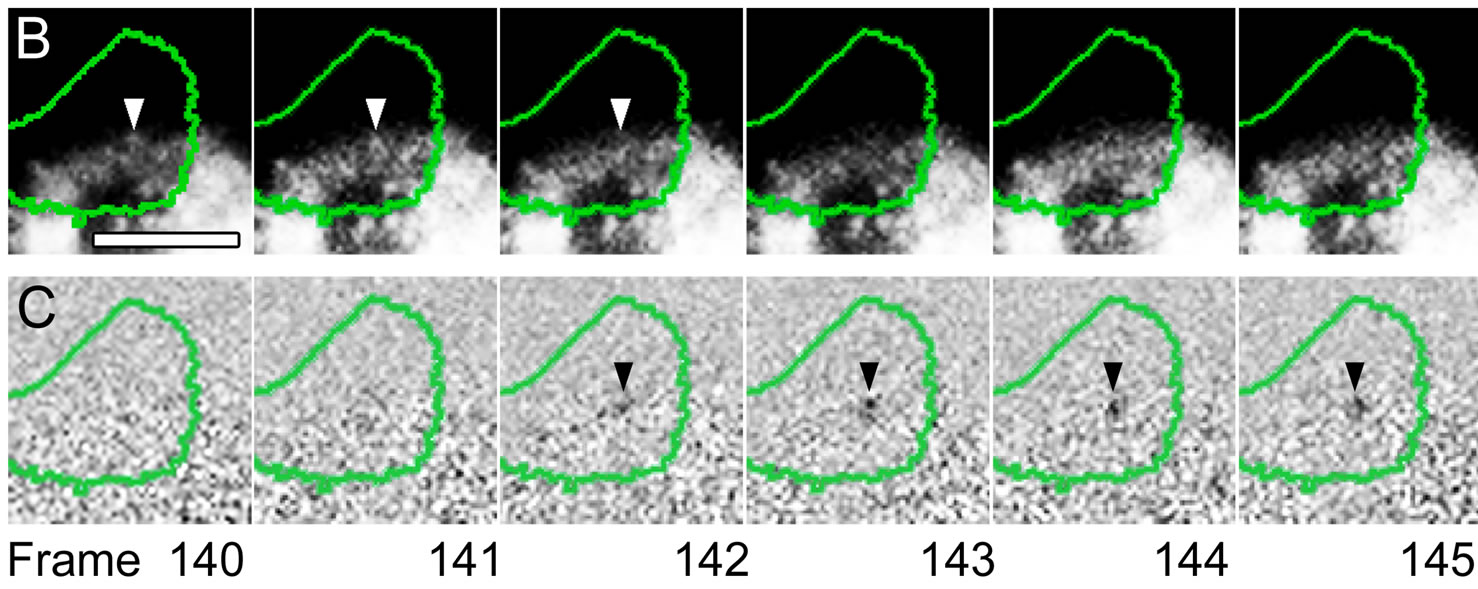
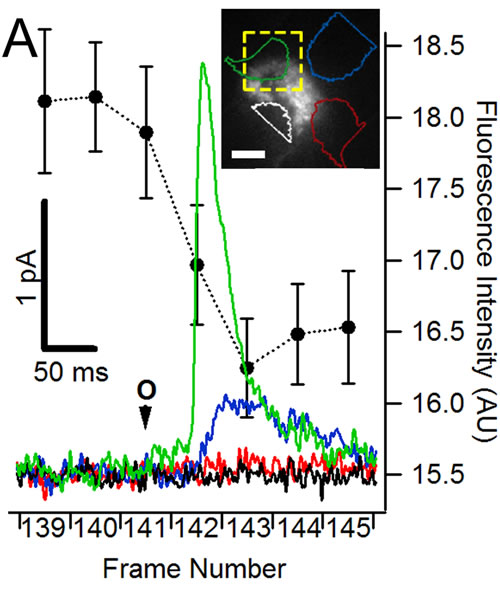
Figure 3. Correlation of amperometry and TIRF imaging for a single vesicle release event from a chromaffin cell loaded with Lysotracker green and recorded with a four-electrode ITO array. (A) Amperometric traces from the four electrodes. The trace colors correspond to the colors of the electrode outlines shown in the inset image of the electrode array. The event was detected primarily by the electrode labeled in green. The initial opening of the fusion pore produces the foot signal visible in the green trace and is indicated by the “O” and arrowhead. The timing of the image sequence is indicated below the current trace and the time course of average intensity determined from a region of interest around the exocytosed vesicle in the area shown in (B) is shown (black data points, error bars are SEM). Inset: the yellow box indicates the area shown in (B) and (C). TIRF images (B) and their corresponding difference images (C) of the cell atop the electrode array. The arrows in the TIRF and difference images indicate the presence of a vesicle in frames 140 - 141, followed by a dark spot appearing over the “green” electrode in the difference images starting in frame 142, indicating loss of fluorescence from a vesicle by exocytosis. The spot appears at the same time as the amperometric spike in the amperometric recording (frame 142). Exposure times were 50 ms; scale bars are 5 μm. Amperometric traces were smoothed for display.
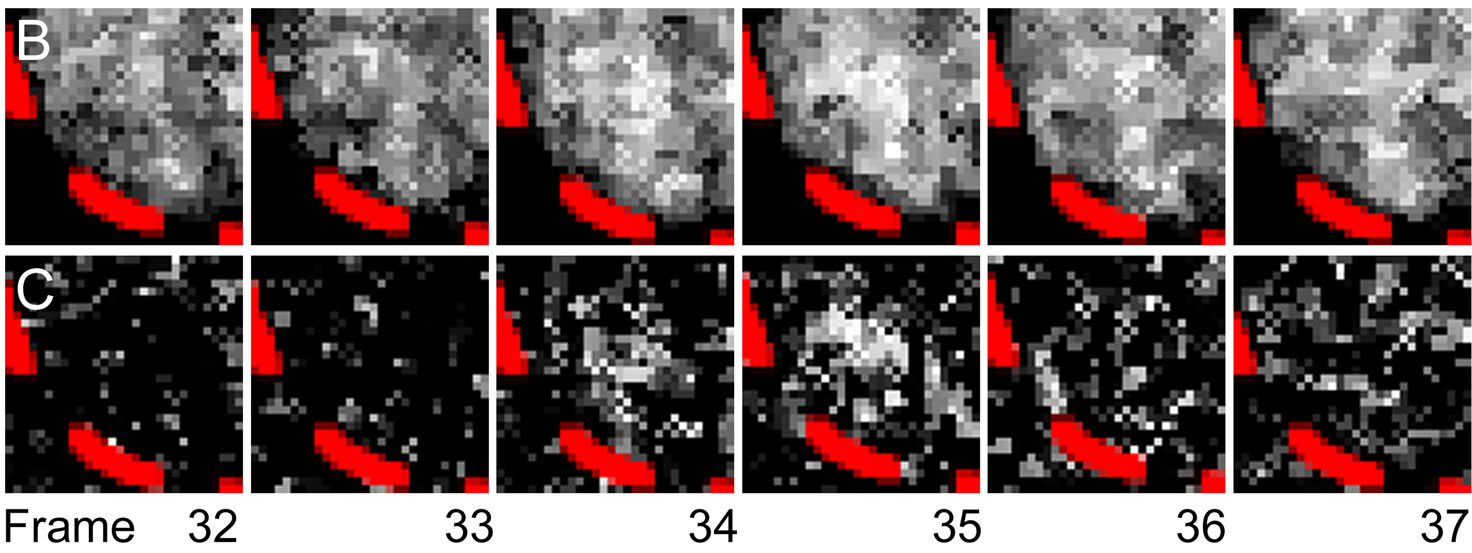
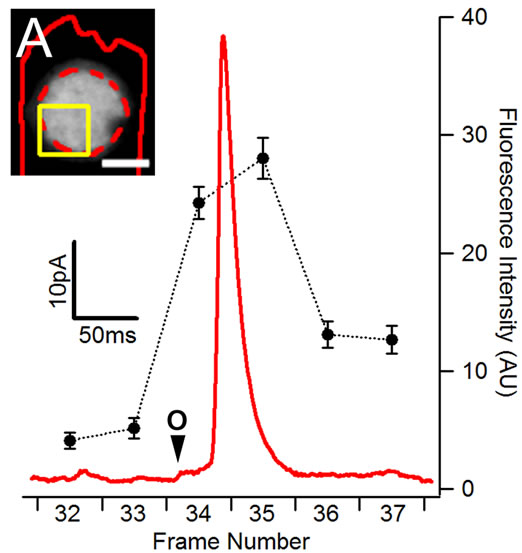
Figure 4. Correlation of amperometry and TIRF imaging for a single vesicle release event from a chromaffin cell loaded with acridine orange and recorded with a single 8 μm diameter transparent gold electrode. (A) Amperometric current spike indicating an exocytotic release event (red trace). The initial opening of the fusion pore is indicated by the “O” and arrowhead. The timing of the simultaneously acquired image sequence is indicated below the current trace and the time course of average intensity determined from a region of interest containing the exocytosed vesicle flash in the area shown in (C) is shown (black data points, error bars are SEM). Inset: image of the electrode used for the recordings. The shape of the patterned transparent gold is outlined by the solid red line. The opening in the insulation layer and thus the active electrode area is outlined by the dashed red line. The yellow box indicates the region shown in B and C. TIRF images (B) and their corresponding difference images (C), obtained by subtraction of the average of the first 100 frames of the image sequence, of the cell atop the electrode show a bright fluorescence flash indicating dye release and dequenching in frames 34 - 35 concurrently with the amperometric spike indicating catecholamine release. Exposure times were 50 ms; scale bar is 5 μm. Amperometric trace was smoothed for display.
On gold microelectrodes ~20% of amperometric spikes were accompanied by a detectable fluorescence event. With ITO electrodes 38% of amperometric spikes were accompanied by a detectable fluorescence event. The differences in the fraction of correlated events between these two materials may be due to factors such as the higher transparency of ITO or differences in dye loading. There are a number of reasons why vesicle fusion may fail to cause a detectable change of fluorescence. Detection often failed when the fluorescent labeling was strong and labeled vesicles were too dense to resolve loss of a single vesicle. On the other hand, when labeling is weaksome vesicles will contain so little fluorophore that they will escape detection. For detection of an exocytotic event with Lysotracker only vesicles that have been tethered at the membrane for at least 0.5 sec before exocytosis were reliably detected in the fluorescence difference images. For acridine orange the dequenching flash must last for at least two frames to be counted. For both dyes the critical feature to observe is the initial fluorescence change that occurs on a time scale similar to that measured with amperometry. Note that the fluorescent molecules are not oxidizable and must diffuse away from the release site instead of being rapidly consumed by oxidation at the electrode surface as are the catecholamines [6].
3.2. Amperometric Spike Analysis Reveals Different Quantal Size for Different Electrode Materials
Examples of amperometric events detected with single microelectrodes fabricated from the different transparent electrode materials are shown in Figure 5(A). These current responses clearly reveal a pre-spike feature, or foot signal, for all three materials. In each case, the onset of the foot signal (indicated by arrowheads) indicates the opening of a narrow fusion pore. The onset of the amperometric spike corresponds to the rapid expansion of the fusion pore [5].
Performing simultaneous measurements of release from chromaffin cells using an ITO electrode at the bottom and a CFE at the top of the cells, Amatore, et al. [27] found that the release events at the cell bottom were less frequent, had slower kinetics and had about 2.5 times the charge than events at the apex. Differences in amperometric spike properties may, however, also be due to the use of different electrode geometry and electrode material.
To compare the properties of amperometric responses recorded from the cell bottom with the different electrode materials, each amperometric spike was characterized by three parameters: 1) the integrated charge (quantal size) of the amperometric current spike, 2) its half width and 3) the spike amplitude as indicated in Figure 5(A). Our results obtained from experiments using paired, identical electrode geometries indicate that ITO electrodes report a significantly lower quantal size than transparent gold and DLC electrodes. Events detected by ~12.5 μm2 ITO and gold electrodes (Figure 1(B)) yielded average quantal charges of 0.48 ± 0.10 pC and 1.11 ± 0.24 pC and average amperometric spike amplitudes of 6.7 ± 1.2 pA and 14.4 ± 2.7 pA. Both values were thus reduced by approximately one-half for ITO compared to gold electrodes.
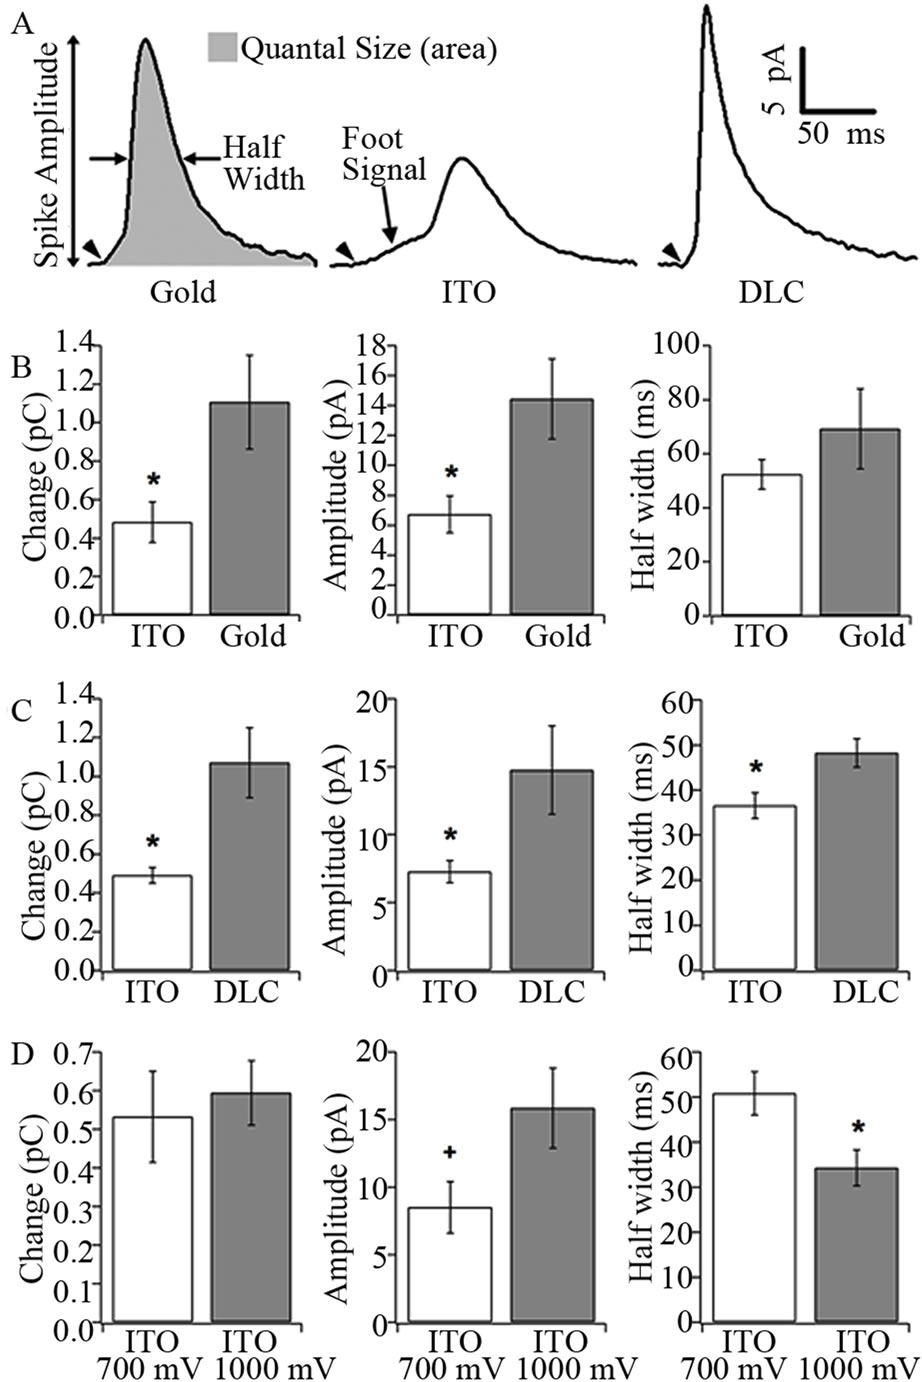
Figure 5. Amperometric events recorded with transparent gold, ITO and DLC electrodes (A). Examples of amperometric spikes recorded with each electrode material. Amperometric spike parameters quantified for statistical analysis are indicated on the gold electrode trace. Note the foot signals indicating the initial opening of fusion pores (arrowheads). Traces were smoothed for display purposes. (B-D) Statistical analysis of amperometric spike charge (left), amperometric spike amplitude (middle) and amperometric spike half width (right); values are given in the text. (B) Comparison of amperometric spike parameters obtained for ITO vs. transparent gold electrodes, n = 13 cells for ITO and n = 9 cells for transparent gold. (C) Comparison of amperometric spike parameters obtained for ITO vs. DLC electrodes, n = 15 cells each. (D) Comparison of amperometric spike parameters recorded with ITO electrodes held at 700 mV (n = 7 cells) vs. 1000 mV (n = 8 cells). Error bars are ±SEM, * indicates p < 0.035, + indicates p < 0.07.
In contrast, the average amperometric spike half widths of 52.4 ± 5.5 ms (ITO) and 69.2 ± 14.7 ms (transparent gold) were not significantly different (Figure 5(A)). Amperometric spikes detected by ~310 μm2 area (Figure 1(G)) DLC and ITO electrodes yielded average quantal charges of 1.07 ± 0.18 versus 0.49 ± 0.04 pC, average amperometric spike amplitudes of 14.74 ± 3.25 versus 7.27 ± 0.80 pA and spike half-widths of 48.18 ± 3.10 versus 36.58 ± 2.84 ms, respectively (Figure 5(C)). Thus, the average spike charge and amplitude detected by ITO electrodes were again about one half that of DLC electrodes with relatively small, but significant, changes in spike half width. This unexpected result is in contrast to the results of Amatore et al. [27], who found that the events recorded with ITO at the cell bottom had larger quantal size than events recorded at the top with a CFE. Our results suggest that ITO electrodes may have a lower detection efficiency and that the difference in quantal size between release at the bottom and the apex may be even larger.
Because ITO is a doped semiconductor, it could be susceptible to voltage drops across the interface between the amplifier and the ITO contact pad due to a difference in work functions of the ITO and metal contacts [28], sometimes called “non-ohmic” connections. This would cause the potential at the ITO electrode-solution interface to be lower than the applied potential. If the potential drop at the contacts were large enough, it could result in incomplete oxidation of catecholamines. An increase of the electrode potential would drive the reaction towards completion and consequently increase the measured apparent quantal size. We thus compared the amperometric signals detected by ITO electrodes at our standard potential of 700 mV to those detected with ITO electrodes held at 1000 mV. Data from single ITO electrodes held at 700 and 1000 mV yielded average amperometric spike charges of 0.53 ± 0.12 pC versus 0.59 ± 0.08 pC, average spike amplitudes of 8.5 ± 1.9 pA versus 15.8 ± 2.9 pA and amperometric spike half widths of 50.8 ± 4.8 ms versus 34.3 ± 4.0 ms, respectively, (Figure 5(D)). Whereas the kinetics of the amperometric spikes were apparently accelerated at 1000 mV, consistent with Chow and von Rüden’s predictions [29], there was no significant difference in the apparent quantal size of catecholamine release and hence no net effect on detection efficiency. Therefore the lower quantal charge reported by ITO electrode appears to reflect a lower cataecholamine detection efficiency due to an inherent material property, not a drop in electrode voltage.
To characterize the detection efficiencies of the different electrode materials we performed chronoamperometry measurements comparing the responses in the presence of one of four different test analytes at 100 µM concentration [3]. Such measurements were made for norepinephrine (NE), epinephrine (EP), 3,4-dihydroxybenzylamine (DHBA, a catecholamine that does not undergo cyclization) and ferrocenecarboxylic acid (FcA, a substance that transfers only one electron during oxidation). For all three surface patterned electrode materials as well as CFEs napp for DHBA determined from the DHBA/FcA Ilim ratio was ~2 as expected (Table 1). For NE and EP the napp values were determined from the Ilim ratios of

Table 1. Apparent number of electrons napp transferred from the different analytes to the different electrode materials. All values are mean ± SEM from 4 - 5 measurements.
NE/DHBA and EP/DHBA, respectively. For NE, napp was consistent with 2 electrons transferred for Au, DLC and CFEs but was significantly reduced to 1.56 for ITO electrodes. For EP, napp was increased to 2.5 - 2.7 for Au and DLC electrodes, presumaby reflecting cyclization associated with additional electron transfer, which proceeds much faster for EP compared to NE [3]. For CFEs, napp remained at ~2 and for ITO napp was 1.52. The results for CFEs are in excellent agreement with those of Ciolkowski et al. [3] in that all catecholamines tested transfer 2 electrons to CFEs. In contrast, the detection efficiency of NE and EP with ITO electrodes is significantly lower than with DLC and Au electrodes. According to these results, the ratio napp(ITO)/napp(Au) is ~0.6 for EP and ~0.7 for NE, suggesting that the lower quantal charge of individual release events determined with ITO electrodes reflect a lower detection efficiency of the ITO electrodes.
There are several possible explanations for the decrease
in catecholamine detection efficiency on ITO. One possibility is that about half of the electrons generated upon oxidizing catecholamines are consumed by reducing ITO [30] and are therefore undetected by the recording amplifier. This appears unlikely because detection of DHBA is as efficient with ITO as it is with other electrode materials. It is more likely that ITO surfaces are more sensitive to adsorption of the chemical byproducts of oxidized catecholamines [31]. Such an adsorbed film may lower the electrochemical reactivity of the ITO surface. Another possibility is that ITO’s electron transfer efficiency (the rate at which electrons are transferred into the ITO during a redox reaction) is lower than that of other electrode materials [32,33] . Whatever the cause, the apparent quantal size of amperometric spikes recorded with ITO electrodes is lower than that recorded with other electrode materials. ITO is a complex material and the determination of the chemical mechanism that reduces the efficiency of ITO electrodes to detect NE or EP remains to be determined.
Whereas thin gold films have high electrochemical detection efficiency and reasonable transparency, this material is not without drawbacks. Because of the small thickness necessary for sufficient transparency, gold films are not as mechanically robust as thicker ITO or DLC films. In addition, the thin gold film can easily be lost upon oxidation in Cl–-containing solutions when potentials greater than ~0.8 V are applied (e.g., [34]). Thus, while gold electrodes may not be perfectly stable over long periods of time, they are quite suitable for single-use experiments such as those shown here.
Our results show that ultrathin gold and DLC are preferred transparent electrode materials for detection of quantal exocytosis. Both can be made moderately transparent for observation of cells through the electrodes, as demonstrated with TIRF imaging through gold electrodes and demonstrate a higher sensitivity to catecholamine oxidation compared to ITO. A particular advantage of microfabricated planar electrodes is that they can be fabricated with virtually any size and geometry and, as shown here, in arrays that allow multiple single cell recordings or recordings from multiple sites of a single cell. Here we chose to simply load the vesicles with a fluorescent marker. The method will be useful for studying differential release of various fluorescent vesicle markers in relation to the amperometrically detected catecholamine release as well as for studying the dynamics of fluorescently labeled proteins implicated in the fusion mechanism before, during and after fusion. This combination of amperometry with high resolution imaging will thereby provide information that could not be obtained with amperometry or fluorescence imaging alone.
4. Acknowledgements
We thank Joan Lenz for her excellent technical support and assistance and Jonathan Shu of the Cornell Center for Nanoscale Systems and the Cornell Center for Materials Research for assistance with the AFM and spectrophotometer. This material is based upon work supported in part by the Nanobiotechnology Center, an STC Program of the NSF under Agreement No. ECS- 9876771, FlexEBio IGERT NSF 0654112 and NIH grants R01NS048826, R01GM085805, R01MH095046, T32GM007469 and T32GM008267. This work was performed in part at the Cornell NanoScale Facility, a member of the National Nanotechnology Infrastructure Network, which is supported by the NSF (Grant ECS- 0335765).
REFERENCES
- R. E. Coupland, “The Natural History of the Chromaffin Cell,” Longmans, Green and Co, London, 1965.
- R. M. Wightman, J. A. Jankowski, R. T. Kennedy, D. T. Kawagoe, T. J. Schroeder, D. J. Leszczyszyn, J. A. Near, E. J. Diliberto Jr. and O. H. Viveros, “Temporally Resolved Catecholamine Spikes Correspond to Single Vesicle Release from Individual Chromaffin Cells,” Proceedings of the National Academy of Sciences of the United States of America, Vol. 88, No. 23, 1991, pp. 10754- 10758. doi:10.1073/pnas.88.23.10754
- E. L. Ciolkowski, K. M. Maness, P. S. Cahill, R. M. Wightman, D. H. Evans, B. Fosset and C. Amatore, “Disproportionation during Electrooxidation of Catecholamines at Carbon-Fiber Microelectrodes,” Analytical Chemistry, Vol. 66, No. 21, 1994, pp. 3611-3617. doi:10.1021/ac00093a013
- R. H. Chow, L. V. Rüden and E. Neher, “Delay in Vesicle Fusion Revealed by Electrochemical Monitoring of Single Secretory Events in Adrenal Chromaffin Cells,” Nature, Vol. 356, 1992, pp. 60-63. doi:10.1038/356060a0
- A. Albillos, G. Dernick, H. Horstmann, W. Almers, G. Alvarez de Toledo and M. Lindau, “The Exocytotic Event in Chromaffin Cells Revealed by Patch Amperometry,” Nature, Vol. 389, No. 6650, 1997, pp. 509-512. doi:10.1038/39081
- I. Hafez, K. Kisler, K. Berberian, G. Dernick, V. Valero, M. G. Yong, H. G. Craighead and M. Lindau, “Electrochemical Imaging of Fusion Pore Openings by Electrochemical Detector Arrays,” Proceedings of the National Academy of Sciences of the United States of America, Vol. 102, No. 39, 2005, pp. 13879-13884. doi:10.1073/pnas.0504098102
- A. N. Ngatchou, K. Kisler, Q. Fang, A. M. Walter, Y. Zhao, D. Bruns, J. B. Sorensen and M. Lindau, “Role of the Synaptobrevin C Terminus in Fusion Pore Formation,” Proceedings of the National Academy of Sciences of the United States of America, Vol. 107, No. 43, 2010, pp. 18463-18468. doi:10.1073/pnas.1006727107
- T. J. Schroeder, J. A. Jankowski, K. T. Kawagoe, R. M. Wightman, C. Lefrou and C. Amatore, “Analysis of Diffusional Broadening of Vesicular Packets of Catecholamines Released from Biological Cells during Exocytosis,” Analytical Chemistry, Vol. 64, 1992, pp. 3077-3083. doi:10.1021/ac00048a003
- X. Sun and K. D. Gillis, “On-Chip Amperometric Measurement of Quantal Catecholamine Release Using Transparent Indium Tin Oxide Electrodes,” Analytical Chemistry, Vol. 78, No. 8, 2006, pp. 2521-2525. doi:10.1021/ac052037d
- C. Amatore, S. Arbault, Y. Chen, C. Crozatier, F. Lemaitre and Y. Verchier, “Coupling of Electrochemistry and Fluorescence Microscopy at Indium Tin Oxide Microelectrodes for the Analysis of Single Exocytotic Events,” Angewandte Chemie International Edition in English, Vol. 45, 2006, pp. 4000-4003. doi:10.1002/anie.200600510
- Y. Gao, X. Chen, S. Gupta, K. D. Gillis and S. Gangopadhyay, “Magnetron Sputtered Diamond-Like Carbon Microelectrodes for On-Chip Measurement of Quantal Catecholamine Release from Cells,” Biomedical Microdevices, Vol. 10, 2008, pp. 623-629. doi:10.1007/s10544-008-9173-8
- K. Kisler, B. Kim, K. Berberian, Q. H. Fang and M. Lindau, “Transparent Microelectrode Arrays to Study Exocytosis,” Biophysical Journal, Supplement, 2007, pp. 83A-84A.
- A. Meunier, O. Jouannot, R. Fulcrand, I. Fanget, M. Bretou, E. Karatekin, S. Arbault, M. Guille, F. Darchen, F. Lemaitre and C. Amatore, “Coupling Amperometry and Total Internal Reflection Fluorescence Microscopy at ITO Surfaces for Monitoring Exocytosis of Single Vesicles,” Angewandte Chemie. International Edition in English, Vol. 50, 2011, pp. 5081-5084. doi:10.1002/anie.201101148
- A. L. Stout and D. Axelrod, “Evanescent Field Excitation of Fluorescence by Epi-Illumination Microscopy,” Applied Optics, Vol. 28, No. 24, 1989, pp. 5237-5242. doi:10.1364/AO.28.005237
- T. D. Parsons, J. R. Coorssen, H. Horstmann and W. Almers, “Docked Granules, the Exocytic Burst and the Need for ATP Hydrolysis in Endocrine Cells,” Neuron, Vol. 15, No. 5, 1995, pp. 1085-1096. doi:10.1016/0896-6273(95)90097-7
- X. Chen, Y. Gao, M. Hossain, S. Gangopadhyay and K. D. Gillis, “Controlled On-Chip Stimulation of Quantal Catecholamine Release from Chromaffin Cells Using Photolysis of Caged Ca2+ on Transparent Indium-TinOxide Microchip Electrodes,” Lab Chip, Vol. 8, 2008, pp. 161-169. doi:10.1039/b715308m
- J. S. Kim, R. H. Friend and F. Cacialli, “Surface Energy and Polarity of Treated Indium-Tin-Oxide Anodes for Polymer Light-Emitting Diodes Studied by ContactAngle Measurements,” Journal of Applied Physics, Vol. 86, No. 5, 1999, pp. 2774-2778. doi:10.1063/1.371124
- E. V. Mosharov and D. Sulzer, “Analysis of Exocytotic Events Recorded by Amperometry,” Nature Methods, Vol. 2, 2005, pp. 651-658. doi:10.1038/nmeth782
- T. L. Colliver, E. J. Hess, E. N. Pothos, D. Sulzer and A. G. Ewing, “Quantitative and Statistical Analysis of the Shape of Amperometric Spikes Recorded from Two Populations of Cells,” Journal of Neurochemistry, Vol. 74, No. 3, 2000, pp. 1086-1097. doi:10.1046/j.1471-4159.2000.741086.x
- T. Matsue, D. H. Evans, T. Osa and N. Kobayashi, “Electron-Transfer Reactions Associated with Host Guest Complexation-Oxidation of Ferrocenecarboxylic Acid in the Presence of Beta-Cyclodextrin,” Journal of the American Chemical Society, Vol. 107, No. 12, 1985, pp. 3411- 3417. doi:10.1021/ja00298a003
- S. Hsieh and J. W. Jorgenson, “Preparation and Evaluation of Slurry-Packed Liquid Chromatography Microcolumns with Inner Diameters from 12 to 33 Microns,” Analytical Chemistry, Vol. 68, No. 7, 1996, pp. 1212- 1217. doi:10.1021/ac950682m
- D. Axelrod, “Chapter 7: Total Internal Reflection Fluorescence Microscopy,” Methods in Cell Biology, Vol. 89, 2008, pp. 169-221. doi:10.1016/S0091-679X(08)00607-9
- R. M. Williams and W. W. Webb, “Single Granule pH Cycling in Antigen-Induced Mast Cell Secretion,” Journal of Cell Science, Vol. 113, 2000, pp. 3839-3850.
- J. A. Steyer, H. Horstmann and W. Almers, “Transport, Docking and Exocytosis of Single Secretory Granules in Live Chromaffin Cells,” Nature, Vol. 388, No. 6641, 1997, pp. 474-478. doi:10.1038/41329
- J. Avery, D. J. Ellis, T. Lang, P. Holroyd, D. Riedel, R. M. Henderson, J. M. Edwardson and R. Jahn, “A Cell-Free System for Regulated Exocytosis in PC12 Cells,” Journal of Cell Biology, Vol. 148, 2000, pp. 317-324. doi:10.1083/jcb.148.2.317
- S. Clerc and Y. Barenholz, “A Quantitative Model for Using Acridine Orange as a Transmembrane pH Gradient Probe,” Analytical Biochemistry, Vol. 259, No. 1, 1998, pp. 104-111. doi:10.1006/abio.1998.2639
- C. Amatore, S. Arbault, F. Lemaitre and Y. Verchier, “Comparison of Apex and Bottom Secretion Efficiency at Chromaffin Cells as Measured by Amperometry,” Biophysical Chemistry, Vol. 127, No. 3, 2007, pp. 165-171. doi:10.1016/j.bpc.2007.01.007
- Y. Park, V. Choong, Y. Gao, B. R. Hsieh and C. W. Tang, “Work Function of Indium Tin Oxide Transparent Conductor Measured by Photoelectron Spectroscopy,” Applied Physics Letters, Vol. 68, No. 19, 1996, pp. 2699- 2701. doi:10.1063/1.116313
- R. H. Chow and L. V. Rüden, “Electrochemical Detection of Secretion from Single Cells,” In: B. Sakmann and E. Neher, Eds., Single Channel Recording, Plenum Press, New York, 1995, pp. 245-275.
- P. M. S. Monk and C. M. Man, “Reductive Ion Insertion into Thin-Film Indium Tin Oxide (ITO) in Aqueous Acidic Solutions: The Effect of Leaching of Indium from the ITO,” Journal of Materials Science-Materials in Electronics, Vol. 10, 1999, pp. 101-107. doi:10.1023/A:1008955929904
- H. Lee, S. M. Dellatore, W. M. Miller and P. B. Messersmith, “Mussel-Inspired Surface Chemistry for Multifunctional Coatings,” Science, Vol. 318, No. 5849, 2007, pp. 426-430. doi:10.1126/science.1147241
- N. D. Popovich, S. S. Wong, B. K. Yen, H. Y. Yeom and D. C. Paine, “Influence of Microstructure on the Electrochemical Performance of Tin-Doped Indium Oxide Film Electrodes,” Analytical Chemistry, Vol. 74, No. 13, 2002, pp. 3127-3133. doi:10.1021/ac011168l
- K. Hayashi, Y. Iwasaki, T. Horiuchi, K. Sunagawa and A. Tate, “Selective Detection of a Catecholamine against Electroactive Interferents Using an Interdigitated Heteroarray Electrode Consisting of a Metal Oxide Electrode and a Metal Band Electrode,” Analytical Chemistry, Vol. 77, No. 16, 2005, pp. 5236-5242. doi:10.1021/ac050216p
- P. Chen, B. Xu, N. Tokranova, X. Feng, J. Castracane and K. D. Gillis, “Amperometric Detection of Quantal Catecholamine Secretion from Individual Cells on Micromachined Silicon Chips,” Analytical Chemistry, Vol. 75, No. 3, 2003, pp. 518-524. doi:10.1021/ac025802m
NOTES
*Corresponding author.