Journal of Human Resource and Sustainability Studies
Vol.1 No.1(2013), Article ID:29556,7 pages DOI:10.4236/jhrss.2013.11001
A Sustainability Analysis of Namibian Marine Fishery
Department of Fisheries and Aquatic Sciences, University of Namibia, Windhoek, Namibia
Email: takawa@unam.na, fnashima@unam.na
Received February 8, 2013; revised March 12, 2013; accepted March 20, 2013
Keywords: Commercial Fishery; Marine Indicators; Namibia; Sustainability
ABSTRACT
Achieving sustainable development is a major challenge, especially among developing fishing nations which depend more on fisheries resources as a source of food and income. In Namibia, a developing fishing nation, many marine fishery resources were overfished pre-independence. Thus, measures implemented post-independence were aimed at sustainable utilization of fishery resources. This paper gives a sustainability analysis of the Namibian marine fishing subsector using broad aspects of sustainable development such as ecological, socio-economic, and technological aspect. Each aspect is represented by the following indicators: Mean Trophic Levels of landings, value of landings, contribution to state revenues and Gross Domestic Product as well as type of fishing gear. Indicators were computed using secondary data obtained from the Ministry of Fisheries for the period, 1990-2007. Trends of the ecological indicator suggest an improvement in ecosystem state, which could have led to increasing value of landings and contribution to GDP. Generally, indicators used showed that fishing impacts on the ecosystem state are less and economic performance of the sub-sector was good; especially notable is the increasing number of vessels in the hake fishery relative to increase in landings. While there are signs, it is difficult to conclude with absolute certainty whether the development of the Namibian marine fishing sub-sector was sustainable.
1. Introduction
The Namibian Marine fisheries has a history of over exploitation resulted from illegal, unregulated, and uncontrolled fishing from foreign fleets [1] which resulted in decline of some of the Namibian commercial stock. After independence, Namibia had committed itself to rebuilding of its overexploited fish stocks through the implementation of drastic conservation measures and endeavored to adapt the modern trend in fisheries management to its own needs and develop a system based on promoting sustainable development of its sub-sector.
The country’s independence in 1990 came at the time when important environmental issues were high on the agenda globally. Two environmental events close to Namibia’s independence are those in 1987 and 1992. Prior to Namibia’s independence was the concept of sustainable development, which was coined in 1987 [2]. Again, five years later was the United Nations Conference on Environment and Development (or the Rio Conference), which has, through its Agenda 21, made significant contributions to sustainable development. Hence, these events and those before or those that followed have helped shaped environmental governance in Namibia, most likely their influence on drafting and amendment of the Namibian Constitution.
As party to agreements that culminated from these events, Namibia is required to utilize resources in order to meet the needs of present generations without compromising those of the future generations. The Namibian Constitution, through Article 95 (l) clearly sets the scene in promoting sustainable development. Notable Acts that followed were formulated based on this article. For example Part IV in the Namibian Environmental Management Act (No. 7 of 2007) deals with sustainable development [3]. Although meeting the Ministry of Fisheries and Marine Resources (MFMR) objectives is marked with both successes and failures, the fishery management system established during the past 17 years is described by many as successful [4-6]. However, it is not clear whether development of the sub-sector is sustainable. This argument is based on the reasoning that a well-managed fishery, like Namibia’s, does not necessarily guarantee sustainability.
This paper gives a sustainability analysis of the marine fishing sub-sector using a variety of indicators which covers aspects of ecological, socio-economic and technological aspects. Marine fisheries indicators were not even included in the drafting process for Namibia’s core set of environmental indicators [7]. Clearly, a lack of such indicators makes it difficult to measure and assess fisheries sustainability in Namibia.
2. Materials and Methods
2.1. Data and Data Source
A desktop study based on secondary data of eight (8) commercial species caught in Namibian waters namely, Pilchard (Sardinops sagax), Hake (Merluccius capensis and M. paradoxus), Cape horse mackerel (Trachurus capensis), Deep-sea red crab (Chaceon maritae), Rock lobster (Jasus lalandii), Orange roughy (Hoplostethus atlanticus), Cape monk (Lophius vomerinus) and Alfosino (Beryx decadactylus) where obtained from the Ministry of Fisheries and Marine Resources, statistics from 1990 to 2007, available in Annual reports [8].
2.2. Indicators Analysis
A total of seven indicators that fall into broad aspects (ecological, socio-economic and technological) of sustainable development were used to assess the sustainability of the Namibian marine fishery. These indicators are Mean Trophic Levels of Landings (MTL) (as ecological), value of landings, number of registered vessels, contribution to state revenues and GDP (as socio-economic) and type of fishing gear (as technological).
2.3. Ecological Indicators
Landing is the wet weight of fish caught (usually expressed in metric tons) that is brought on land via ports [1]. Landings are recorded at two Namibian ports, at Walvis Bay and Lüderitz by fisheries inspectors under the Directorate of Operations of the MFMR. This is supplemented by catch data collected by fishery observer’s onboard commercial vessels under the Fisheries Observer Agency (FOA). They are processed and managed by the Directorate of Resources Management (DRM) of the MFMR. The landings by each registered fishing vessel are recorded in log forms and are added to the MFMR database each month to obtain the annual landings, which are included in annual reports [8]. The annual total landings of commercial fisheries were summed up and plotted against time (years) in order to observe trends over the reviewed period (1990-2007).
2.4. Trophic Levels and Mean Trophic Levels of Landings
A trophic level (TL) is an expression of the position in a food web that a certain fish species or group of fish occupies [9]. In order to estimate the TL of a fish species, its diet composition and TL of food items should first be determined such that TL can be expressed by the general equation as follows [10]:
 (1)
(1)
1) In the Equation (1), number 1 denotes the first trophic level while mean TL of food items is the average TL of different food items that constitutes a diet. Based on the above general formula, TL of each fishery is computed from the formula below:
 (2)
(2)
2) Where i is the predator on the nth prey j and DCij is the diet composition of the predator (i) and its prey (j).
It follows that, mean TL of landings of each fishery in a year is estimated from the formula:
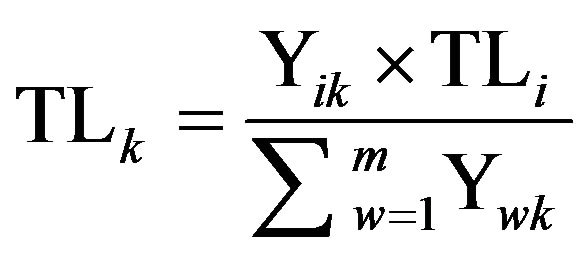 (3)
(3)
3) Where Yik is the landings of a fishery i in year k, TLi is trophic level of that fishery and Ywk is the total landings of all fisheries in year k.
TL is used to calculate the mean TL of landings by multiplying it with landings for each fishery in that year (see numerator in Equation (3)) and dividing it by total landings of all fisheries (see denominator in Equation (3)). The annual mean TL of landings was computed for the fishery over the period under review and plotted against time.
2.5. Socio-Economic Indicators
The value of catch is the annual landings expressed in monetary value before and after processing [8,11]. Landed value, export value and final value were summed up to obtain total value of the fishery. Value of landings is the value of fish in the form it is landed, export value is the value of landings exported while final value represent the value of fish and fish products after processing. The total value of the fishery was plotted against time (in years) and observed trends were used as economic indicators of the performance of the fishing sub-sector. If the value of the fishery is decreasing, this means that either the landings are decreasing or the price of fish is declining [8].
2.6. Contribution to State Revenues
State revenues generated by the sub-sector are via quota fees, marine resources fund, by-catch fees and license fees. This data were obtained from the MFMR annual statistics. Quota fees are paid by registered fishing vessels per quota allocated. Each participant in the fishing subsector is obliged to contribute to the marine resource fund, which is used to supplement MFMR’s fisheries scientific research. By-catch fees are charged per fish bycatches limit exceeded, while license fees are charged per fishing license bought [11]. Since both fees goes to the state, contributions were summed up and expressed as total contribution to state revenue and plotted against time.
2.7. Contribution to Gross Domestic Product (GDP)
The role of any economic sector to the national economy, including the fishing sector is frequently measured in terms of its contribution to the GDP. The contribution to the GDP is merely a measure of the level of output by the sector [8]. This is essentially the gross income earned, wages and salaries, gross profits, and indirect revenues from the fishery production. It does not include intermediary inputs, hence is less than the value of production.
2.8. Number of Registered Fishing Vessels and Type of Fishing Gear
The number of registered fishing vessels can be regarded as an indicator of the fishing effort. The registered fishing vessels were summed up for the entire period and were presented in scatter plot against time. Furthermore, by reclassifying vessels into categories according to the type of fishing operations, it was then used to indicate the type fishing technology. The fishery was classified into nine 9) broad categories according to fishing gears for the entire period to show the number of vessels in each category. These categories are: small pelagic, demersal, long-line, mid-water, large pelagic, crab, rock lobster, monk and deepwater.
3. Results
3.1. Total Landings
The total landings for the fishery were increasing, reaching two peaks in 1994 and 1999 (Figure 1). The highest annual landing of 657,081 tons of fish reached during the entire period was in 1994.
Total landings of the fishery show a general increase from 1990 to 2007. This increase is shown in Figure 1.

Figure 1. Total landings of the fishery during the period, 1990-2007.
The regression (R2 = 0.177) of the best fit line can only explain up to 18% of variation in total landings. The increase in landings and the peak in 1994 can be related to continuing overfishing that existed even post-independence.
3.2. Landing Composition
Landings for the entire period were dominated by three fish species namely horse mackerel, hake and pilchard. Emphasis was placed on these three major commercial species landed, shown in Figure 2.
Total landings composition computed for the fishery for the entire period indicates that a great portion of the landings consisted of horse mackerel (64%) and hake (27%) fish species. Pilchard and monk fish species has contributed 8% and 1%, respectively.
3.2.1. Horse Mackerel
The horse mackerel resource has contributed more in terms of landings during the entire period. For example during the year of 1995-2000, more than 60% of the landings were horse mackerel. Since the peak landing in 1994, horse mackerel landings have been stable. In 2007, there were merely 13 active mid-water trawlers compared to 61 in 1990. This is a poor sign of sustainability considering that horse mackerel is one of the few fish species whose products are available to local and regional markets. If this decline is due to restricted entry into this fishery, there is a need to allow more fishers. If it is due to more costs involved in its fishing operation then there is a need for government intervention [12]. Such intervention can be through subsidies in order to establish good infrastructures.
3.2.2. Hake
The development of hake fishery is described as one of the successful fisheries in Namibia [5]. Landings of hake species made up to 32% of the total landings during the year of 2001-2007. The landings, increased by 7%, compared to only 4% by horse mackerel over the years 1995-
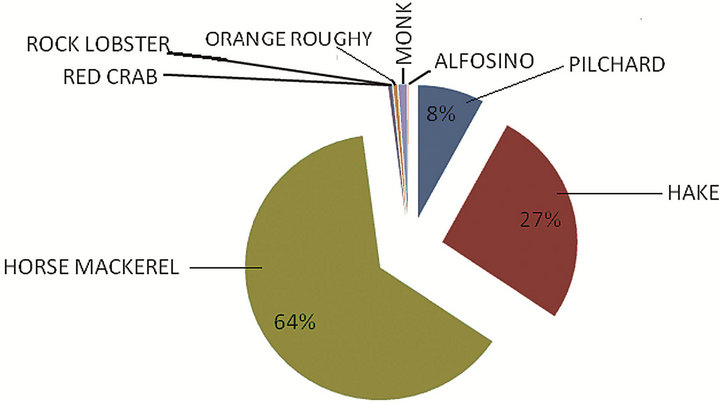
Figure 2. Total landings composition for the fishery, 1990- 2007.
2000. This increase is perhaps due to increase in biomass of the fishable fish (>36 cm) in 2007 [8], which perhaps allowed for increase in the number of registered fishing vessels. The percentage number of vessels in the demersal and long line categories also increased drastically between 1990 and 2007. These developments were all good signs that the resource is not underutilized and is a sign of sustainable development. It is also in line with MFMR’s objectives to develop fishery resources in a sustainable way [13].
3.2.3. Pilchard
Initially, pilchard landings were more than those of horse mackerel and hake species. Considering its current landings, it is argued that higher landings during the year of 1990-1994 were rather due to past illegal fishing. This is because there was a huge decrease in its landings afterwards by more than 36% between 1995 and 2007. This huge decline in landings is most likely due to diminishing numbers of registered vessels (only 9 in 2007 compared to 40 in 1990) is a sign of commitment by MFMR to restore this resource. Unfortunately, these efforts during the past 17 years have not recovered the resource. Small pelagic resources are subject to huge fluctuations. For example in 1980 the Namibian fishing industry was allowed to catch 52,400 tons of the 53,000 tons of the pilchards. Surprisingly, the following year the biomass was 150,000 tons.
3.3. Mean Trophic Levels of Landings
MTL indicates the state of marine ecosystem [14]. The general increasing trends observed in Figure 3, indicates that “fishing down the marine food web” was not taking place post-independence. This is explicitly due to two dominating landings of high trophic species (i.e. horse mackerel and hake). Fishing down the marine food web has been documented in Namibia using landings data spanning 50 years, from 1950-2000 [9].
The difference in findings of the two studies can be due to a number of reasons. In the present study, the dataset is from an entirely different period where the fishery management system is different and it only spans a

Figure 3. MTL of the marine fish species caught during the period 1990-2006.
period of 17 years. More importantly, the computation of the MTL is adjusted such that low trophic levels species are excluded. In addition, the dataset from Willemse’s study comes from a different period where the fishery management regime is different and spans 50 years [9].
MTL depicts a general increasing trend throughout the entire period (Figure 3). The regression (R2 = 0.7483) of the best fit line can explain almost 75% of data variation. Increasing MTL suggest that the Namibian ecosystem is in a good state, since fishing down the food web was not taking place. This can be due to a number of reasons including a successful fishery management system introduced post-independence. The Namibian fishery management system is described by many as successful [6]. In 2008, Namibia ranked among the top ten, out of the 53 fishing nations as compliant with the UN (United Nations) Code of Conduct for Responsible Fishing [4]. Noteworthy, the Namibian dataset for landings is not 50 years yet and the one used for this analysis is merely 17 years. A dataset spanning 50 years is required to construct a reliable trend [14].
3.4. Total Value of Landings
The value of landings can be used as an indicator of the economic performance of the fishery [8]. Total values of landings for the fishery were increasing during the entire period as shown in Figure 4. This can be related to increase in total landings.
Total value of landings for the fishery was increasing for the entire period since independence (Figure 4). The regression (R2 = 0.9793) of the best fit line can explain almost 98% of variation of data.
3.5. Total Contribution to State Revenues
Contribution to state revenues can also be used as an economic indicator [8]. The contribution to state revenues shows a general declining trend, despite the fact that other economic indicators are increasing and can be directly related to less number of registered vessels enter ing the fishery.

Figure 4. Total value of landings of the fishery from 1990 to 2007.
Total contribution of the fishery to state revenues is generally decreasing, with the regression (R2 = 0.467) only explaining 47% of the data variation (Figure 5). This decline in contribution to state revenue is due to the restriction in the number of fishing vessels in the Namibian fishery as a management measure to increase fishing efficiency. Thus, it is argued that it can lead to reduction in state revenues.
3.6. Total Contribution to GDP
The GDP can as well be used as an economic indicator of the sub-sector. Contribution to GDP is an indicator of the level of output within the sub-sector. The contribution to GDP shows a general declining trend (Figure 6).
The fishery’s contribution to GDP has generally decreased (Figure 6), with the regression (R2 = 0.2696) only explains 27% of variation in data. The declining trend in GDP despite increase in total landings, especially during the period of 1990-2000 could be due to lack of equity and unequal distribution of wealth. However, there could be a number of other factors since the regression can merely explain 27% of data variation.
3.7. Total Number of Registered Vessels and the Type of Fishing Gear
The number of registered fishing vessel increased at a slow pace, implying that less new vessels entered the sub-sector. This could be an indication of strict regulations aimed at combating open access fishing which existed in the past. Restricting vessel in the fishery can result in reduction in revenues generated from quotas and license fees.
Increase in total number of registered vessels participating in the fishery was very slow (Figure 7) and was mostly consisting of the demersal fishing (Figure 8). The regression (R2 = 0.0064) only explaining 0% of the data variation. The demersal fishing mostly target two hake species, which, as higher trophic fish species, are predators. Apart from their critical role in the ecosystem as predators, hakes are also commercial valuable species. This paper argues that the increase in the number of demersal trawlers can therefore be a concern for two reasons; bottom trawls are generally regarded as destructive gears as they disturb and modify the seafloor and benthic biological communities. Secondly, increasing number of
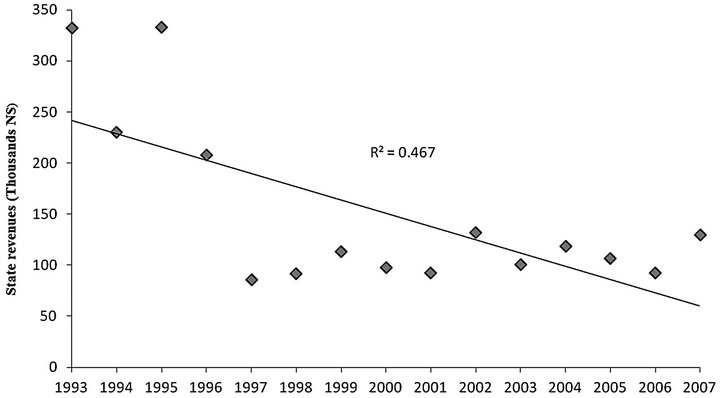
Figure 5. Total contribution to state revenues by commercial fish species, 1993-2007.

Figure 6. Total contribution to GDP by the fishery, 1990-2007.

Figure 7. Total number of registered vessels for the fishery, 1990-2007.
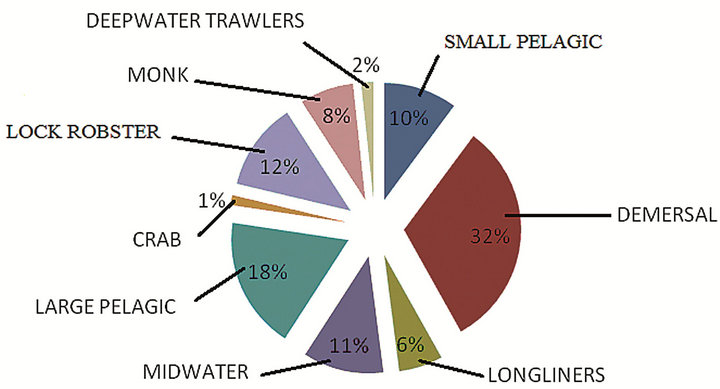
Figure 8. Percentage number of registered vessels per fishery categories, 1990-2007.
trawls vessels targeting higher trophic level species can be a sign that fishing down the marine food web could be probable in the future [15].
The demersal fishing dominated the fishery with 32%. The main target species are hake species (Merlucious capensis and M. paradoxus). This was followed by small pelagic vessels (mostly pilchard), which consisted of 18%. The finding that the number of vessels in the long line fishing category are increasing (i.e. 6%) is a positive sign since impacts of long liners on the ecosystem are less and the fish caught are of good quality compared to those from trawls.
4. Discussion and Conclusion
On the attempt to answer the question whether development of the fishing sub-sector is sustainable several indicators were used for the analysis. It is evident from results that the fishery management system introduced at independence was successful in that, MTL, value of landings and contribution to GDP were increasing. MTL acts as an indicator of the ecosystem health [14]. Increasing value of landings and contribution to GDP are indicators of the socio-economic performance of the fishery [8]. Decreasing state revenues observed, which can be directly linked to restricted entry into the fishery can be interpreted as a sign that Namibia is committed to promote sustainable fishing. This is an achievement for a developing country like Namibia from which other fishing nations should learn.
The changes brought about post-independence, especially as a result of new fishery legislation and other regulations, have had tremendous impacts. For example, impacts on socio-economic development like via decreasing state revenues and compromising new entrants’ chances to benefit. This is the case with the horse mackerel fishery and it is unfair, especially for new entrants the majority of whom are poor Namibians. According to the common definition [2] of sustainable development this is not sustainable. Yet efforts aimed at restoration of the pilchard resource seem to be a waste as this cost is likely to be transferred to future generations. Pearce’s definition [16], stresses that cost of development should not be passed on to future generations. In contrast, development of the hake fishery is sustainable according to Munasiphe [17] in that the resource is not under-utilized. In fact the resource was able to absorb economic shock in 2005. Munasiphe [17] rightly argued that sustainable development should be such that exploitation is allowed as long resilience of socio-economic and ecological structures is maintained.
To simply answer the question whether the development of the marine fishing sub-sector is sustainable is rather subjective. Despite many definitions of sustainable development that can be also confusing, Glavovic [18] questioned whether the idea of sustainable development can necessarily lead to its practice. Even worse, the concept of sustainable development is value-based [19], implying that whether a sub-sector is sustainable entirely depends on these values that tend to change both temporally and spatially. As a result, there is no single answer to this question. Thus, a number of possible scenarios as discussed below may help to provide some answers.
Scenario 1—The majority of indicators are increasing and that indicates that development of the sub-sector is not compromising on chances of future generations to prosper. If this increase in majority of the indicators is considered, then development of the sub-sector was sustainable.
Scenario 2—In terms of species composition, only three major fish species are considered here. Development of the hake fishery can be said to be sustainable. If the hake fishery, which is currently regarded as the backbone of the fishing sub-sector both in terms of landings and value of landings [8], can be used as a representative fishery resource for the whole sub-sector, than its development was sustainable. But as pointed out earlier, this is likely to be based on values that change from individual to individuals and place to place.
By considering indicators used in the analysis, Namibia has made a tremendous progress towards sustainability from which other fishing nations should learn. A good example is the development of the hake resource. There is a need for value addition to fish and fish products, particularly for the most valuable hake fishery. Development of the horse mackerel can be sustainable if more fishing vessels are allowed into the fishery. Resources expended to restore the pilchard resource can be a waste if this resource does not recover. However, there is a need for long time data series. In addition to promoting sustainable fishing, through combating illegal fishing for instance, there is a need to set resources aside to develop tools for promoting, evaluating and monitoring sustainability. Although there are signs, it is difficult to conclude with absolute certainty that development of the Namibian marine fishing sub-sector during the past 17 years was sustainable.
5. Acknowledgements
We are grateful to the Ministry of Fisheries and Marine Resources, Namibia for making the data readily available.
REFERENCES
- D. C. Boyer and I. Hampton, “An Overview of the Living Marine Resources of Namibia,” South African Journal of Marine Science, Vol. 23, No. 1, 2001, pp. 5-35. doi:10.2989/025776101784528953
- Agenda 21, “Rio Declaration on Environment and Development,” 2010. http://habitat.igc.org/agenda21/rio-dec.htm
- Government Gazette of Namibia, “Promulgation of Environmental Management Act, 2007 (Act No. 7 of 2007), of the Parliament,” Government Printer, Windhoek, 2007.
- T. J. Pitcher, D. Kalikoski, G. Pramod and K. Short, “Safe Code? Twelve Years Fishing under the UN CODE,” University of British Columbia, 2008.
- S. Cunningham and T. Bostock, “Successful Fisheries Management Issues, Case Studies and Perspectives,” Aburon Academic Publishers, Amsterdam, 2005.
- M. Meyn, “Namibianization, Exports and Domestic Value Addition in the Namibian Fishing Industry: Chances and Risks of Including Fisheries in the Free Trade Agreement with EU,” Namibia Economic Policy Research Unit, No. 33, 2005.
- Ministry of Environment and Tourism, “Environmental indicators,” 2002. http://www.unep.org/Pearl/Login/OP/BLOBS/FullText/PEARLFullTextBLOB_303_311.pdf
- Ministry of Fisheries and Marine Resources, “Ministry of Fisheries and Marine Resources Annual Report,” Government Printer, Windhoek, 2007
- E. N. Willemse, “Major Trends in the Fisheries Catches off NAMIBIA, 1950-2000,” MSc. Thesis, University of Tromso, Oslo, 2002.
- D. Pauly, V. Christensen, J. Dalsgaard, R. Froese and F. Torres, “Fishing down Marine Food Webs,” Science, Vol. 279, No. 5352, 1998, pp. 860-863. doi:10.1126/science.279.5352.860
- Ministry of Fisheries and Marine Resources. “Ministry of Fisheries and Marine Resources Annual Report,” Government Printer, Windhoek, 2006.
- C. Blat, “The Mid-Water Trawl Industry,” In: Namibian Brief: Focus on Fisheries and Research, No. 20, Clarian Publishers, Windhoek, 1998.
- Ministry of Fisheries and Marine Resources, “Ministry of Fisheries and Marine Resources Annual Report,” Government Printer, Windhoek, 2012.
- D. Pauly and R. Watson, “Background and Interpretation of the Marine Trophic Index as Measure of Biodiversity,” Philosophical Transaction of the Royal Society, Vol. 360, No. 1454, 2005, pp. 415-423. doi:10.1098/rstb.2004.1597
- E. A. Norse, S. Brooke, W. L. William, W. W. L. Cheung, M. L. Clar, I. Ekeland, R. Froese, K. M. Gjerde, R. L. Haedrich, S. S. Heppell, T. Morato, L. E. Morgan, D. Pauly, R. Sumaila and R. Watson, “Sustainability of DeepSea Fisheries,” Marine Policy, Vol. 36, No. 2, 2012, pp. 307-320. doi:10.1016/j.marpol.2011.06.008
- University of Reading, “Definitions,” 2011. http://www.ecifm.rdg.ac.uk/definitions.htm
- M. Munasiphe, “Sustainable Development in Practice,” University Cambridge Press, London, 2009. doi:10.1017/CBO9780511626777
- B. C. Glavovic, “Coastal Sustainability—An Elusive Pursuit? Reflections on South Africa’s Coastal Policy Experience,” Coastal Management, Vol. 34, No. 1, 2006, pp. 111-132. doi:10.1080/08920750500364914
- A. Garasparatos, M. El-Haram and M. Horner, “A Critical Review of Reductionist Approaches for Assessing Progress toward Sustainability,” Environmental Impact Assessment Review, Vol. 28, 2008, pp. 286-311. doi:10.1016/j.eiar.2007.09.002