International Journal of Geosciences
Vol.06 No.09(2015), Article ID:59566,8 pages
10.4236/ijg.2015.69076
Method Research of Earthquake Prediction and Volcano Prediction in Italy
Lijun Chen*, Xiaofeng Chen, Lei Shao
Earthquake Administration of Hunan Province, Changsha, China
Email: *seisman@foxmail.com
Copyright © 2015 by authors and Scientific Research Publishing Inc.
This work is licensed under the Creative Commons Attribution International License (CC BY).
http://creativecommons.org/licenses/by/4.0/


Received 11 July 2015; accepted 10 September 2015; published 14 September 2015
ABSTRACT
This paper adopts the earthquake catalogue of the European Mediterranean Seismological Centre (EMSC), in accordance with the principles of Seismo-Geothermics Theory and the concept of seismic cone; it discusses the integrity of the earthquake catalogue and the overview of Mediterranean seismic cones; it focuses on the structural details and structural feature of the Italian branch of the Mediterranean seismic cone; it deduces the precursory process of subcrustal earthquake activities before two earthquakes magnitude over 6 and the eruptions of Etna volcano since 2005; then it summarizes the prediction working method of Seismo-Geothermics on estimating the general shell strength, the general period, and the rough location of future earthquake or volcano activities; and finally it discusses and explains some possible problems. The principle and working process of this method were testified in card No. 0419 in 2012, the author’s prediction card, which can apply to predict for intracrustal strong earthquakes and volcano activities within the global twenty four seismic cones. The purpose of this paper is to develop the tools and methods of the prediction of future earthquake and volcano.
Keywords:
Seismo-Geothermics Theory, Seismic Cone, Intracrustal Strong Earthquake, Volcano, Prediction, Italy

1. Introduction
Earthquake prediction and volcano prediction are scientific problems recognized worldwide. Although seismic scientists around the world have developed various prediction theories and methods, there is a long way to go as there still exist tough problems to figure out. According to the principle of the Seismo-Geothermics Theory and the concept of seismic cone [1] [2] , which was called as seismic cylinder or seismic mantle plume before this paper [3] -[5] , the author has put forward a set of Seismo-Geothermics earthquake prediction theories and methods scattered in the web of science net “Chen Lijun’s blog”. Using this method, the author presented a prediction card of global crust strong earthquakes (coastal above magnitude 7 and inland magnitude above 6.5 or 6) and volcanoes within the future three years on April 19, 2012 to the relevant government departments. Besides, the author has found some relatively good results through a 3-year test [6] [7] . In this paper, using the European Mediterranean Seismographic Centre (EMSC) earthquake catalogue and taking the Italian seismic cone as an example, the authors studied the spatial distribution image of Italian Seismic Cone, the earthquake focal depth sequence diagram, deduction of intracrustal strong earthquake prediction, the relationship between the monthly frequency of seismic activity in pillar and volcano eruption, and made a clear summary and explanation of the prediction method, hoping to contribute to the method research of future earthquake and volcano.
2. The Seismic Activity in the Mediterranean Region since 2004
EMSC (European-Mediterranean Seismological Centre), founded in 1975, has provided an earthquake catalogue of the Mediterranean and the surrounding areas since October, 2004 to the public. The distribution of all earthquakes magnitude 2 and above obtained from EMSC catalogue is shown in Figure 1.
Figure 1(a) studies the earthquake distribution area. The seismic surface distribution is mainly in accordance with the Mediterranean giant latitudinal tectonic belt advocated by Li Siguang [8] [9] ; so is the distribution of intracrustal strong earthquake magnitude above 6.
Figure 1(b) is the focal depth distribution of earthquake depth 50 km and deeper, which has a great difference between the distribution of surface seismicity, thus making the division of seismic cones. Based on the principle of dividing seismic cones, the deep seismic activity is divided into the Mediterranean seismic cone No.19 and west Mediterranean seismic cone No.20. No.19 is subdivided into 191 Italian branch, 192 Turkey branch and 193 Iran branch (No.193 is partly shown in this figure).
Figure 1(c) is the three-dimensional distribution of all earthquakes in Figure 1(b). Two upright seismic cones with the depth of 690 km in the Mediterranean region can be seen in Figure 1(c), which are located in Sicily, Italy and Aegean Sea respectively. There are also some small unnamed cones.
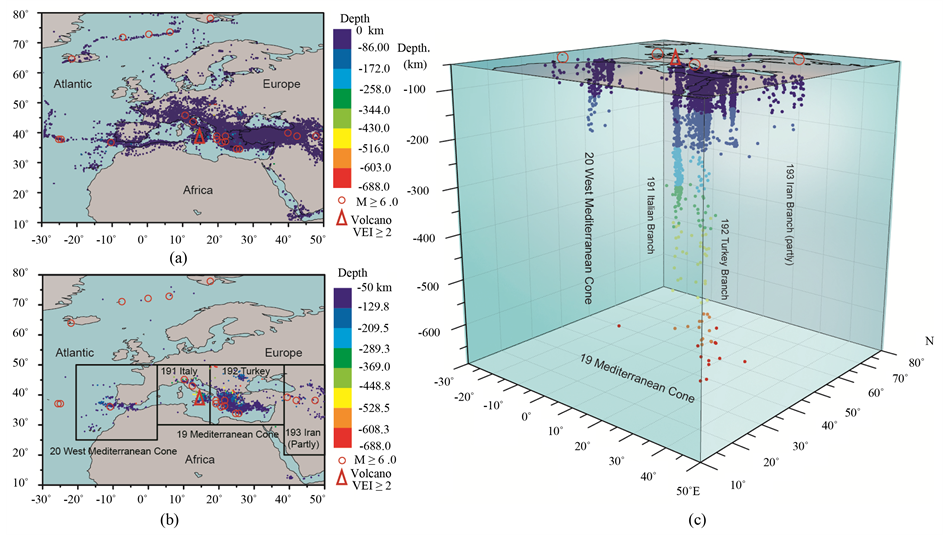
Figure 1. The distribution and the three-dimensional spatial distribution of earthquakes magnitude 2 and above in the areas surrounding the Mediterranean. (By EMSC earthquake catalog, M ≥ 2.0, 2004.10.1-2014.5.28). (a) total earthquakes (2008- 2012, for example); (b) earthquakes of depth h ≥ 50 km; (c) Three dimensional spatial distribution (h ≥ 50 km).
Each seismic branch is also a cone completely independent with all physical attributes and structural attributes, just like other big seismic cones. Therefore, this paper just focuses on the research of Italian branch, hereinafter referred to as the Italian Seismic Cone, in order to facilitate the ideas and methods of earthquake prediction.
3. Study on the Italian Seismic Cone
The influence area of Italian Seismic Cone is from 3˚E - 18˚E, 30N˚ - 50˚N.
3.1. The Spatial Distribution Image of Italian Seismic Cone
In Figure 1(b), the relationship between the distribution of intracrustal strong earthquakes and volcano activity and the distribution of subcrustal earthquakes is clear.
Figure 2 is the distribution of earthquakes of Italian cone in Figure 1(c) by longitudinal and latitudinal profile image. Earthquake colors show different depth, so that the eye. Figure 2 shows the real features of the Italian Seismic Cone. In Figure 2(a), seen from south to north, the cone is a funnel shape at the depth of 100 km and fully erects within the depth of 100 - 300 km, with a skirt shape at the depth of more than 300 km. In Figure 2(b), seen from east to west, the image of the cone is just similar to Figure 2(a) but northward sloping slightly within the depth of 250 - 300 km.
The distribution of earthquakes below 350 km depth is scattered, which may be caused by earthquake location error.
There is evidence that Italian Seismic Cone is an anomaly body of high P wave velocity [3] . It can be predicted from the evolution of its surrounding volcano activity that the abnormal body is declining, moving slowly toward southeast, which in any case could cause the deep cone to move westward and northward.
Figure 2 is a special phenomenon that there is obvious lack of seismic activity below the Etna volcano (37.73˚N, 15˚E) within 50 - 150 km depth, which is likely to be the volcano lava sac location. Etna volcano erupted on August 25, 2010 with the maximum eruption index VEI = 3, and then began erupting again from February 19th, 2013 to February 27, 2014.
3.2. The Earthquake Focal Depth Sequence Diagram in Italian Cone
The earthquake focal depth sequence diagram in Italian cone is shown in Figure 3. Figure 3(a) and Figure 3(b)
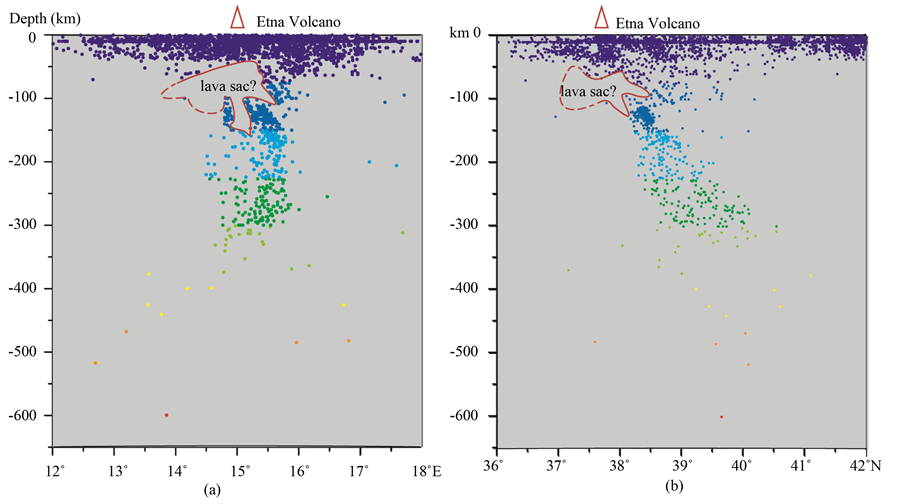
Figure 2. The Longitude distribution and the latitudinal distribution of the Italian cone. (By EMSC earthquake catalog, M ≥ 2.0, 2004.10.1-2014.5.28). (a) Distribution on Longitude; (b) Distribution on latitudinal.
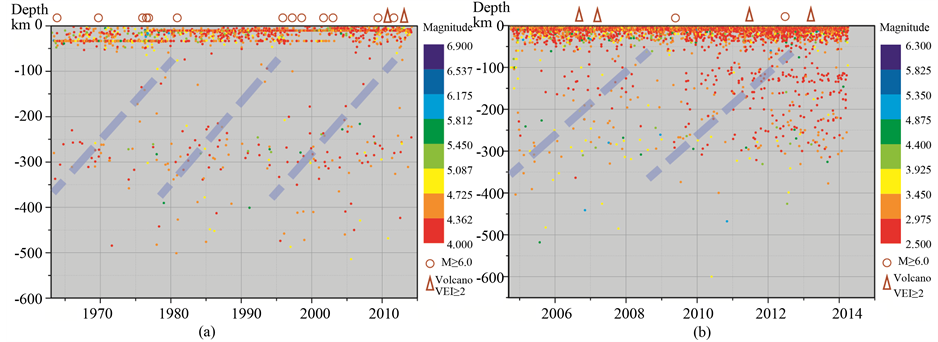
Figure 3. The timing diagram of focal depth in Italian cone. (a) Depth sequence diagram by ANSS catalog, M ≥ 4.0, 1963.1.1-2014.3.29; (b) Depth sequence diagram by EMSC catalog, M ≥ 2.0, 2004.10.1-2014.3.29.
are formed on the basis of ANSS global earthquake catalog and EMSC Mediterranean seismic catalogue respectively. In spite of the inconsistent time duration, the two figures show the characteristic of “driving bottom-up layer by layer” (wide dashed line in the figures) of deep seismic activity in cones because the heat energy caused by the deep earthquake could not be dissipated but passed up layer by layer.
According to such characteristic, one can look for precursory signs of intracrustal strong earthquake by subcrustal earthquake activity; and one can also estimate the intensity of future activity of seismic cone by its historical seismic activity.
3.3. Deduction of Intracrustal Strong Earthquake Prediction in the Italian Cone
In accordance with the above mentioned principle, the author tried to deduce the precursory process of two earthquakes magnitude 6 in Italy since 2009, as shown in Figure 4.
Figure 4(a) and Figure 4(b) depict the earthquake magnitude 6.3 on April 6, 2009 in L’Aquila [10] . Both figures have shown certain similar seismic activities while the L’Aquila subcrustal earthquake activity is dense, which may indicate an imminent strong earthquake.
Figure 4(c) and Figure 4(d) depict the earthquake magnitude 6.1 on May 20, 2012 in Parma. In Figure 4(d), the subcrustal seismic activity in Parma area since January, 2012 is obviously stronger than that in Figure 4(c), which may indicate an impending strong earthquake.
The earthquake activity under lower crust which is at the depth of more than 20 km selected by the same method appears to be more obvious, whereas the disturbance will increase correspondingly (image omitted).
This is a lesson from earthquake prediction in Italy [11] .
3.4. The Relationship between the Monthly Frequency of Seismic Activity in Pillar of Italian Seismic Cone and Volcano Eruption
The Italian Seismic Cone is adopted from 12˚ - 18˚E, 36˚ - 42˚N. The relation between the seismicity of cone of monthly frequency and volcano eruption is shown in Figure 5. In Figure 5, the black solid line is the total frequency (N1) of the pillar body, and the thin line is the subcrustal seismic frequency (N2) below 35 km depth. The general trend of the two curves is in agreement. The thick pillar refers to the volcano eruption time and its eruption index (VEImax, see Table 1). The gray union sets of black solid line and thin line are the forerunner of volcano eruptions [12] [13] .
From Figure 5 and Table 1, before each eruption of Etna volcano, the trend of each monthly frequency is slightly falling after rising, and the time of falling is relatively short from 3 months to 1 month. In Figure 5, before the last volcano eruption, there was unusually strong seismic activity in the cone, and the eruption time was much longer. According to the website http://www.sxdaily.com.cn/, the last eruption of Etna volcano started on February 19, 2013, while in Table 1, it is shown that the last eruption began on September 3, 2013 and ended on February 27, 2014, with its VEI (Volcano Eruption Index) undetermined.
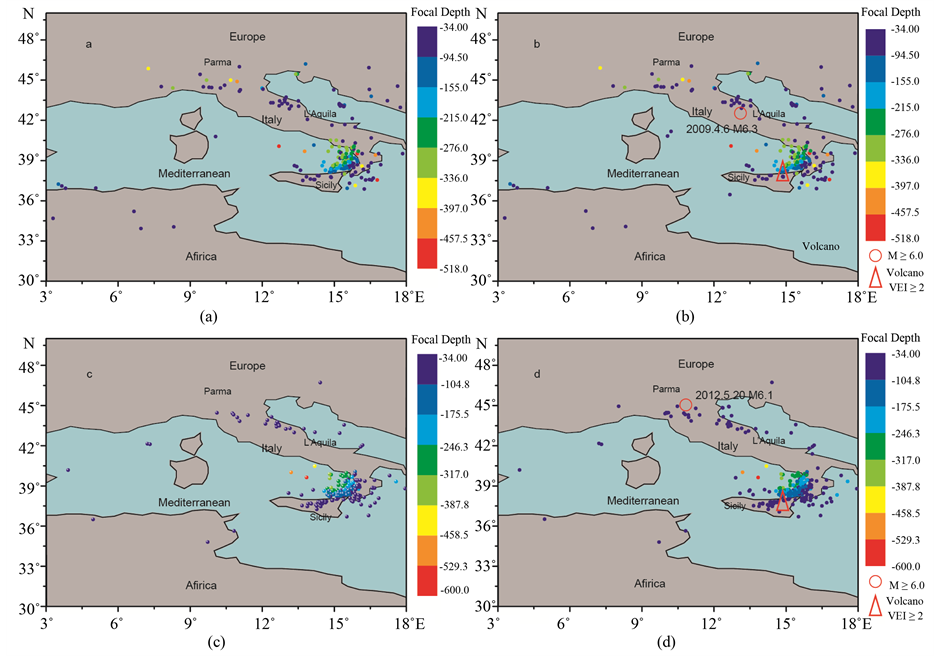
Figure 4. Predicted location map of Italian earthquake and volcano activity. (a) Earthquakes by EMSC catalog, M ≥ 2.0, 2004.10.1-2008.12.31; (b) Earthquakes by EMSC catalog, M ≥ 2.0, 2004.10.1-2009.3.31; (c) Earthquakes by EMSC catalog, M ≥ 2.0, 2010.1.1-2011.12.31; (d) Earthquakes by EMSC catalog, M ≥ 2.0, 2010.1.1-2012.5.11.
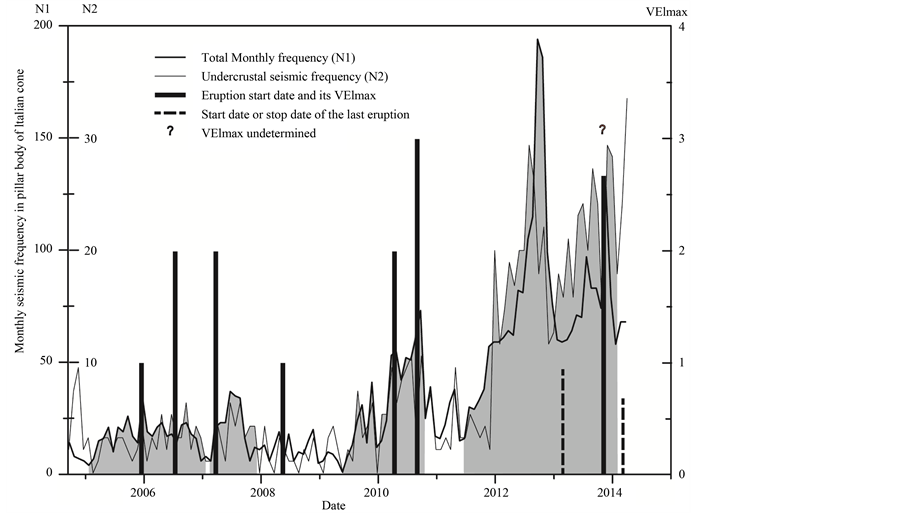
Figure 5. The relationship between monthly frequency of earthquake activity and volcano activity in Italian cone. (By EMSC earthquake catalog, M ≥ 2.0, 2004.10.1-2014.4.26).

Table 1. Etna volcano eruptions since 2005a.
aFrom http://www.volcano.si.edu/volcano.cfm?vn=211060.
4. Working Method of Earthquake and Volcano Prediction
The core idea of earthquake and volcano prediction method in Seismo-Geothermics is mainly observing cone activity and bonding research of the structural system theory put forward by Li Siguang.
4.1. Study on the Process of Defining Seismic Cones
The author divided global deep earthquakes into twenty four seismic cones of which No.19 and No.20 seismic cones have already been confirmed by different earthquake catalogue. Every seismic cone has certain physical properties and structural properties [3] .
4.2. Study on the Activity of Seismic Cones
Activity intensity of seismic cones will be estimated through activity rhythm based on historical earthquakes till the last date in Figure 3, and the maximum activity intensity refers to the maximum magnitude of historical earthquake plus 0.5.
The general period of cone activities will be estimated through “driving bottom-up layer by layer” rhythm in Figure 3. The lower limit earthquake in Figure 3 is demanded to clearly reflect the “driving bottom-up layer by layer” rhythm [14] [15] .
The rough location of seismic cone activity will be estimated through the intensive areas of subcrustal seismic activity in Figure 4 or the lower crust seismic activity.
Volcano eruption time will be estimated by the monthly frequency curve of the pillar body in the seismic cone.
Information about the seismic cone layout, three-dimensional diagram, sequence diagram, Benioff section microtomy and other methods are detailed in “Chen Lijun’s blog”, which will not be explained in this paper [16] -[18] .
4.3. Study on the Intracrustal Structure System
The method in this paper takes the study of intracrustal structure system as the evidence of testifying the subcrustal seismic activity areas. As for intracrustal strong earthquake, structure system is the key to the occurring of strong earthquake in the intensive areas of subcrustal seismic activity [5] [19] .
4.4. Study on the Prediction of Volcano
Both of intracrustal strong earthquake and volcano eruption are like twins, which mean there is a close relationship between them. If the intracrustal strong earthquake is stronger, then maybe the strength of volcano eruption will be weakened and vice versa. Therefore, the author once researched the relationship between earthquake and volcano [20] .
Most seismic cones are upright pillars, and a few are inclined, pointing to the site on the ground. The significant difference between earthquake and volcano prediction lies in that active volcanoes are closer to the site (except mud volcano) whereas most intracrustal strong earthquakes deviate from the site, even reaching to the edge of cone-affected areas. If one can find lava sac location as what Italy did, then one can focus on researching the law of seismic cone activity and volcano eruption.
Following methods mentioned above, the author submitted a medium-term prediction card of global strong earthquake and volcano on April 19, 2012, namely No. 0419 card, which can be found in relevant government departments [6] . The author has made a test in past 3 years [7] . The results show that the earthquake magnitude above 6.5 and volcano eruption in the world in past 3 years nearly all occurred in the given prediction circle or its surroundings, or at least in the active cones estimated by the author.
5. Discussion and Conclusion
This paper introduces the prediction principle and working method of Seismo-Geothermics, and some possible questions are presented and discussed as follows:
5.1. Energy Source of Intracrustal Strong Earthquakes
It has been believed that seismic energy mainly depends on the strain energy accumulation of crustal tectonic movement; however, in the world, more than 95% of intracrustal strong earthquakes and more than 85% of active volcanoes happen within the twenty four seismic cones [5] , suggesting that there is a close relationship between intracrustal strong earthquake and seismic activity in the deep. One could conclude that the energy of intracrustal strong earthquake may mainly come from deep energy supply, and the strain energy accumulation of crustal tectonic movement may function as a complement and reinforcement. Therefore, shell strong earthquake may occur suddenly just like a volcano eruption.
5.2. The Vital Relationship between Seismic Cone Activity and Human Beings
The relationship between earthquake and fault as well as other surface structures is well known, but according to seismo-geothermics, the fault may either be the cause or just the result of seismic activity. Since 1900, the global earthquakes which have killed more than 1000 people almost all happened within the twenty four cones (Figure 6), which shows that it is the seismic cone that may have a vital relationship with human beings rather than surface
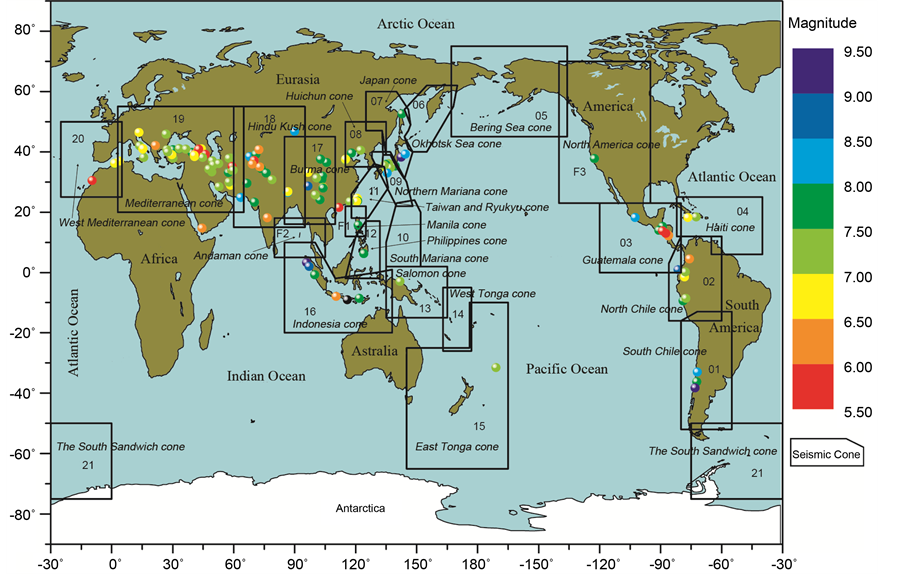
Figure 6. The distribution of deathly earthquakes worldwide has been killing more than 1000 people since 1900.
structure covering the Earth. The seismic cones are places where intensive earthquakes happened, which can be clearly shown on three-dimensional spatial seismic distribution based on earthquake catalogue.
5.3. Study on the Volcano Prediction
No. 0419 card has made a good attempt to the volcano prediction such as Guatemala Santiaguito volcano, Tongariro volcano in New Zealand and Ecuador Tungurahua volcano which all occurred in the volcano circle region predicted by the author [6] . Most of the twenty four global seismic cones have a history of volcano eruption. The present global volcano forecast only focuses on the observation and study of surface microseismic, which is not comprehensive. The volcano history as well as the regularity and influence of deep seismic activity in the located seismic cone are two key elements which must be studied at the same time.
5.4. Focal Depth
Precision and accuracy are two factors in determining focal depth. The images of both twenty four global seismic cones divided based on ANSS catalogue and the Mediterranean seismic cone based on EMSC catalogue are stable in long term; the results of the two kinds of cones are consistent, which is enough to show the precision of depth measurement of the two sets of catalogues. Of course, the accuracy of depth determination is doubt often. However, the predicting method in this paper is mainly concerned with the differences of focal depth rather than absolute depth, which therefore could not suffer the influence of its accuracy.
5.5. The Proportion of Earthquake Size
The research in this paper has not yet adopted a particular statistical method, but the proportion of the earthquake size is calculated as exactly as possible, and the lower limit of the earthquake magnitude defined in agreement within involved seismic cones is permitted.
5.6. The Earthquake Catalogue
ANSS earthquake catalogue and EMSC earthquake catalogue, and many other global earthquake catalogues are desirable. As for the earthquake catalog duration, requirements are not strictly defined. Under the circumstance of deep study on global seismic cones, seismic cone activity can be estimated based on the catalogue, provided that it has ten-year history or longer.
5.7. Conclusion
Intracrustal strong earthquakes and volcano activities have brought great disaster to human being. The lesson of conviction events due to the earthquake misjudgment in Italy, and the criticism and lashes of earthquake prediction by society and public, have made the earthquake prediction with social benefits an urgent task without delay. There is a world class seismological observation data in Mediterranean region, and the opportunities of earthquake prediction research in Italy, Greece, Turkey may be able to bring a new hope to the human being.
In summary, this paper adopts the earthquake catalogue of the European Mediterranean Seismological Centre (EMSC), in accordance with the principles of Seismo-Geothermics Theory and the concept of seismic cone; it discusses the integrity of the earthquake catalogue and the overview of Mediterranean seismic cones; it focuses on the structural details and structural feature of the Italian branch of the Mediterranean seismic cone; it deduces the precursory process of subcrustal earthquake activities before two earthquakes magnitude over 6 and the eruptions of Etna volcano since 2005; then it summarizes the prediction working method of Seismo-Geothermics on estimating the general shell strength, the general period, and the rough location of future earthquake and volcano activities; and finally it discusses and explains some possible problems. The principle and working process of this method were testified in card No. 0419 in 2012, the author’s prediction card, which can apply to predict for intracrustal strong earthquakes and volcano activities within the global 24 seismic cones. The purpose of this paper is to develop the tools and methods of the prediction of future earthquake and volcano.
Acknowledgements
For this study, the ANSS catalog was accessed through the Northern California Earthquake Data Center (NCEDC), doi:10.7932/NCEDC, the EMSC catalog was accessed through the European-Mediterranean Seismological Centre, and the GVP data was accessed through SMITHSONIAN INSTITUTION web.
Cite this paper
LijunChen,XiaofengChen,LeiShao, (2015) Method Research of Earthquake Prediction and Volcano Prediction in Italy. International Journal of Geosciences,06,963-971. doi: 10.4236/ijg.2015.69076
References
- 1. Chen, L.J. (2000) Research of Focal Depth and Active State of the Strong Earthquakes in China. Seismology and Geology, 22, 360-370.
- 2. Chen, L.J. (2012) Theory and Applications of the Seismo-Geothermics. Inland Earthquake, 26, 108-122.
- 3. Chen, L.J. (2013) Conception of Seismic Cone and Its Basic Characteristics. South China Journal of Seismology, 33, 1-14.
- 4. Chen, L.J., Hu, F.X. and Chen, X.F. (2013) Imaging Proof of Seismic Tomography in Seismic Cones on the Earth. South China Journal of Seismology, 33, 1-10.
- 5. Chen, L.J., Chen, X.F., Wan, F.F., Li, P.Z. and Shao, L. (2015) Comparative Study of Global Seismicity on the Hot Engine Belt and the Cooling Seismic Belt—Improvement on Research Ideas of Earthquake Prediction. International Journal of Geosciences, 6, 741-749. http://dx.doi.org/10.4236/ijg.2015.67060
- 6. Chen, L.J. (2015) Instructions of the Three-Year Earthquake and Volcanic Prediction Card No.0419 on Global Major Seismic Cones. http://blog.sciencenet.cn/blog-552558-883826.html
- 7. Chen, L.J. (2015) Forecast Test Summary of 0419 Card in 2012. http://blog.sciencenet.cn/blog-552558-894296.html
- 8. Li, S.G. (1972) Astronomy, Geology and Paleontology. Science Press, Beijing, 71-115.
- 9. Li, S.G. (1976) Method of Geomechanics. Science Press, Beijing.
- 10. Chao, L., Xu, L.S. and Chen, Y.T. (2009) Quick Moment Tensor Solution of the 2009 April l6, L’Aquila, Italy Earthquake. Acta Seismologica Sinica, 31, 464-466.
- 11. Chen, L.J. (2013) Lessons from Earthquake Prediction in Italy. http://blog.sciencenet.cn/blog-552558-652328.html
- 12. Chen, L.J. (2011) Volcano Research in Italy. http://blog.sciencenet.cn/blog-552558-457141.html
- 13. Chen, L.J. (2011) Seismic Tomography Image of Italian Cone. http://blog.sciencenet.cn/blog-552558-505496.html
- 14. Chen, L.J. (2011) Study on Subcrustal Seismic Activity. http://blog.sciencenet.cn/blog-552558-649931.html
- 15. Chen, L.J. (2011) Plane Projection Technique of Seismic Cone. http://blog.sciencenet.cn/blog-552558-466694.html
- 16. Chen, L.J. (2011) Three Dimensional Image of Seismic Cone. http://blog.sciencenet.cn/blog-552558-466867.html
- 17. Chen, L.J. (2011) Production of Seismic Activity Sequence Diagram of Seismic Cone.
http://blog.sciencenet.cn/blog-552558-467181.html - 18. Chen, L.J. (2013) Seismo-Tectonics and Seismic Activity of the Qinghai-Tibet Plateau. Journal of Seismological Research, 36, 123-131.
- 19. Chen, L.J. (2015) Pakistan Earthquake with Ms7.7 in 2013 and Causative Structure of Hindu Kush. Inland Earthquake, 39, 15-27.
- 20. Chen, L.J. (2011) Identify Study of Earthquake Prediction & Volcano Prediction.
http://blog.sciencenet.cn/blog-552558-423131.html
NOTES

*Corresponding author.