Journal of Flow Control, Measurement & Visualization
Vol.09 No.02(2021), Article ID:108108,13 pages
10.4236/jfcmv.2021.92002
Application of Rainbow Schlieren Deflectometry for Jets from Round Laval Nozzles Followed by Cylindrical Ducts
Ryota Fukunaga1, Muhammad Minarul Islam1,2, Yusuke Awata3, Shinichiro Nakao1, Yoshiaki Miyazato1*
1Department of Mechanical Systems Engineering, The University of Kitakyushu, Kitakyushu, Japan
2Bangabandhu Sheikh Mujibur Rahman Science and Technology University, Gopalganj, Bangladesh
3Subaru Corporation, Osawa, Mitaka-shi, Tokyo, Japan

Copyright © 2021 by author(s) and Scientific Research Publishing Inc.
This work is licensed under the Creative Commons Attribution International License (CC BY 4.0).
http://creativecommons.org/licenses/by/4.0/


Received: November 16, 2020; Accepted: March 2, 2021; Published: March 30, 2021
ABSTRACT
The jet from a round Laval nozzle followed by a cylindrical duct with an inner diameter of 10 mm and a length of 50 mm is investigated experimentally. The Laval nozzle has a design Mach number of 1.5. Quantitative flow visualization of the jet issued from the duct exit is performed over a range of nozzle pressure ratios from 2.0 to 4.5 using the rainbow schlieren deflectometry combined with the computed tomography to investigate the jet three-dimensional structure. The flow features of the near-field shock systems in the jets are displayed with the density contour plot at the cross-section including the jet centerline. Effects of the nozzle pressure ratio on the density profile along the jet centerline are clarified quantitatively. In addition, a comparison between the present experiment and the previous one with a conventional Laval nozzle for jet centerline density profiles is carried out to examine the effect of the cylindrical duct. Furthermore, the three-dimensional structures of overexpanded and underexpanded jets are demonstrated with the isopycnic surfaces to visualize the internal flow features.
Keywords:
Rainbow Schlieren Deflectometry, Jet Flow, Shock Wave, Computed Tomography

1. Introduction
To understanding the prominent characteristics of complex shock-containing flows, schlieren and shadowgraph methods [1] have been widely used as optical tools because of its simple optical arrangement with a higher degree of resolution and ability to observe easily such structures of shock waves, Prandtl-Meyer compression and expansion waves in supersonic flows. However, conventional schlieren techniques have been extensively applied for qualitative flow visualization because they take considerable effort to extract quantitative properties. On the other hand, recent methods for visualizing jet density fields quantitatively include laser-based interferometry such as Twyman-Green interferometry [2], Mach-Zehnder interferometry [3] [4] [5] or schlieren based optical techniques such as the background oriented schlieren (BOS) [5] [6], calibrated schlieren [7] [8], and rainbow schlieren deflectometry [7] [9] [10] [11]. Among them, the rainbow schlieren deflectometry would presumably be the simplest optical technique to acquire density fields of jets quantitatively.
The rainbow schlieren deflectometry is a modified form of the conventional schlieren such as the greyscale schlieren with a knife edge and color schlieren with a tricolor filter [1] [12] and it is different from the conventional schlieren in that the rainbow schlieren can capture density fields of flows with variable refractive index. In addition, the rainbow schlieren deflectometry can measure density fields of three-dimensional free jets by combining it with computed tomography [9] [10] [12]. A comprehensive and thorough review of the rainbow schlieren technique is presented by Agrawal and Wanstall [12], where methods to acquire quantitative density data including mathematical relationship, numerical algorithms, system design criteria, hardware issues, calibrations of rainbow filters, and so on are summarized. Recently, Ezoe et al. [13] applied the rainbow schlieren deflectometry for leek peeler nozzle jets to improve the nozzle peeling performance and developed a new nozzle with higher removing potential for peeling leeks in comparison with the conventional nozzle.
In the present study, the rainbow schlieren deflectometry is applied for jets from a round Laval nozzle followed by a cylindrical duct. Such a Laval nozzle followed by a long duct attracts special attentions on applications for the cold spray technology [14] [15], which includes a deposition process in which small particles in the solid state accelerate to high velocities in a supersonic gas jet and deposit on the substrate material. It has been widely recognized that the quality of the coating depends significantly on the gas flow velocity and stagnation temperature. The higher gas velocity makes the particle velocity increased, resulting in highly tough and dense coatings on a solid surface. To achieve optimal conditions for deposition, the quantitative information of the supersonic jets is required. However, there are little quantitative experimental data about the gas dynamics of the cold splay technology. In addition, the design of the spray gun has been primarily empirical and based upon engineering intuition. Therefore, as a first step of an application for the cold spray technology, the effects of nozzle pressure ratios on flow features of the jet from a supersonic nozzle followed by a long duct are described in this paper. Furthermore, the previous experimental data [10] on a jet issued from a conventional Laval nozzle without a long duct is used for a comparison with the present experimental data.
2. Experimental Apparatus and Method
A schematic drawing of experimental apparatus with a rainbow schlieren system is shown in Figure 1. A blowdown wind tunnel with a high-pressure tank (2 m3) was used to provide the air flow to a cylindrical plenum chamber connected to a test nozzle. The high-pressure dry air from the tank is stagnated in the plenum chamber and then discharged into the atmosphere through the test nozzle. The total temperature in the plenum chamber was equal to the room temperature, and the plenum pressure was controlled and maintained constant during the testing by a valve. The test nozzle is shown schematically in Figure 2. It is made of acrylic and consists of a round Laval nozzle with a design Mach number of 1.5 followed by a constant-area straight duct with an inner diameter of 10 mm and a length of 50 mm. The wall contour of the Laval nozzle has a sinusoidal curve over a range of parts A to B and the contour between the throat (part B) and exit (part C) is designed by the axisymmetric method of characteristics [16] to provide uniform and parallel flow in the nozzle exit plane at the design condition.
The jet issued from the nozzle was visualized by the rainbow schlieren deflectometry over a range of nozzle pressure ratios (NPR = pos/pb) from 2.0 to 4.5 where pos is the plenum pressure and pb the back pressure (=101.8 kPa) or atmospheric pressure, and Tb (= 295.5 K) the ambient temperature.
The rainbow schlieren system consists of rail-mounted optical components
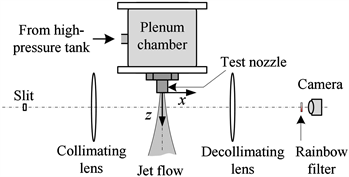
Figure 1. Schmatic drawing of experimental apparatus with rainbow schlieren system.

Figure 2. Test nozzle with dimensions in mm.
including a continuous 250 W metal halide light source with a 3 mm × 50 μm rectangular slit, collimating and decollimating lenses with a 100 mm diameter and 500 mm focal length, a rainbow filter, and a digital camera (Nikon D7100) with a 30 mm diameter focusing lens of 600 mm focal length. Figure 3(a) shows a rainbow filter used in the present experiment and the corresponding calibration curve is displayed in Figure 3(b). The rainbow filter was fabricated in computer software and then printed digitally on a high-resolution 35 mm color film recorder. It has continuous hue variation from Hue = 0 to 360 deg in a 2.0 mm wide strip, and the background hue is Hue = 192 deg in the present experiement. The characteristics of the rainbow filter were performed by traversing the rainbow filter in intervals of 20 μm in the vertical direction (y direction) at the schlieren cutoff plane before starting the experiments.
The rays from the rectangular light source paralleled by the collimating lens traverse a transparent, refracting schlieren test area and are refocused by the decollimating lens to form an inverted image of the light source at the schlieren cutoff plane where the rainbow filter is placed. In rainbow schlieren systems, when a collimated light ray is deflected through the test area, a color image of the area revealing the ray deflections is formed on a recording medium of the digital camera. The schlieren image of the test area is digitized to obtain a direct quantification of the light deflections using the calibration curve of the rainbow filter. The camera output in the RGB format was digitized by a personal computer with 24 bit color frame grabber.

Figure 3. Rainbow filter with calibration curve.
In the present experiments, multiple viewing rainbow schlieren pictures were acquired over a range of nozzle angular angles from 0 deg to 180 deg by rotating the nozzle about its longitudinal axis (z axis) in equal angular intervals of 10 deg. These 19 schlieren pictures were used for reconstruction of the jet density field. The detailed description for the reconstruction process is given in Awata et al. [17]. The jet three-dimensional density field was reconstructed using both of the Abel inversion method based upon the assumption of axisymmetric jets and the convolution back-projection (CBP) method. However, only those obtained from the CBP method are demonstrated in the present paper because the density fields obtained by the Abel inversion method produced some noises on the jet centerline. The principle of the rainbow schlieren deflectometry combined with the CBP method is also given by Takano et al. [9], Maeda et al. [10], and Agrawal et al. [18].
3. Results and Discussion
3.1. Rainbow Schlieren Pictures
Jets from a Mach 1.5 round Laval nozzle followed by a cylindrical duct were visualized using a rainbow schlieren system as shown in Figure 4. The flow is from left to right. Schlieren pictures were taken at an exposure time of 1/8000 s with continuous schlieren light source. In addition, a rainbow filter was placed at the cut-off plane in parallel with respect to the z axis and its orientation is illustrated above Figure 4(a) with the location of the background hue represented as the dashed line on the filter. The value of the nozzle pressure ratio (NPR) is given in the upper right corner of each picture. It should be kept in mind that the
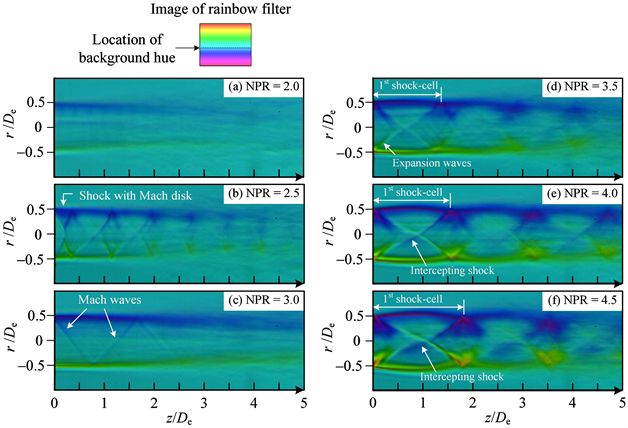
Figure 4. Rainbow schlieren pictures of jet from Laval nozzle with long duct.
jet issued from the duct exit is correctly expanded at NPR= 3.67 if the whole flowfield through the Laval nozzle and duct obeys the isentropic process. In addition, the inviscid theory shows that the flowfield is governed by three different flow features, namely, the flows with a stationary normal shock in the divergent portion of the Laval nozzle for a range of NPRs from 1.29 to 1.49, overexpanded flows for a range of NPRs from 1.49 to 3.67, and underexpanded flows for NPRs beyond 3.67. However, since the nozzle and duct flows are affected strongly by the wall friction, the schlieren pictures of Figure 4 display an effect of the wall friction on jets from the duct exit.
Figure 4(a) is in the overexpanded flow state ideally, but no regular shock or Mach stem appears in the jet. It presumably shows the flow behind a pseudo-shock wave in the straight duct [14]. Figure 4(b) indicates a conventional overexpanded jet because a shock with a Mach stem is present near the duct exit. As shown in Figure 4(c), when NPR increases to 3.0, no significant shocks appear in the jet plume. It means that shocks change into Mach waves or weak shocks. This indicates the correctly expanded jet condition for the present Laval nozzle followed by the long duct. In this situation, the wall friction in the cylindrical duct causes the flow Mach number at the duct exit to be less than the isentropic exit Mach number of 1.5. In the case of NPR = 3.0, a simple estimation of the Mach number averaged over the cross-section at the duct exit becomes 1.36. An increase in NPR from 3.0 to 3.5 contributes to the occurrence of expansion waves from the duct exit, as shown in Figure 4(d) and the shock-cell structure is quasi-periodically repeated in the flow direction. Figure 4(e) and Figure 4(f) show that a further increase of NPR from 3.5 to 4.0 or 4.5 causes an intercepting shock to produce in the jet and the shock-cell spacing as well as the strength of the shock increase as NPR increases.
3.2. Density Contour Plots
The schlieren pictures of Figure 4 show only qualitative flow features of the jet. Nevertheless, it sometimes utilizes as a comparison for a validation of the results obtained by CFD. However, the validation of simulations by comparisons with the geometrical shapes of shock waves from the schlieren pictures should be done with care, because the pictures display a line-of-sight imaging, or information averaged along the view direction about the first spatial derivative of density profile. In addition, the schlieren image can be changed easily by adjusting the contrast. On the contrary, the density field on a cross-section of the jet would be effective for reliable validation of simulated results.
Figures 5(a)-(f) exhibit density contour plots of the jets normalized by the ambient density ρb where the flow is from left to right. The contour levels with an interval of 0.0625 are shown at the top, and the spatial resolution in the experimental density map is around 13 μm. The schlieren picture can only provide integrated information about the density gradient along in the direction of the optical axis, but, Figures 5(a)-(f) can clearly demonstrate the quantitative
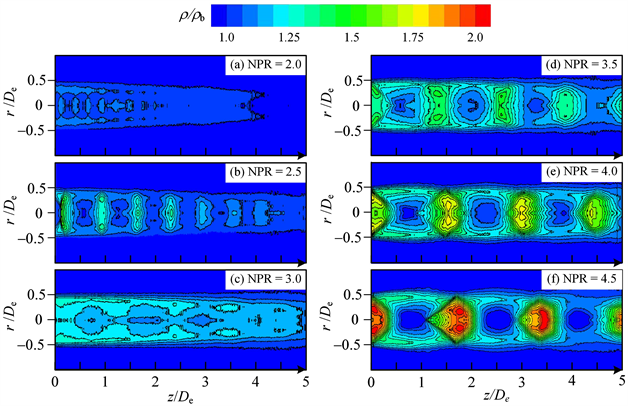
Figure 5. Density contour plots of jet issued from Laval nozzle with duct.
information of the density fields of the jets. The jet density fields are reconstructed using the convolution back-projection (CBP) method. Unlike the schlieren pictures of Figure 4, the density contour plots shown in Figure 5 illustrate the various flow features of the near-field shock structures quantitatively, such as the shape and size of the expansion and compression regions, shock cell intervals, jet boundaries and so on.
Figure 5(a) indicates a series of weak shocks arranged at almost equal spacings in the region less than z/De = around 1.0. As shown in Figure 5(b), an increase in NPR results in strengthening the shocks and a shock with a Mach disk appears just downstream of the duct exit and followed by a series of shock-cells with weak shocks like compression waves. It shows a typical feature of the overexpanded flows. Further increase in NPR causes all shocks including the Mach disk to disappear, as shown in Figure 5(c). This nozzle pressure ratio (NPR = 3.0) makes the correctly expanded flow with respect to the present nozzle. It should be noted again that the theoretical nozzle pressure ratio based upon the assumption of the isentropic flow through the present nozzle is 3.671. As shown in Figure 5(e) and Figure 5(f), additional increases in NPR cause the expansion waves at the duct exit to produce and the degree of expansion increase with increasing NPR.
3.3. Density Profiles along Jet Centerline
Effects of the nozzle pressure ratio on jet centerline density profiles are shown in Figures 6(a)-(f). The leftward arrow on the vertical axis in each figure indicates the theoretical density ratio at the duct exit when the isentropic flow is assumed through both the nozzle and duct. In addition, the value of the fully expanded jet
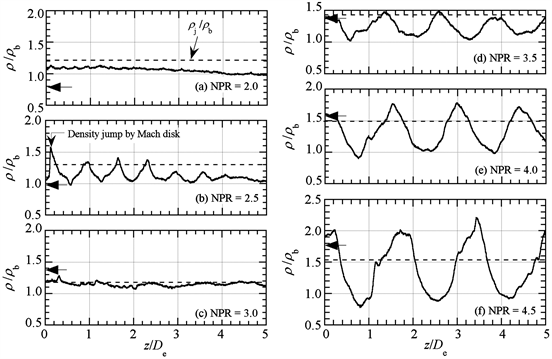
Figure 6. Centerline density profiles of jet issued from Laval nozzle with long duct.
density ρj normalized by the ambient density ρb for each nozzle pressure ratio is shown as the dashed horizontal line in the figure. All density data in Figures 6(a)-(f) are normalized by the ambient density ρb.
In case of NPR = 2.0, multiple weak shocks with a small amplitude of almost equal intervals can be observed faintly between the duct exit and z/De = around 1.0. The density fluctuations with small amplitude just downstream of the duct exit are responsible for the shock-train [19]. For NPR = 2.5, a distinct spike in the density profile contributed to the Mach disk appears just downstream of the duct exit. The Mach disk has the maximum density rise and the subsequent shock-cells indicate density increments of almost the same order of magnitude. No significant shocks appear for NPR = 3.0 because of the correctly expanded flow condition. For NPRs beyond the NPR = 3.0, flow expansion and compression are repeated toward downstream due to the quasi-periodic shock-cell structure. Particularly, for NPR = 4.5, the local density fluctuates about ρj/ρb and it decrease below ρj/ρb in the expansion region of each shock-cell and increases above ρj/ρb in the compression region. The sudden density increase at around z/De =1.1 corresponds to the intercepting shock in the first shock-cell, as shown in Figure 6(f).
3.4. Effect of Cylindrical Duct
Effects of the cylindrical duct on the density profile along the jet centerline for NPR = 4.0 are shown in Figure 7. The black line indicates the same experimental data as Figure 6(e) and the blue one shows the experimental results conducted by Maeda et al. [10]. The red line parallel to the abscissa shows the level of the normalized fully expanded density (ρj/ρb) and the leftward arrow on the vertical axis is the normalized exit density estimated based on the assumption of the isentropic flow from the nozzle inlet to the duct exit. The effect of wall friction on the jet structure cannot be clarified from only the schlieren photographs

Figure 7. Effect of cylindrical duct on jet centerline density profile for NPR = 4.0.
in Figure 4. However, we can predict the friction effect from a quantitative comparison between the density distributions from the Laval nozzles with and without a long duct as shown in Figure 7.
Both of the density profiles for the Laval nozzles with and without the cylindrical duct are very similar to each other in overall trend. The black line shows that the density values at the local minima and local maxima in the density profile are kept almost constant toward the downstream. The blue line contains higher frequency components when compared to the black line. What needs to be emphasized is that the exit densities for both of the density profiles are approximately equal to the theoretical exit density. It means that the free stream Mach numbers at the exit for both of the nozzles are almost the same. However, the Mach number averaged over the cross-section at the exit is lower in the Laval nozzle with the cylindrical duct than in the conventional Laval nozzle, i.e., the density profiles are affected significantly by the Mach number distribution at the nozzle exit. The Fanno flow theory [20] states that the maximum possible length where the flow is not choked at the duct exit is 85 mm for a constant-area duct with an inlet Mach number of 1.5, constant Fanning friction factor of 0.004 [21], and duct diameter of 10 mm. Therefore, for the present Laval nozzle with a cylindrical duct, the average Mach number over the cross-section of the duct exit is beyond unity.
3.5. Three-Dimensional Jet Structure
The three-dimensional structures of two typical shock-containing jets are illustrated in Figure 8 with the respective isopycnic surface, which displays a surface of constant density inside the jet. These representations are very effective in examining the structure of the density fields including shocks in which the flow properties change rapidly. The range of the density is shown as a colour bar in the top of the figure. Figure 8(a) and Figure 8(b) show overexpanded (NPR = 2.5) and underexpanded (NPR = 4.5) jet structures, respectively, and they correspond to Figure 5(b) and Figure 5(f). As shown in Figure 8(a), the three-dimensional flow features of the Mach disk just downstream of the duct exit as well as the following downstream successive weak shocks with a circular shape each can be

Figure 8. Isopycnic surfaces of overexpanded and underexpanded jets.
seen clearly with suddenly varying colour. Figure 8(b) shows that the oblique shocks in shock-cells are reflected at the opposite jet free boundaries to form bicone structure. The structure gradually becomes smaller in shape toward downstream.
4. Concluding Remarks
The density fields of jets from a round Laval nozzle followed by a cylindrical duct were measured by the rainbow schlieren deflectometry. The three-dimensional density fields of the jets were reconstructed by the convolution back-projection (CBP) method to investigate the effects of the nozzle pressure ratio on the jet structure. A quantitative comparison between the centerline density profiles from the Laval nozzles with and without a cylindrical duct was performed.
As a result, it was found that the jet from the Laval nozzle with the cylindrical duct reaches a shock-free state at a nozzle pressure ratio lower than the design condition because of the wall friction along the duct wall. However, the freestream Mach number at the cylindrical duct exit is almost the same as that calculated based upon the assumption of the isentropic flow over the whole flow field. The cylindrical duct causes the average Mach number at the exit to be reduced, but not change the freestream Mach number at the duct exit and it smooths the density profile when compared with that for the jet issued from the conventional Laval nozzle. Two types of shock-containing jets showing overexpanded and underexpanded states were displayed with the respective isopycnic surface and it was found that the overexpanded jet produces a Mach disk following by successive weak shocks with a circular shape, while the underexpanded jet forms a bicone structure composed of an oblique shock and expansion waves in each shock-cell, which gradually becomes smaller in shape toward downstream.
Conflicts of Interest
The authors declare no conflicts of interest regarding the publication of this paper.
Cite this paper
Fukunaga, R., Islam, M.M., Awata, Y., Nakao, S. and Miyazato, Y. (2021) Application of Rainbow Schlieren Deflectometry for Jets from Round Laval Nozzles Followed by Cylindrical Ducts. Journal of Flow Control, Measurement & Visualization, 9, 15-27. https://doi.org/10.4236/jfcmv.2021.92002
References
- 1. Settles, G.S. (2001) Schlieren and Shadowgraph Techniques: Visualizing Phenomena in Transparent Media. 1st Edition, Springer, Berlin.
- 2. Sugawara, S., Nakao, S., Miyazato, Y. and Ishino, Y. (2018) Application of Twyman-Green Interferometers for Shock-Containing Free Jets from Axisymmetric Convergent Micro Nozzles. 18th International Symposium on Flow Visualization, Zurich, Switzerland, 26-29 June 2018, 1-18.
- 3. Sugawara, S., Nakao, S., Miyazato, Y., Ishino, Y. and Miki, K. (2020) Three-Dimensional Reconstruction of a Microjet with a Mach Disk by Mach-Zehnder Interferometers. Journal of Fluid Mechanics, 893, A25. https://doi.org/10.1017/jfm.2020.217
- 4. Sugawara, S., Nakao, S., Miyazato, Y., Ishino, Y. and Miki, K. (2021) Quantitative Flow Visualization of Slightly Underexpanded Microjets by Mach-Zehnder Interferometers. Flow, Turbulence and Combustion, 106, 971-992 https://doi.org/10.1007/s10494-020-00211-4
- 5. Kaganovich, D., Johnson, L.A., Mamonau, A.A. and Hafizi, B. (2020) Benchmarking Background Oriented Schlieren against Interferometric Measurement Using Open Source Tools. Applied Optics, 59, 9553-9557. https://doi.org/10.1364/AO.406301
- 6. Nicolas, F., Donjat, D., Leon, O., Le Besnerais, G., Champagnat, F. and Micheli, F. (2017) 3D Reconstruction of a Compressible Flow by Synchronized Multi-Camera BOS. Experiments in Fluids, 58, Article No. 46. https://doi.org/10.1007/s00348-017-2325-y
- 7. Mariani, R., Zang, B., Lim, H.D., Vevek, U.S., New,T.H. and Cui, Y.D. (2019) A Comparative Study on the Use of Calibrated and Rainbow Schlieren Techniques in Axisymmetric Supersonic Jets, Flow Measurement and Instrumentation, 66, 218-228. https://doi.org/10.1016/j.flowmeasinst.2019.01.007
- 8. Nazari, A.Z., Ishino, Y., Ishiko, Y., Ito, F., Kondo, H., Yamada, R., Motohiro, T., Miyazato, Y. and Nakao, S. (2020) Multi-Schlieren CT Measurements of Supersonic Microjets from Circular and Square Micro Nozzles. Journal of Flow Control, Measurement & Visualization, 8, 77-101. https://doi.org/10.4236/jfcmv.2020.83005
- 9. Takano, H., Kamikihara, D., Ono, D., Nakao, S., Yamamoto, H. and Miyazato, Y. (2016) Three-Dimensional Rainbow Schlieren Measurements in Underexpanded Sonic Jets from Axisymmetric Convergent Nozzles. Journal of Thermal Science, 25, 78-83. https://doi.org/10.1007/s11630-016-0836-0
- 10. Maeda, H., Fukuda, H., Kubo, K., Nakao, S., Ono, D. and Miyazato, Y. (2018) Structure of Underexpanded Supersonic Jets from Axisymmetric Laval Nozzles. Journal of Flow Visualization and Image Processing, 25, 33-46. https://doi.org/10.1615/JFlowVisImageProc.2018027034
- 11. Mariani, R., Zang, B., Lim, H.D., Vevek, U.S., New,T.H. and Cui, Y.D. (2020) On Application of Non-Standard Rainbow Schlieren Technique upon Supersonic Jets. Journal of Visualization, 23, 383-393. https://doi.org/10.1007/s12650-020-00637-y
- 12. Agrawal, A.K. and Wanstall, C.T. (2018) Rainbow Schlieren Deflectometry for Scalar Measurements in Fluid Flows. Journal of Flow Visualization and Image Processing, 25, 329-357. https://doi.org/10.1615/JFlowVisImageProc.2018028312
- 13. Ezoe, M., Nakao, S. and Miyazato, Y. (2019) Quantitative Flow Visualization by Rainbow Schlieren Deflectometry and Pitot Pressure Measurements for Leek Peeler Nozzle Jets. Journal of Flow Control, Measurement & Visualization, 7, 44-60. https://doi.org/10.4236/jfcmv.2019.71004
- 14. Katanoda, H., Matsuoka, T. and Matsuo, K. (2007) Experimental Study on Shock Wave Structures in Constant-Area Passage of Cold Spray Nozzle. Journal of Thermal Science, 16, 40-45. https://doi.org/10.1007/s11630-007-0040-3
- 15. Zahiri, S.H., Yang, W. and Jahedi, M. (2009) Characterization of Cold Spray Titanium Supersonic Jet. Journal of Thermal Spray Technology, 18, 110-117. https://doi.org/10.1007/s11666-008-9278-x
- 16. Foelsch, K. (1949) The Analytical Design of an Axially Symmetric Laval Nozzle for a Parallel and Uniform Jet. Journal of the Aeronautical Sciences, 16, 161-166. https://doi.org/10.2514/8.11758
- 17. Awata, Y., Nakao, S. and Miyazato, Y. (2018) Density Measurements in Free Jets from Axisymmetric Supersonic Nozzles with Constant-Area Straight Ducts. 18th International Symposium on Flow Visualization, Zurich, Switzerland, 26-29 June 2018, 1-13.
- 18. Agrawal, A.K., Butuk, N.K., Gollahalli, S.R. and Griffin, D. (1998) Three-Dimensional Rainbow Schlieren Tomography of a Temperature Field in Gas Flows. Applied Optics, 37, 479-485. https://doi.org/10.1364/AO.37.000479
- 19. Matsuo, K., Miyazato, Y. and Kim, H.D. (1999) Shock Train and Pseudo-Shock Phenomena in Internal Gas Flows. Progress in Aerospace Sciences, 35, 33-100. https://doi.org/10.1016/S0376-0421(98)00011-6
- 20. John, J.E.A. (1984) Gas dynamics. 2nd Edition, Allyn and Bacon, USA.
- 21. Miyazato, Y., Sakamoto, S. and Matsuo, K. (2007) An Experiment on Choking Phenomena in Supersonic Fanno Flows. Transactions of the JSME, 73, 2393-2396. (In Japanese) https://doi.org/10.1299/kikaib.73.2393
Nomenclature
De: Diameter at duct exit or nozzle exit [m]
Hue: Hue [deg]
NPR: Nozzle pressure ratio [=pos/pb]
pos: Plenum pressure [Pa]
pb: Back pressure [Pa]
r: Radial distance from jet centerline [m]
Tb: Ambient temperature [K]
x,y,z: Rectangular Cartesian coordinate system
ρ: Density [kg/m3]
ρb: Ambient density [kg/m3]
ρj: Fully expanded jet density [kg/m3]