Journal of Flow Control, Measurement & Visualization
Vol.08 No.03(2020), Article ID:100540,25 pages
10.4236/jfcmv.2020.83005
Multi-Schlieren CT Measurements of Supersonic Microjets from Circular and Square Micro Nozzles
Ahmad Zaid Nazari1 , Yojiro Ishino1*, Yuta Ishiko1, Fumiya Ito1, Harumi Kondo1, Ryoya Yamada1, Takanori Motohiro1, Yoshiaki Miyazato2, Shinichiro Nakao2
1Electrical and Mechanical Engineering Department, Nagoya Institute of Technology, Nagoya, Japan
2Department of Mechanical Systems Engineering, The University of Kitakyushu, Kitakyushu, Japan

Copyright © 2020 by author(s) and Scientific Research Publishing Inc.
This work is licensed under the Creative Commons Attribution International License (CC BY 4.0).
http://creativecommons.org/licenses/by/4.0/


Received: December 1, 2019; Accepted: February 12, 2020; Published: May 28, 2020
ABSTRACT
Instantaneous three-dimensional (3D) density distributions of a shock-cell structure of perfectly and imperfectly expanded supersonic microjets escaping into an ambient space are measured. For the 3D observation of supersonic microjets, non-scanning 3D computerized tomography (CT) technique using a 20-directional quantitative schlieren optical system with flashlight source is employed for simultaneous schlieren photography. The 3D density distributions data of the microjets are obtained by 3D-CT reconstruction of the projection’s images using maximum likelihood-expectation maximization. Axisymmetric convergent-divergent (Laval) circular and square micro nozzles with operating nozzle pressure ratio 5.0, 4.5, 4.0, 3.67, and 3.5 have been studied. This study examines perfectly expanded, overexpanded, and underexpanded supersonic microjets issued from micro nozzles with fully expanded jet Mach numbers Mj ranging from 1.47 - 1.71, where the design Mach number is Md = 1.5. A complex phenomenon for free square microjets called axis switching is clearly observed with two types “upright” and “diagonal” of “cross-shaped”. The initial axis-switching is 45˚ within the first shock-cell range. In addition, from the symmetry and diagonal views of square microjets for the first shock-cells, two different patterns of shock waves are viewed. The shock-cell spacing and supersonic core length for all nozzle pressure ratios are investigated and reported.
Keywords:
Supersonic Microjet, Multi-Directional Quantitative Schlieren Optical System, Three-Dimensional (3D) Measurement, Computerized Tomography (CT), Circular and Square Micro Laval Nozzles

1. Introduction
Visual observation and investigation of fluid flow provide useful and comprehensive insight into a flow field under inspection and help derive quantitative data from the observed flow patterns. Fluids are mostly transparent, and therefore, invisible; there are some good techniques that can visualize flowing fluids with non-uniform density. A Schlieren technique is very sensitive to density changes and it can visualize invisible flows in transparent media. This technique has been widely implemented in fluids and combustion. In fluid dynamics, the schlieren imaging technique is a common tool to illustrate detailed descriptions of air flows, shock waves, compressions, and expansion fans in supersonic jet flows for use in aerodynamical studies [1]. In previous works, a non-scanning three-dimensional computerized tomography (3D-CT) technique using a delicate multi-directional quantitative schlieren optical system with a flashlight source was developed and employed to measure instantaneous density distributions of several types of flames in laminar and turbulent flows [2] [3] [4] [5] [6]; in addition, some new techniques have been introduced [7] [8].
It is very difficult and unsatisfactory to investigate microjets when using measurement devices because of the very small dimensions of the micro nozzles, especially those close to the micro nozzle exit. In the present study, to provide a suitable technique for the 3D observation of a supersonic microjet (non-uniform density flow), a non-scanning 3D-CT technique using a multi-directional quantitative schlieren technique was employed [2] [3] [4] [5] [6]. This is the first study wherein the mentioned technique with a non-deviation treatment for projection images (density thickness images) is used to measure instantaneous density distributions on the shock-cell structure of perfectly and imperfectly expanded (overexpanded and underexpanded) supersonic microjets issued from circular and square micro nozzles.
Air microjets are employed to deliver pressure to a workpiece in many industrial activities using simple sonic nozzles [9]. Scroggs and Settles [9] explained that the selection of such sonic nozzles leads to restrictions and undesirable points. They suggested an alternative method: the application of converging-diverging (Laval) supersonic micro nozzles that have highly uniform and stable properties. A supersonic microjet is a more effective small-scale high-pressure gas delivery device compared to sonic nozzles of comparable scale at equivalent mass flow rates. The main advantage of microjets is their ability to create high-density arrays of microjets without increasing flow rate. To the best of our knowledge, Scroggs and Settles [9] were the first authors to study micro nozzle flow and obtain schlieren images of a shock-cell structure of flow and axial and transverse pitot-pressure distributions. Further, they fabricated converging-diverging micro nozzles by heating and stretching glass capillaries; in these experiments, air was used as the working gas in the experiments. The nozzle exit diameters were 600 μm and 1200 μm with exit Mach numbers ranging from 1.0 - 2.8 and Reynolds numbers ranging 20,000 - 45,000.
Aniskin et al. [10] reported a detailed study on the structure of underexpanded mini and microjets with a wide range of diameters ranging from 341 - 10.4 μm. The working gas in the experiments was nitrogen. The main parameters of supersonic underexpanded microjets are identified, including the size of shock-cells and the supersonic core length of the microjet. Phalnikar et al. [11] studied supersonic microjets escaping micro nozzles with diameters ranging between 100 - 1000 μm and presented the results of only 200 and 400 μm microjets, which include most features of interest; the working gas in their experiment was nitrogen. In addition, Phalnikar et al. [11] proposed a correlation for the size of shock-cells in the jet and for the relative supersonic core length. They obtained axial and transverse pressure distributions from a pitot pressure survey.
Supersonic microjets have diverse applications in various fields of engineering and industries; for example, in the cooling of micro-electro mechanical systems (MEMS) components, fine particle deposition and removal, and as actuators to control the ground effect in short take-off and vertical landing (STOVL) aircraft when hovering [11]. Further, microjets have been used in the removal of fine particles from a surface by impinging shock waves [12], microjet engines [13], in active control of gas-dynamic flows, and for significant reduction in the overall sound pressure levels of the aircraft [14] [15] [16], and for jet noise control [17].
Supersonic free jets issued from circular, square, rectangular with different aspect ratios, and regular triangular nozzles are visualized using a laser-induced fluorescence method proposed by Teshima [18]; it is found that these jets expand most prominently in the major and minor axial directions, which results in a cross-shaped cross-section. Tsutsumi et al. [19] investigated the structure of underexpanded jets for square nozzles and explained that these types of nozzle are of interest because of their use in clustered combustors of linear aerospike engines. These combustors are designed to minimize intercell gaps using a rectangular exit; the nozzle studied in the report of Tsutsumi et al. has a circular throat and a square exit, with the Dthroat of 6 mm and a nozzle wall thickness of 1.5 mm. Noncircular jets were identified as an efficient technique for passive flow control [20]. Cabaleiro and Aider [21] reported the observation of the axis-switching of a microjet for the first time for free noncircular microjets.
There are very few experimental studies on supersonic microjets, especially for the square cross-section, in the literature. However, with a few exceptions (e.g. [22] [23]), most studies used the schlieren technique from a qualitative point of view and not for quantitative measurements. In most studies, quantitative measurements of the jets spreading as well as shock-cell spacing were obtained using micro-pitot probe surveys.
In the present study, quantitative measurements and qualitative investigations are combined, and supersonic microjets from circular and square micro nozzles have been successfully CT-reconstructed with a custom-made 20-directional schlieren optical system. The results show instantaneous 3D density distributions downstream of the micro nozzles exit. Further, shock-cell spacing, supersonic core length, axis switching, and two different shocks patterns of the symmetry and diagonal views of square microjets are clearly observed and investigated.
2. Experimental Apparatus Setup and Methods
2.1. Micro Nozzles and Coordinate System
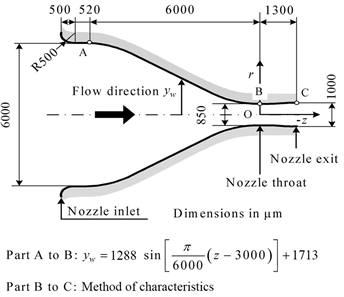
A circular and square cross-section convergent-divergent (Laval) micro nozzle, with a design Mach number Md = 1.5, is studied ( [24] [25], Figure 1). The circular nozzle has a throat diameter of 922 μm, an exit diameter of 1000 μm, and an area ratio Ae/Ath = 1.18; the square nozzle has a throat size of 850 × 850 μm2, an exit size of 1000 × 1000 μm2, an area ratio Ae/Ath = 1.38. The convergent and divergent section lengths are 6000 μm and 1300 μm, respectively. The center of the nozzle exit is selected as the origin of the xyz-coordinate system; the nozzle exits are then located downward in the negative z-axis. The x-axis is located
 (a)
(a)
 (b)
(b)
Figure 1. Details of the micro nozzles (dimensions in μm). (a) Circular nozzle [24]; (b) Square nozzle [25].
between camera No. 10 (θ = −4.5˚) and camera No. 11 (θ = +4.5˚); the details of the camera system are described in the next section. Detailed descriptions of micro nozzles are reported in [24] [25]. The micro nozzle was designed using a sinusoidal curve and the axisymmetric method of characteristics [26] to provide uniform and parallel flow.
2.2. Multi-Directional Quantitative Schlieren Optical System
Figures 2(a)-(c) illustrate the concept of a 20-directional schlieren camera. In the camera system, the target supersonic microjet/non-uniform density field is observed from a 180° direction using numerous schlieren optical systems simultaneously. Twenty systems capture multi-directional views in the 20 angle positions from θ = −85.5˚ to +85.5˚ at intervals of 9˚. Here, angle θ is defined as the
 (a)
(a)  (b)
(b)  (c)
(c) 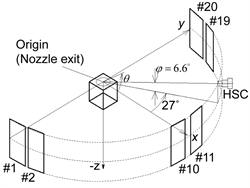 (d)
(d) 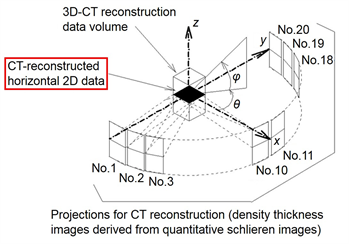 (e)
(e) 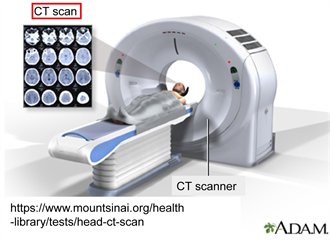 (f)
(f)
Figure 2. Multi-direction schlieren optical system and coordinate system [2] - [8]. (a) Schlieren camera system; (b) Schematic of 20-direction schlieren camera; (c) Coordinate system; (d) Single unit of quantitative schlieren optical system; (e) 3D-CT non-scanning method; (f) CT-scanner.
horizontal angle from the x-axis. For pre-investigation and for time-series observation (high-speed schlieren movies) of the target flow, a high-speed camera (HSC) is used simultaneously with the 20-direction schlieren photographing apparatus (between cameras No. 13 and No. 14, Figure 2(c)). The diagram of a single instance of a multi-directional quantitative schlieren camera system is provided in Figure 2(d). This system is composed of two convex achromatic lenses with a 50 mm diameter and a 300 mm focal length, flashlight source unit, vertical knife-edge (for obtaining horizontal schlieren brightness gradient images), and digital camera. The neutral density (ND) filter (Fuji 1.5, exposure adjustment multiple 3.16) and stepped ND filter is used for calibrating the cameras. The light unit is a xenon flashtube that emits full-spectrum white light with a uniform luminance rectangular area of 1 mm × 2 mm and a 35 μs duration.
From a technological point of view, this experimental method (CT non-scanning, Figure 2(e)) is similar to a CT-scanner used in medical engineering for medical diagnostics (Figure 2(f)). The CT-scan combines a series of X-ray images obtained from different angles to produce cross-sectional (tomographic) images of specific areas of a scanned object (human body). The schlieren 3D-CT measurement technique employs schlieren photography (instead of X-ray images) from 20-directions to reconstruct 3D-density distributions data (cross-sectional density distributions) of a target flow.
2.3. Image Processing
Figure 3 shows a conceptual framework for the formation of a projection image (density thickness) in the proposed schlieren 3D-CT system. Detailed descriptions of the various sections of Figures 3(a)-(k), along with the supporting formula, are provided in the previous reports [2] - [8] and many other references cited therein. Here, for brevity, the main points of Figure 3 are explained as follows.
Density, deviation density, and density thickness values with an asterisk sign (*) express actual values, and those without the sign represent derived values from the CT-reconstruction process. Figure 3(a) depicts density distribution ρ*(x, y) of target flow with an ambient gas (air) region of constant density ρa*(= 1.2 kg/m3) on the periphery of the observed range of radius R. Figures 3(b)-(k) shows observations in the direction of θ from the x-axis in the inclined coordinates denoted by X(θ) and Y(θ).
The first goal is obtaining the density thickness of deviation density (Dt*(X(θ))), as shown in Figure 3(d) with a unit of (kg/m3)(m). The density thickness of deviation density Dt*(X(θ)) is obtained automatically from schlieren observation using spatial integration of deviation density Δρ*(X(θ),Y) along the line of sight. In other words, the density distribution of target flow is reconstructed using a 2D distribution (image) of “density thickness” as a projection in the CT-reconstruction process.
In the practice for obtaining the density thickness of deviation density (Figure 3(i)), the image processing activity starts from Figure 3(e) by obtaining two sets
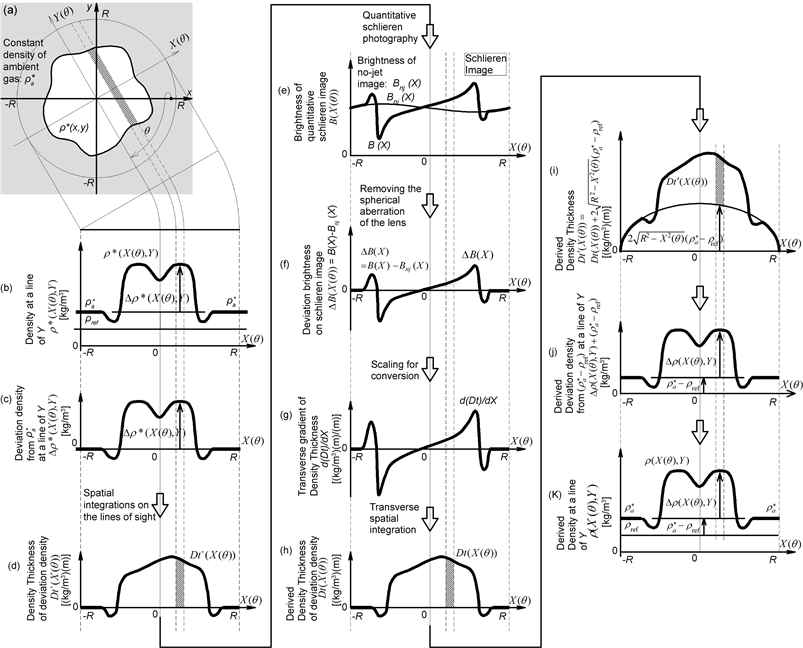
Figure 3. Processes of formation of schlieren brightness and conversion to projections (density thickness (Dt)) of CT.
of images, “with target” and “without target” (without any disturbance in the test section) with a horizontal brightness gradient in the x-direction. Two sets of images are presented by schlieren observation as B(X) and Bnj(X) (brightness of schlieren image in no-jet condition). To obtain the density thickness of deviation density Dt(X(θ)) from B(X) and Bnj(X), both as shown in Figures 3(f)-(i). As indicated in Figure 3(f) and Figure 3(g), the deviation brightness in a schlieren image ΔB(X)
(1)
is scaled to d(Dt)/dX by
(2)
where K is the Gladstone–Dale constant for air (K = 2.26 × 10⁻⁴ m3/kg), Δs (= 1 mm × 2 mm (Hor. × Ver.)) is the transparent width of the light source image on schlieren stop location and f (= 300 mm) is the focal length of the convergent lens. Deviation density thickness Dt(X(θ)) is, therefore, reproduced by the transverse integration of d(Dt)/dX from schlieren images, as shown in Figure 3(h). Finally, the density thickness Dt′(X(θ)) is obtained by adding the thickness of to the deviation density thickness Dt(X(θ)) on the peripheral of the observed range of radius R (Figure 3(i)), as expressed by
(3)
In the present study, ρref = 0.8 is selected as a reference density because the minimum jet density is above this amount. Using non-deviation treatment for projections of CT by employing reference density guarantees that the CT-reconstructed deviation density is non-negative and the CT-reconstruction is possible.
2.4. CT-Reconstruction
Density thickness images are used for CT-reconstruction by maximum likelihood-expectation maximization (ML-EM) [27] as an appropriate CT algorithm to obtain the 3D reconstruction of density distribution; the ML-EM method [2] - [8] is employed for CT-reconstruction. The CT procedure is carried out in each horizontal plane of the z-axis for the reconstruction of deviation density distribution Δρ(x, y) from a linear data set of density thickness Dt'(X(θ)) (Figure 3(j)). Finally, 2D density distribution is obtained as follow, and ρref, in which one step (Figure 3(i)) was added, at this step is again subtracted and removed (Figure 3(k)).
(4)
The reconstruction was performed cross-section by cross-section and then the cross-sections were stacked to form a three-dimensional density distribution. Therefore, a 2D distribution ρ(x, y) is accumulated in layers to form the 3D-CT distribution ρ(x, y, z). In the present study, the density thickness projections images of 50 (H) × 375 (V) pixel (2 × 15 mm2) are used for CT-reconstruction to produce 3D data 50 (x) × 50 (y) × 375 (z) pixel (2 × 2 × 15 mm3). The voxel size is 0.04 mm in each direction.
2.5. Supersonic Microjets [28]
A jet is referred to as underexpanded if jet pressure ratio (JPR), Pe/Pb ˃ 1, overexpanded if Pe/Pb < 1, and perfectly expanded or pressure matched if Pe/Pb = 1. In the present work, axisymmetric convergent–divergent (Laval) circular and square micro nozzles with operating nozzle pressure ratios (NPR = Po/Pb) of 5.0, 4.5, 4.0, 3.67, and 3.5 have been studied.
This study examines perfectly expanded (ideally, correctly expanded) and imperfectly expanded (overexpanded and underexpanded) supersonic microjets issued from micro nozzles with fully expanded jet Mach numbers Mj ranging from 1.47 - 1.71. The design Mach number of these micro nozzles is Md = 1.5. The isentropic nozzle-flow relation [28] is used in the analysis of supersonic flow. The ambient and flow conditions for target supersonic microjets are summarized in Table 1 and Table 2, respectively.
3. Results and Discussions
3.1. Quantitative Schlieren and Projections (Density Thickness) Images
Owing to page limitations, only sample sets of images in some directions and some positions for some NPR (nozzle pressure ratio) are shown in the subsequent figures and sections. Figure 4 indicates the quantitative schlieren images of deviation brightness in schlieren images (as shown in Figure 3(f)) for supersonic microjet from the square nozzle for NPR = 5.0. The numbers inserted in each picture expressshooting angles θ.
The images in Figure 4 are processed by the above-mentioned conversion procedure for projection images of density thickness , as shown in

Table 1. The ambient and micro nozzles conditions.
Table 2. Flow conditions of targets supersonic microjets.

Figure 4. Quantitative schlieren images of supersonic microjet, square nozzle, NPR = 5.0.

Figure 5. Density thickness images of supersonic microjet, square nozzle, NPR = 5.0.
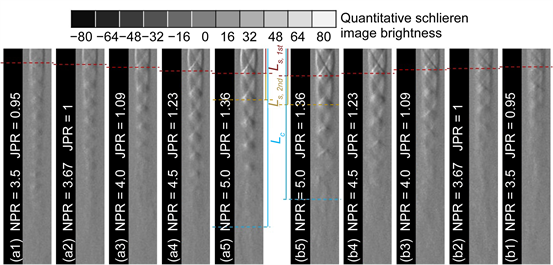
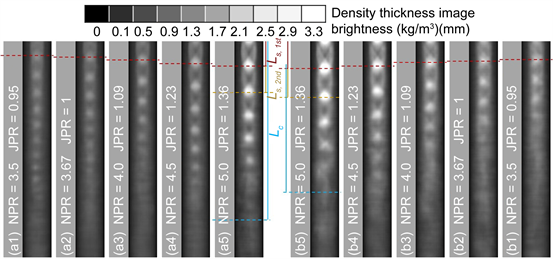
Figure 5. Figure 6 indicates a sample set of quantitative schlieren images for all NPR only for camera No. 12, and the corresponding sample set of projection images of density thickness are depicted in Figure 7. The positions of the first “shock-cell spacing (length) Ls” and “supersonic core length Lc” are depicted by the dashed line in Figure 6 and Figure 7, which will be discussed in section 3.4.
3.2. CT-Reconstruction Results
Using the density thickness images (Figure 5, Figure 7) as projections for CT
 (a) Circular nozzle (b) Square nozzle
Figure 6. Quantitative schlieren images of overexpanded (a1, b1), perfectly expanded (a2, b2), and underexpanded (a3-a5, b3-b5) supersonic microjets (images from camera No. 12).
 (a) Circular nozzle (b) Square nozzle
Figure 7. Density thickness images of overexpanded (a1, b1), perfectly expanded (a2, b2), and underexpanded (a3-a5, b3-b5) supersonic microjets (images from camera No. 12).
reconstruction, 3D instantaneous density distributions of supersonic microjets have been successfully obtained for z = 0 to 15 mm. Figure 8(a1)-(i1) shows sample vertical and horizontal CT-reconstructed distributions of density for different positions of circular underexpanded microjets, NPR = 5.0.
The values of the densities are displayed in light and dark based on the grayscale level under images. The darker parts are related to lower density areas and the brighter parts are related to higher density points. The corresponding density contour diagrams of each cross-section are depicted as well (Figure 8(a2)-(i2)).
3.3. Square Microjets Structure and Axis-Switching
Figure 9(a) shows a sketch of underexpanded supersonic jets structure [29] [30]. As the jet emerges from the nozzle outlet, it goes through the expansion fans and expands to the ambient pressure at the jet boundary. Therefore, in the beginning, the jet size increases, and then, the jet diameter gradually decreases

Figure 8. Sample set of vertical (a–c) and horizontal (d–i) of CT-reconstructed density distributions of target supersonic microjet, circular micro nozzle, NPR = 5.0.
because of the reflection of the expansion fans as compression waves from the jet boundary. The compression waves converge and form intercepting shocks (inception, incident, or barrel shocks). Then, the intercepting shocks intersect and the reflected shocks are formed; this intersects with the jet boundary and reflects as expansion fans again; however, this process is repeated.
Based on the viewing angle, two types of schlieren images (Figure 9(c)) for square supersonic microjets are observed using multi-schlieren optical system photography. Views for the square nozzle outlet, toward the “side” represent the “symmetry view” and toward the “corner” represent the “diagonal view”. As depicted in Figure 9(b), the corner of the square micro nozzle outlet located toward the high-speed camera is used for pre-investigation and for time-series observation. The types of view for each camera are shown in Figure 9(b). Sample schlieren images for both types of views are shown in Figure 9(c) for the underexpanded square supersonic microjet, NPR = 5.0, and the schlieren images for all 20 directions are illustrated in Figure 4. As reported in [18] [19] [31], the first shock-cell composed of two types of shock waves, intercepting shock waves and recompression shock waves, can be classified into four categories, as marked by letters A, B, C, and D (Figure 9(c)). The jet expands almost two dimensionally on the symmetry planes, whereas shock waves recompress expansion on the diagonal planes, which results in a cross-shaped jet cross-section (Figure 10(d)). The size of the barrel-shaped section for a circular and square supersonic microjet, NPR = 5.0, for two types of view is Dcircular = 31 pixel = 1.24 mm, Dsquare_symmetry = 32 pixel = 1.28 mm, and Dsquare_diagonal = 35 pixel = 1.4 mm. The diagonal of a square is equal to , where S = 1 mm equals one side length of the square. Therefore, it is straightforward that the diagonal view must be wider than the symmetry view as shown in Figure 9(c) unlike that
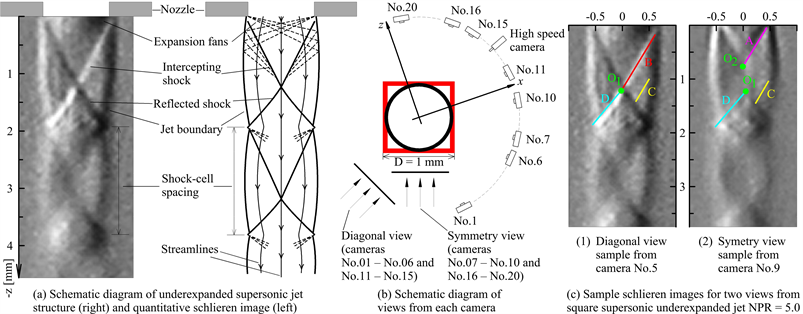
Figure 9. Structure of underexpanded supersonic jets and types of square microjets shock waves based on types of the view angle.
reported by some research papers.
Figure 10(a1) shows a sample vertical (including two shock-cells) and Figure 10(b1)-(h1) show sample horizontal CT-reconstructed distributions of density and corresponding density contour diagrams (Figure 10(a2)-(h2)) for different positions for the square underexpanded microjets, NPR = 5.0. The horizontal cross-sections are seven samples for the first shock-cell among 46 CT-reconstructed cross-sections. The overall horizontal numbers of CT-reconstructed cross-sections are 375 for microjets in this investigation. As shown in Figure 10(b) at the nozzle exit, there is almost one bright (higher density points) square-shaped cross-section. This cross-section moves away from the nozzle outlet, a brighter diamond-shaped inside a square is visible (Figure 10(c)), and then, the brighter diamond shape gradually becomes smaller and disappears. A side of the brighter diamond-shaped turns inward faster than the corner based on shock waves (A) suppression, which results in an upright cross-shaped (Figure 10(d)). In Figure 10(e) a darker (lower density areas) diamond-shaped form inside a square is visible. Then, darker diagonal cross-shaped (Figure 10(f)) forms are obtained by shock waves suppression in darker diamond-shaped corners. Moving toward the point of shocks intersection, the darker diagonal cross-shaped gradually disappears, and brighter diagonal cross-shaped form (Figure 10(g)) appears. The brighter point at the center of the diagonal cross-shaped form gradually becomes larger till it forms a brighter square shape surrounded by a diamond-shape (Figure 10(h)), which is located near the end of the first shock-cell.
By comparing cross-sections near the nozzle outlet and the near end of the first shock-cell, we can see microjet axis-switching clearly as sketched on the left side of Figure 10. Axis switching is a phenomenon in which the cross-section of an asymmetric jet develops gradually, and in such a manner that, after a certain distance from the nozzle exit, the major and the minor axes are interchanged. Therefore, as observed, the initial axis-switching is 45˚ inside the first shock-cell

Figure 10. Sample set of vertical and horizontal of CT-reconstructed density distributions of target supersonic microjet, squaremicro nozzle, NPR = 5.0.
with two types “upright” (Figure 10(d)) and “diagonal” (Figure 10(f) and Figure 10(g)) of “cross-shaped”. In this investigation, the first switchover takes place in the first shock-cell. The second occurs a little farther downstream in the second shock-cell, and the subsequent ones are usually weak; however, they may not be easily detectable.
Recently, Cabaleiro and Aider [21] observed the axis-switching of a microjet for the first time, and probably in small-scale, in this investigation is for the second time such delicate, complex and beautiful phenomenon for square microjets is observed more clearly. The deformation of a micro-vortex ring caused by induction because of corner vortices is responsible for axis switching as it occurs in large-scale non-circular jets [21] [32] [33]. Further, Zaman [32] introduced the second mechanism caused by the induced velocities of two streamwise vortex pairs situated at the ends of the major axis. These two vortex pairs can effectively resist or enhance axis-switching, which depends on their relative distribution at the edge of the nozzle.
3.4. Shock-Cells Spacing (Ls) and Supersonic Core Length (Lc)
For better evaluation of the reconstructed density values, radial and axial density distributions diagrams are illustrated in Figure 11 and Figure 12. Amplitude increases and decreases along the jet downstream, which is higher for square microjets compared to circular microjets. Thus, it reaches a peak value near the center of the diamond-like pattern and after these points gets its minimum values periodically.
Shock-cell parameters are important to characterize supersonic jets such as
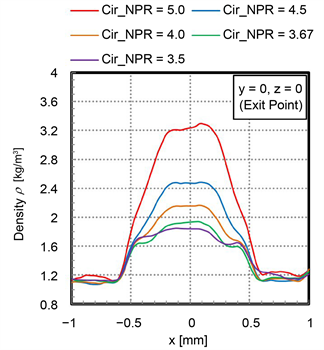 (a)
(a) (b)
(b) (c)
(c) (d)
(d)
Figure 11. Radial and axial diagrams for circular and square microjets. (a) Radial diagrams, circular microjets; (b) Radial diagrams, square microjets; (c) Axial diagrams, circular microjets; (d) Axial diagrams, square microjets.
 (a)
(a) (b)
(b)
Figure 12. Radial and axial superposition diagrams for circular and square microjets, NPR = 5.0. (a) Radial diagrams superposition, NPR = 5.0; (b) Axial diagrams superposition, NPR = 5.0.
“shock-cell spacing (length) Ls” and “supersonic core length Lc”. Note that shock-cell spacing Ls for all shock-cells can be obtained from schlieren images. The shock-cell spacing for the first five shock-cells based on our experimental data and results is depicted in Figure 13(a) and Figure 13(b) for circular and square supersonic microjets, respectively. The cross-section area of a square is larger than a circle with a diameter equal to the width of the square, and accordingly, square microjets have larger shock-cells lengths and amplitudes than circular microjets. Furthermore, the second shock-cells length is longer than the first shock-cells length for circular microjets in all nozzle pressure ratios except for NPR = 3.5 (overexpanded microjet); however, for square microjets, the second shock-cells length is shorter than the first shock-cells length. Tam and Tanna [34] and Tam [35] proposed the following relations (Equations (5) and (6)) for estimating the first shock-cell spacing (Ls) in supersonic circular [34] and square [35] jets, respectively.
(5)
(6)
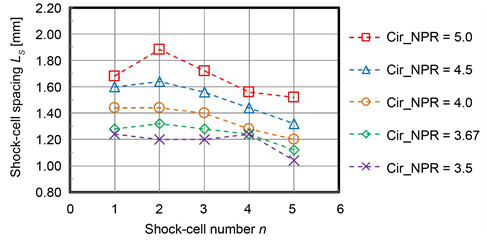 (a)
(a)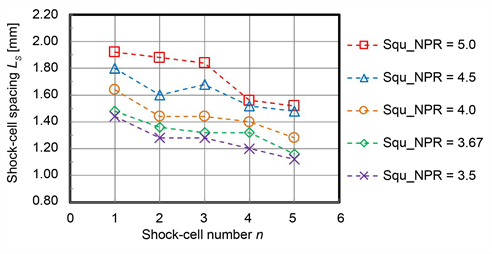 (b)
(b)
Figure 13. Shock-cell spacing (length) Ls for five shock-cells from present experimental data. (a) Circular microjets; (b) Square microjets.
where Mj, Dj, and hj are the fully expanded jet Mach number, diameter (circular jets), and width (square jets), respectively. For the first Ls, Mehta and Prasad [36] obtained a linear relation forcircular macrojets, and Phalnikar et al. [11] proposed the following correlation based on the experimental data for estimating the first shock-cell spacing Ls; no attempt was made to compute the lengths of the second and later cells for microjets.
(7)
where D is the nozzle diameter.
We compare the shock-cell spacing (Ls) determined from our experimental results and estimated using Tam, Phalnikar and Mehta’s correlations, as shown in Figure 14(a) for circular microjets and Figure 14(b) for square microjets. An overall good agreement is seen between the first Ls in this study and Tam’s correlation. However, the measured values of the Ls in our studies a little differ from those estimated by Tam’s correlation. The Ls in the present study, about 9% - 13% for circular and 4% - 8% for square microjets, are smaller than those predicted by Tam’s correlation (Equations (5) and (6)). Similar comparisons were also made by Hu and McLaughlin [37]; their Ls of about 10% was smaller than that predicted by Tam’s correlation (Equation (5)). Further, they mentioned that the difference is attributed to a thicker boundary layer caused by the low Reynolds number for the microjets, as the boundary layer thickness would be inversely proportional to that of Reynolds number, and the Reynolds number directly proportional to the nozzle outlet size [37]. Schlichting [38] for the boundary layer thickness (δ) for turbulent flow obtained one estimated equation, , where x is the distance downstream from the nozzle exit and Rex is the Reynolds number. For circular and rectangular microjets, NPR = 5.0, the boundary layer thickness within a distance equal to the nozzle diameter is almost one-pixel (0.04 mm) or rarely two-pixel (0.08 mm) and based on Schlichting equation [38] the boundary layer thickness is δ = 0.045 mm. This compares very well with the experimental values given the level of approximation.
Phalnikar et al. [11] conducted experiments using micro nozzles with internal diameters (200 μm and 400 μm) smaller than 1000 μm, and Mehta performed experiments using macro nozzles with internal diameters (23,000 and 30,000 μm) several times bigger than 1000 μm; accordingly, as shown in Figure 14(a), Phalnikar and Mehta’s correlations results are the lowest and the highest, respectively. Since the smaller nozzle exit size and accordingly low Reynolds number resulted in smaller Ls.
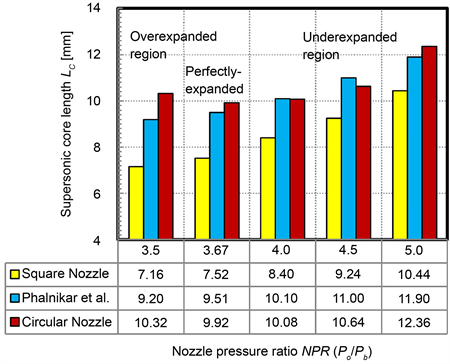
Further, “supersonic core length Lc” is usually used to characterize supersonic jets. It is defined [11] as the distance from the nozzle exit to the axial location along the centerline, where the local flow Mach number drops below 1.0 and reaches a local sonic velocity. Scroggs and Settles [9] estimated Lc as the length of the conical region surrounding shock-cells from schlieren images. Phalnikar et al. [11] proposed the following correlation (Equation (8)) for estimating Lc for circular microjets.
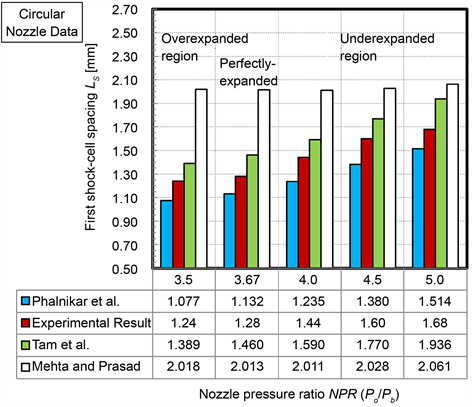 (a)
(a) (b)
(b)
Figure 14. Shock-cell spacing (length) Ls for first shock-cell. (a) Circular microjets; (b) Square microjets.
(8)
where D is the nozzle diameter and NPR = nozzle pressure ratio (Po/Pb). We used CT-reconstructed density data for estimating Lc and compared it with Equation (8), as shown in Figure 15. As depicted in Figure 15, the Lc for square microjets is less than that for circular microjets (Figure 15(a)), unlike shock-cell
 (a)
(a) (b)
(b)
Figure 15. Supersonic core length Lc and first shock-cell spacing Ls. (a) Supersonic core length Lc; (b) First shock-cell spacing Ls.
spacing Ls (Figure 15(b)) for square microjets, which is larger than that for circular microjets. A good agreement is seen between the Phalnikar relation and our circular microjets experimental data, and Equation (8) is proposed for the circular microjets and not for square microjets.
4. Conclusions
By employing the non-scanning 3D-CT technique using a 20-directional quantitative schlieren optical system, 3D-CT reconstructions of instantaneous density distributions of the shock-cells structure of circular and square supersonic microjets were obtained successfully. The results clearly demonstrated the flow pattern downstream of the micro nozzle exit. The multiple reflected waves configuration achieved a diamond-like form throughout the exhaust microjets.
A complex phenomenon for free square microjets, which is called axis switching, is clearly observed with two types “upright” and “diagonal” of “cross-shaped”. In addition, for the first shock-cells from the symmetry and diagonal views of square microjets, two different patterns of shock waves were observed.
The shock-cell spacing and supersonic core length for all nozzle pressure ratios were investigated and reported. Comparisons with experimental and theoretical computations (particularly those of Tam and Tanna [34] and Tam [35]) showed an overall remarkably good agreement for the first Ls and Lc in this study and other correlations. As microjets have low Reynolds number, some acceptable differences exist between the compared results.
Acknowledgements
I thank our colleagues from the Institute of Environmental Science and Technology, the University of Kitakyushu who provided the micro nozzles that greatly assisted the research. The supports are gratefully acknowledged for the JSPS Grants-in-Aid for Scientific Research (C)16K06118.
Conflicts of Interest
The authors declare no conflicts of interest regarding the publication of this paper.
Cite this paper
Nazari, A.Z., Ishino, Y., Ishiko, Y., Ito, F., Kondo, H., Yamada, R., Motohiro, T., Miyazato, Y. and Nakao, S. (2020) Multi-Schlieren CT Measurements of Supersonic Microjets from Circular and Square Micro Nozzles. Journal of Flow Control, Measurement & Visualization, 8, 77-101. https://doi.org/10.4236/jfcmv.2020.83005
References
- 1. Emrich, R.J. (1981) Methods of Experimental Physics: Fluid Dynamics. Academic Press, New York, 18, Part A.
- 2. Ishino, Y., Hayashi, N., Bt Abd Razak, I.F. and Saiki, Y. (2015) 3D-CT Measurement of Instantaneous Density Distributions of High-Speed Premixed Turbulent Burner Flames with a Multi-Directional Schlieren Camera (Effects of Flow Velocity on 3D Flame Front Shape). Proceedings of the 1st Thermal and Fluids Engineering Summer Conference, New York, 9-12 August 2015, 121-131. https://doi.org/10.1615/TFESC1.cbf.012970
- 3. Ishino, Y., Hayashi, N., Bt Abd Razak, I.F., Kato, T., Kurimoto, Y. and Saiki, Y. (2015) 3D-CT (Computer Tomography) Measurement of an Instantaneous Density Distribution of Turbulent Flames with a Multi-Directional Quantitative Schlieren Camera (Reconstructions of High-Speed Premixed Burner Flames with Different Flow Velocities). Flow, Turbulence and Combustion, 96, 819-835. https://doi.org/10.1007/s10494-015-9658-5
- 4. Ishino, Y., Hayashi, N., Ishiko, Y., Nazari, A.Z., Nagase, K., Kakimoto, K. and Saiki, Y. (2016) Schlieren 3D-CT Reconstruction of Instantaneous Density Distributions of Spark-Ignited Flame Kernels of Fuel-Rich Propane-Air Premixture. Proceedings of ASME Heat Transfer Summer Conference, Washington DC, 10-14 July 2016, HT2016-7423, 1-10. https://doi.org/10.1115/HT2016-7423
- 5. Ishino, Y., Hayashi, N., Ishiko, Y., Nagase, K., Kakimoto, K., Nazari, A.Z. and Saiki, Y. (2017) 3D Printing of Spark-Ignited Flame Kernels, Experimentally Captured by 3D-Computer Tomography and Multi-Directional Schlieren Photography. Heat Transfer, 139, Article ID: 020913. https://doi.org/10.1115/1.4035583
- 6. Nazari, A.Z., Ishino, Y., Motohiro, T., Yamada, R., Ishiko, Y. and Saiki, Y. (2017) Schlieren CT Measurement of 3D Density Distributions of Flame Kernels of Spark-Ignited Direct-Injection of Free, Cavity-Guided and Plane-Guided Fuel Jets. Proceedings of the 11th Asia-Pacific Conference on Combustion, Sydney, 10-14 December 2017, 297. http://www.anz-combustioninstitute.org/proceedings.php
- 7. Nazari, A.Z., Ishino, Y., Yamada, R., Motohiro, T., Ito, F., Kondo, H., Miyazato, Y. and Nakao, S. (2018) CT (Computer Tomography) Measurement of 3D Density Distributions of High-Speed Premixed Turbulent Flames (Multi-Path Integration Image-Noise Reduction Technique Based on Novel Concept of Complex Brightness Gradient in Quantitative Schlieren Images). Proceedings of the 18th International Symposium on Flow Visualization, Zurich, 26-29 June 2018, 212a. https://doi.org/10.3929/ethz-b-000279202
- 8. Nazari, A.Z., Ishino, Y., Yamada, R., Motohiro, T., Ito, F., Kondo, H., Miyazato, Y. and Nakao, S. (2019) CT (Computer Tomography) Measurement of 3D Density Distributions of Flame: Obtaining Vertical Gradient Schlieren Brightness from Horizontal Gradient for Image-Noise Reduction. Proceedings of the 4th Thermal and Fluids Engineering Conference, Las Vegas, 14-17 April 2019, TFEC-2019-27746, 185-194. https://doi.org/10.1615/TFEC2019.cbf.027746
- 9. Scroggs, S.D. and Settles, G.S. (1996) An Experimental Study of Supersonic Microjets. Experiments in Fluids, 21, 401-409. https://doi.org/10.1007/BF00189042
- 10. Aniskin, V., Mironov, S. and Maslov, A. (2013) Investigation of the Structure of Supersonic Nitrogen Microjets. Microfluid Nanofluid, 14, 605-614. https://doi.org/10.1007/s10404-012-1079-3
- 11. Phalnikar, K.A., Kumar, R. and Alvi, F.S. (2008) Experiments on Free and Impinging Supersonic Microjets. Experiments in Fluids, 44, 819-830. https://doi.org/10.1007/s00348-007-0438-4
- 12. Smedley, G.T., Phares, D.J. and Flagan, R.C. (1999) Entrainment of Fine Particles from Surfaces by Impinging Shock Waves. Experiments in Fluids, 26, 116-125. https://doi.org/10.1007/s003480050270
- 13. Bayt, R.L. and Breuer, K.S. (2001) Design and Performance of Hot and Cold Supersonic Microjets. 39th Aerospace Sciences Meeting and Exhibit, Reno, 8-11 January 2001, AIAA Paper 2001-0721. https://doi.org/10.2514/6.2001-721
- 14. Alvi, F.S., Shin, C., Elavaeasan, R., Garg, G. and Krotopalli, A. (2003) Control of Supersonic Impinging Jet Flows Using Microjets. AIAA Journal, 41, 1347-1355. https://doi.org/10.2514/2.2080
- 15. Kumar, V. and Alvi, F.S. (2006) Use of High-Speed Microjets for Active Separation Control in Diffusers. AIAA Journal, 44, 273-281. https://doi.org/10.2514/1.8552
- 16. Zhuang, N., Alvi, F.S., Alkislar, M.B. and Shih, C. (2006) Supersonic Cavity Flows and Their Control. AIAA Journal, 44, 2118-2128. https://doi.org/10.2514/1.14879
- 17. Arakeri, V.H., Krothapalli, A., Siddavaram, V., Alkislar, M.B. and Lourenco, L.M. (2003) On the Use of Microjets to Suppress Turbulence in a Mach 0.9 Axisymmetric Jet. Journal of Fluid Mechanics, 490, 75-98. https://doi.org/10.1017/S0022112003005202
- 18. Teshima, K. (1990) Three-Dimensional Characteristics of Supersonic Jets. Proceedings of the 17th International Symposium on Rarefied Gas Dynamics, Aachen, 8-14 July 1990, 1042-1048.
- 19. Tsutsumi, S., Teramoto, S., Yamaguchi, K. and Nagashima, T. (2006) Structure of Underexpanded Jets from Square Nozzles. AIAA Journal, 44, 1287-1291. https://doi.org/10.2514/1.12946
- 20. Gutmark, E.J. and Grinstein, F.F. (1999) Flow Control with Noncircular Jets. Annual Review of Fluid Mechanics, 31, 239-272. https://doi.org/10.1146/annurev.fluid.31.1.239
- 21. Cabaleiro, J.M. and Aider, J.L. (2014) Axis-Switching of a Micro-Jet. Physics of Fluids, 26, Article ID: 031702. https://doi.org/10.1063/1.4868256
- 22. Kolhe, P.S. and Agrawal, A.K. (2009) Density Measurements in a Supersonic Microjet Using Miniature Rainbow Schlieren Deflectometry. AIAA Journal, 47, 830-838. https://doi.org/10.2514/1.37332
- 23. Ezoe, M., Nakao, S. and Miyazato, Y. (2019) Quantitative Flow Visualization by Rainbow Schlieren Deflectometry and Pitot Pressure Measurements for Leek Peeler Nozzle Jets. Journal of Flow Control, Measurement & Visualization, 7, 44-60. https://doi.org/10.4236/jfcmv.2019.71004
- 24. Fukuda, H., Maeda, H., Ono, D., Nakao, S., Miyazato, Y. and Ishino, Y. (2016) Rainbow Schlieren Measurements in Underexpanded Jets from Axisymmetric Supersonic Micro Nozzles. Proceedings of the 27th International Symposium on Transport Phenomena, Honolulu, 20-23 September 2016, ISTP27-158, 1-7.
- 25. Maeda, H., Fukuda, H., Nakao, S., Miyazato, Y. and Ishino, Y. (2018) Rainbow Schlieren Measurements in Underexpanded Jets from Square Supersonic Micro Nozzles. EPJ Web Conferences, 180, Article ID: 02058. https://doi.org/10.1051/epjconf/201818002058
- 26. Foelsch, K. (1949) The Analytical Design of an Axially Symmetric Laval Nozzle for a Parallel and Uniform Jet. Journal of the Aeronautical Sciences, 16, 161-166 and 188. https://doi.org/10.2514/8.11758
- 27. Yokoi, T., Shinohara, H., Hashimoto, T., Yamamoto, T. and Niio, Y. (2000) Implementation and Performance Evaluation of Iterative Reconstruction Algorithms in SPECT: A Simulation Study Using EGS4. Proceedings of the Second International Workshop on EGS, KEK Proceedings 200-20, Tsukuba, 8-12 August 2000, 224-234. http://rcwww.kek.jp/egsconf/proceedings/2iwoegs/yokoi.pdf
- 28. Anderson, J.D. (1982) Modern Compressible Flow with Historical Perspective. McGraw-Hill Book Company, New York.
- 29. Zhao, J. (2019) Investigation on Wall Shear Stress Measurement in Supersonic Flows with Shock Waves Using Shear-Sensitive Liquid Crystal Coating. Aerospace Science and Technology, 85, 453-463. https://doi.org/10.1016/j.ast.2018.12.034
- 30. Chapman, C.J. (2000) High Speed Flow. Cambridge University Press, New York.
- 31. He, M.S., Qin, L.Z. and Liu, Y. (2015) Oscillation Flow Induced by Underwater Supersonic Gas Jets from a Rectangular Laval Nozzle. Procedia Engineering, 99, 1531-1542. https://doi.org/10.1016/j.proeng.2014.12.705
- 32. Zaman, K.B.M.Q. (1996) Axis Switching and Spreading of an Asymmetric Jet: The Role of Coherent Structure Dynamics. Journal of Fluid Mechanics, 316, 1-27. https://doi.org/10.1017/S0022112096000420
- 33. Chen, N. and Yu, H. (2014) Mechanism of Axis-Switching in Low Aspect-Ratio Rectangular Jets. Computers & Mathematics with Applications, 67, 437-444. https://doi.org/10.1016/j.camwa.2013.03.018
- 34. Tam, C.K.W. and Tanna, H.K. (1982) Shock Associated Noise of Supersonic Jets from Convergent-Divergent Nozzles. Journal of Sound and Vibration, 81, 337-358. https://doi.org/10.1016/0022-460X(82)90244-9
- 35. Tam, C.K.W. (1988) The Shock-Cell Structures and Screech Tone Frequencies of Rectangular and Non-Axisymmetric Supersonic Jets. Journal of Sound and Vibration, 121, 135-147. https://doi.org/10.1016/S0022-460X(88)80066-X
- 36. Mehta, R.C. and Prasad, J.K. (1996) Estimation of Shock-Cell Structure of Axisymmetric Supersonic Free Jets. Indian Journal of Engineering and Materials Sciences, 3, 141-147. http://nopr.niscair.res.in/handle/123456789/29795
- 37. Hu, T.F. and McLaughlin, D.K. (1990) Flow and Acoustic Properties of Low Reynolds Number Underexpanded Supersonic Jets. Journal of Sound and Vibration, 141, 485-505. https://doi.org/10.1016/0022-460X(90)90640-L
- 38. Schlichting, H. (1979) Boundary-Layer Theory. 7th Edition, McGraw Hill, New York. https://en.wikipedia.org/wiki/Boundary_layer_thickness#cite_note-3
Nomenclature
A: Cross section area [m2]
B: Brightness of schlieren image [-]
Bnj: Brightness of schlieren image in no-jet (no disturbance) condition in the test section [-]
b: Nozzle width [m]; rectangular nozzle
D: Nozzle exit diameter [m]
Dj: Fully expanded jet diameter [m]
Dt: Density thickness of deviation density [(kg/m3) (m)]; derived value
Dt': Density thickness [(kg/m3) (m)]; derived value
Dt*: Density thickness of deviation density [(kg/m3) (m)]; actual value
f: Focal length of convergent lens in schlieren system [m]
h: Nozzle height [m]; rectangular nozzle
hj: Fully expanded jet height [m]; rectangular nozzle
JPR: Jet pressure ratio (= Pe/Pb) [-]
K: Gladstone-Dale constant of air [m3/kg]
Lc: Supersonic core length [m]
Ls: Shock-cell spacing (length) [m]
Md: Nozzle design Mach number [-]
Mj: Fully expanded jet Mach number [-]
n: Shock-cell number [-]
NPR: Nozzle pressure ratio (=Po /Pb) [-]
Po: Plenum (absolute, stagnation) pressure [MPa]
Pb: Back pressure [MPa]
Pe: Exit pressure [MPa]
PG: Gauge pressure [MPa]
R: Radius of reconstruction area [m]
Re: Reynolds number [-]
Tb: Ambient temperature [K]
x, y, z: Cartesian coordinates system of reconstruction volume [m]
X(θ), Y(θ): Inclined coordinates by angle θ [m]
ΔB: Deviation brightness on schlieren image [-]
Δs: Transparent width of the light source [m]
Δρ: Deviation density [kg/m3]; derived value
Δρ*: Deviation density [kg/m3]; actual value,
δ: Boundary layer thickness [m]
θ: Angle of observation [˚ (degree)]
ρ: Density [kg/m3]; derived value,
ρ*: Density [kg/m3]; actual value
: Ambient density of air [kg/m3]; actual value
ρref: Reference density [kg/m3]