International Journal of Medical Physics, Clinical Engineering and Radiation Oncology
Vol.09 No.02(2020), Article ID:99126,9 pages
10.4236/ijmpcero.2020.92005
Investigation of Target Minimum and Maximum Dosimetric Criteria for the Evaluation of Standardized Radiotherapy Plan
—Target Minimum and Maximum Evaluation
Jialu Yu1, Huazhi Geng1, Yutao Gong1, Mitchell Machtay2, Himanshu R. Lukka3, Zhongxing Liao4, Ying Xiao1, Wei Zou1*
1Department of Radiation Oncology, University of Pennsylvania, Philadelphia, USA
2Department of Radiation Oncology, University Hospitals of Cleveland, Cleveland, USA
3Department of Radiation Oncology, Juravinski Cancer Centre at Hamilton Health Sciences, Hamilton, USA
4Department of Radiation Oncology, M D Anderson Cancer Center, Houston, USA

Copyright © 2020 by author(s) and Scientific Research Publishing Inc.
This work is licensed under the Creative Commons Attribution International License (CC BY 4.0).
http://creativecommons.org/licenses/by/4.0/


Received: January 20, 2020; Accepted: March 23, 2020; Published: March 26, 2020
ABSTRACT
Purpose: Standardization of tumor dosimetric coverage is essential for the evaluation of radiotherapy treatment plan quality. National clinical trials network RTOG protocols include tumor target dosimetric criteria that specify the prescription dose and minimum and maximum dose (Dmin and Dmax) coverages. This study investigated the impact of various minimum and maximum dose definitions using tumor control probability (TCP) models. Methods and Materials: Three disease sites (head and neck, lung, and prostate) were studied using target volume dosimetric criteria from the RTOG 0920, 1308, and 0938 protocols. Simulated target dose-volume histograms (DVHs) of Dmin and Dmax were modeled using the protocol specifications. Published TCP models for the three disease sites were applied to the DVH curves. The effects of various dose definitions on TCP were studied. Results: While the prescription dose coverage was maintained, a −3.7% TCP difference was observed for head and neck cancer when the target doses varied by 3.5% of the tumor volume from the point dose. For prostate and lung cancers, −3.3% and −2.2% TCP differences were observed, respectively. The TCPs for head and neck and prostate cancers were more negatively affected by deviations in the Dmin than the TCP for lung cancer. The lung TCP increased to a greater extent with a change in the Dmax compared with the head and neck and prostate TCPs. Conclusions: These results can be used to evaluate plan quality when the target dose only slightly deviates from the dosimetric criteria. When the overall target prescription dose coverage is maintained, the Dmax is recommended to be within 3% of the target volume: 98% (for head and neck and prostate) and 97% (for lung) of the target volume, satisfying the Dmin needed to maintain TCP variations at less than 2.1%. Using 0.03 cc instead of a point dose for Dmin and Dmax criteria minimally impacts TCPs.
Keywords:
Rodiotherapy, Target Dosimetric Criteria

1. Introduction
The imaging and radiation oncology core (IROC) provides radiation therapy (RT) quality assurance services within the national clinical trials network [1] [2] [3] [4]. IROC service operations include site qualification, trial design support, credentialing, data management, and case review [1] [2] [3] [4].
Developing dosimetry review criteria is an important part of trial design support. Adding the planning tumor volume (PTV) to the dosimetry review criteria is necessary to achieve the tumor control probability (TCP) of the protocol [5]. PTV dosimetry review usually includes checking the prescription dose coverage of the PTV, as well as the minimum absorbed dose (Dmin) and the maximum absorbed dose (Dmax) in the PTV [6]. According to the ICRU report [7], the Dmin might not be accurately determined since it is often located in a high-gradient region at the edge of the PTV, making it highly sensitive to the resolution of the calculation and the accuracy of either delineating the CTV or determining the PTV. Reporting of the Dmin was replaced by the more accurate near-minimum absorbed dose, which is the dose covering 98% of the PTV (D98%) [7]. Similarly, the dose covering 2% of the PTV (D2%) was recommended to be reported as the Dmax [7]. However, alternative specifications of Dmin and Dmax are being used in different clinical settings, for example, the dose covering 99% of the PTV (D99%) and the dose covering 1% of the PTV (D1%), respectively. In RTOG protocols [6], Dmin is usually reported as the dose covering the total PTV minus 0.03 cc (Dvol – 0.03 cc), and Dmax is usually reported as the dose covering 0.03 cc of the PTV (D 0.03 cc).
The purpose of this study is to show the effects on TCP of different specifications of Dmin and Dmax of the target volume. The dosimetric criteria for three disease sites (head and neck, lung, and prostate) from the RTOG 0920, 1308, and 0938 protocols were adopted. We propose a simulated model for PTV dose-volume histograms (DVHs) of typical RT plans that incorporate the specified Dmin and Dmax values as variables. The DVHs were applied to the published TCP models to investigate the variations in TCP when the Dmin is between 0% and 3.5% of the PTV and when the Dmax is between 100% and 96.5% of the PTV. The effects of PTV changes on lung cancer were also studied.
2. Methods and Materials
2.1. Target DVH Models
RTOG protocols are used to specify radiotherapy treatment plan quality criteria for clinical trials. Our study adopted the tumor target coverage criteria from the RTOG 0920 protocol for head and neck cancer, the RTOG 1308 protocol for non-small cell lung cancer (NSCLC), and the RTOG 0938 protocol for prostate cancer. The tumor volume dosimetry criteria for these three protocols are listed in Table 1, which include 1) the prescription dose coverage of D95%; 2) Dmax criteria that specify the maximum dose for the PTV; and 3) Dmin criteria that specify the minimum dose for the PTV. As the DVH represents the cumulative coverage of a distributed dose obtained in individual PTV voxels, when such a dose is simulated by a truncated, skewed, Gaussian distribution, the DVH curve can be simulated to satisfy all three dosimetry criteria. The truncated points at the left and right two tails represent the Dmin and Dmax that the tumor receives, respectively. Figure 1 plots the simulated DVHs for the three disease sites.
Variations in the nominal DVH can be reconstructed when the defined Dmin and Dmax values deviate from the point dose. Here, the Dmax deviation is defined

Table 1. PTV dosimetry criteria and TCP model parameters.
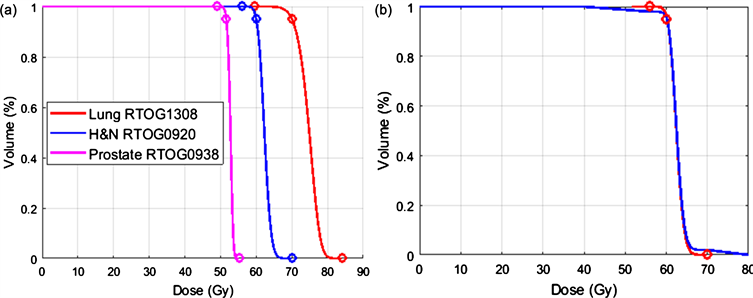
Figure 1. (a) The simulated nominal DVHs that satisfy the dosimetric criteria from the RTOG 0920, 1308, and 0938 protocols. The circles represent the prescription dose and the Dmin and Dmax criteria from the protocols. (b) A reconstructed DVH (blue) with deviations in the Dmin and Dmax values from the nominal DVH (red) for the RTOG 0920 protocol. Shown here is the Dmax at 1% (η = 1) and the Dmin at 99% (δ = 1) for 40 Gy ≤ PTV dose ≤ 80 Gy.
as η% of the PTV, and the Dmin deviation is defined as (100 − δ)% of the PTV. In this study, we investigated the variations in the Dmin and Dmax values up to 3.5% of the PTV, that is, η and δ variations from 0 to 3.5. The actual Dmin and Dmax values of the entire PTV were considered additional variables that were assumed to vary from 5 to 30 Gy from the defined Dmin and Dmax criteria.
2.2. TCP Models for the Three RTOG Protocols
To examine the effects of changes in the PTV DVH coverage, we employed published TCP models. RTOG 0920 is a phase III study of postoperative RT for locally advanced resected head and neck cancers, with a prescription dose of 60 Gy and Dmin and Dmax values of 70 Gy and 56 Gy, respectively. Okunieff et al. [8] published a TCP model with local control 50% dose (D50) and as the change in TCP when a 1% change in dose around D50 occurs:
. (1)
For head and neck cancer, the D50 and used were 51.77 Gy and 2.28, respectively.
RTOG 1308 is a phase III randomized trial comparing overall survival after either photon chemoradiotherapy or proton chemoradiotherapy for inoperable stage II–IIIB NSCLC. The target volume dosimetry review criteria are as follows: the prescription dose for PTV is 70 Gy, the Dmax should not exceed 84 Gy, and the Dmin should not drop below 59.5 Gy (Table 1). The TCP model derived from the logistic expression was used for the calculation [9]:
(2)
The parameters for this model were obtained from a study by Martel et al. in 1999 [10] on local progression-free survival at 30 months, where D50 and were 84.5 Gy and 1.5, respectively (Table 1). To further study the volume effects on TCP, the Fenwick [11] and Martel models were used in a side-by-side comparison using 200-, 400-, and 600-cc tumor volumes having similar DVH curves:
(3)
where D50 = 84.6 Gy, m = 0.329, c = 9.58, V is the volume in cc, and φ is a Gaussian integral.
RTOG 0938 is a randomized phase II trial of hypofractionated radiotherapy for favorable-risk prostate cancer. In one of the two treatment legs, the prescription dose for PTV was 51.6 Gy in 4.3 Gy fractions; the Dmax (no more than 0.03 cc of the PTV as defined by the RTOG protocol) should not exceed 55.21 Gy, and the Dmin (no more than 0.03 cc of the PTV as defined by the RTOG protocol) should not drop below 49.05 Gy (Table 1). The same TCP formula, as shown in Equation (1), was used, with parameters from a study by Levegrun et al. [11] (Table 1).
The differential DVH where a dose and corresponding volume fraction of the PTV was derived for a given DVH curve from the DVH model described above. The values were utilized in the corresponding disease site TCP models to obtain the volumetric average TCP for a given DVH curve. For each disease site, the TCP was first calculated with the modeled nominal DVHs. The impact of the Dmin and Dmax variations was assessed using the calculated TCPs from the different DVHs.
3. Results
Using a truncated, skewed, Gaussian distribution, the nominal DVHs that satisfy all three RTOG protocols can be simulated to satisfy the specified PTV volume dosimetry criteria. The truncated tails represent the Dmin/Dmax point doses. These results are shown in Figure 1(a). Figure 1(b) shows the reconstructed DVH with the defined Dmax at 1% (η = 1) and the defined Dmin at 99% (δ = 1) of the tumor volume, where the PTV dose covering the entire volume is greater than or equal to 40 Gy and less than or equal to 80 Gy. This DVH maintains the prescription dose coverage as the nominal DVH.
The nominal and altered DVHs with the given η and δ values were used to calculate the volumetric average TCP. The differences were examined as a function of η and δ, where η and δ vary from 0 to 3.5. Figure 2(a) and Figure 2(b) show the variations in TCP for head and neck cancer and prostate cancer caused by deviations in the Dmin and Dmax from the RTOG 0920 and 0938 protocols using the TCP models described by Okunieff et al. [9] and Levegrun et al. [11], respectively. The head and neck TCP was found to vary from −3.7% to 0.4% with the Dmin and Dmax deviations from the nominal TCP of 86.5% using the RTOG 0920 criteria. The prostate TCP was found to vary from the nominal TCP of 94.2%, and a large variation of −3.3% occurred when the Dmin deviated from the criteria. Figure 2(c) shows the variations in the lung TCP from the nominal value of 32.4% using the Martel model. The TCP value is reduced by −2.2% when the Dmin is 96.5% of the PTV volume. When the volume of the PTV is considered in the Fenwick model, the change in TCP varies with tumor size. In our sampling of patients with stage II–IIIB NSCLC, the lung PTV was determined to be 378 ± 196 cc (n = 32). We selected tumor sizes of 200 cc, 400 cc, and 600 cc using the Fenwick model to study lung TCP variations with Dmin and Dmax deviations, as shown in Figures 2(d)-(f). At smaller volumes (e.g., 200 cc), the nominal TCP is larger (54.0%) at the same prescription dose but is reduced to 35.7% and 23.1% at larger volumes of 400 cc and 600 cc, respectively. The variations in TCP due to the Dmax definition of η = 3.5% were 2.4%, 2.8%, and 2.8%, but was less than –0.3% from the Dmin defined as (100 − δ)% of the volume. The TCP variations with η or δ equaling 1%, 2%, or 3% in these models at the three disease sites are listed in Table 2. The TCP values for head and neck cancer and prostate cancer, but not lung cancer, are negatively affected by deviations in Dmin. The lung TCP value increased to a greater extent when the Dmax value varied
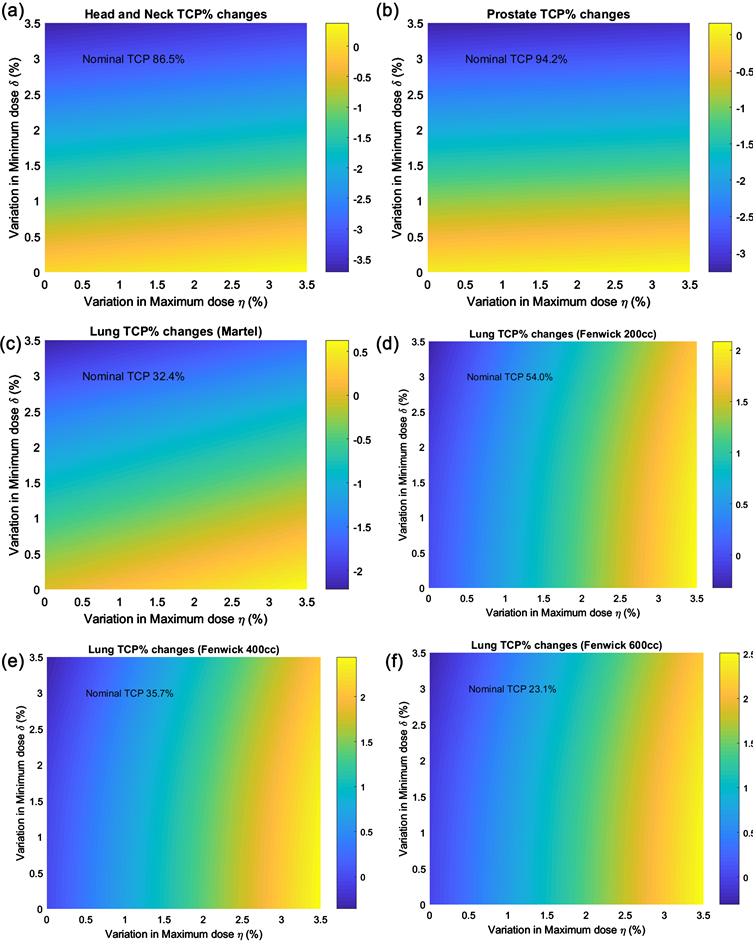
Figure 2. Two-dimensional plots of TCP variations from head and neck, prostate, and lung models due to variations from the defined Dmin/Dmax values of (100 − δ)% and η% of the PTV.
Table 2. Modeled TCP variations from nominal values with η or δ equaling 1%, 2%, or 3% using dosimetric criteria from the RTOG 0920, 1308, and 0938 protocols.
from the head and neck and prostate targets.
4. Discussion
The TCP calculations performed in this study were all based on the simulated target DVHs that assume that the dose distribution in the target is a skewed Gaussian distribution and fitted to the criteria from the RTOG protocols. Separate published TCP model parameters at three different disease sites were used to study the TCP variations of different specifications of Dmax and Dmin evaluations of PTV. TCP was observed to vary as the relative volume definitions of Dmax and Dmin changed, according to the results shown in Table 2; a deviation in Dmax up to 3% of the volume did not result in an increase in the TCP (≤2.1%) during the radiotherapy treatment of lung, head and neck, and prostate cancers. This finding is because slightly greater target volumes receive a higher dose of RT. When the Dmin definition deviated from the point dose, a greater volume received less than the Dmin value, and the TCP was likewise reduced. For head and neck and prostate cancers, the reduction in TCP can approach −3.2% and −2.8%, respectively, when the Dmin is defined as 97% of the volume. If one limits the Dmin deviation to 97%, the TCP will decrease by no more than −1% using either the Martel or Fenwick model. In our sampling of patients using RTOG protocols, the PTV volumes was evaluated to be 378 ± 196 cc (lung, n = 32), 353 ± 230 cc (head and neck, n = 73), and 95 ± 32 cc (prostate, n = 148). Therefore, when the Dmin and Dmax values are defined as 0.03 cc of the PTV as in the current RTOG protocols [6], 0.03 cc as a negligible percentage of tumor volume will correspond to negligible TCP variations for lung, head and neck, and prostate volumes. If one limits the TCP variations within 2.1%, the definition of the Dmin should be kept at 98% for patients with head and neck and prostate cancer, but relaxed to 97% for lung cancer, whereas D3% can be used as the Dmax.
Although a thorough literature search was performed for TCP models and related parameters used in this study, we acknowledge that the calculated TCP values only provide very rough predictions. Further studies to incorporate biological theories and more practical empirical modeling [12] of predictions of tumor control are ongoing. We also recognize that the assumptions implicit in skewed Gaussian distributions are not realistic for all patient plans. However, despite these rough predictions, we believe that the model calculations used in this study can still be applied to elucidate meaningful dosimetric parameters for evaluations of radiotherapy plan quality.
5. Conclusions
Our study investigated the effects on TCP by deviations in the Dmin and Dmax values up to 3.5% of the tumor volume for head and neck, lung, and prostate cancer patients, using published TCP models and parameters. The results of this study can be used for plan quality evaluations when the Dmin and Dmax values slightly deviate from the point dose. When the overall target prescription dose coverage is maintained, it is recommended that the Dmax be within 3% of the PTV: 98% (for head and neck and prostate) and 97% (for lung) of the target volume, satisfying the Dmin to maintain TCP variations at less than 2.1%. Using 0.03 cc instead of the point dose for Dmin and Dmax values at all three disease sites minimally impacts TCPs.
One drawback of this study is that the conclusion is made solely based on simulations. There is no consensus on TCP models; therefore, two models were selected to compare the results. In the future, more clinical data from the above-mentioned clinical trials will be available with patient outcome. Tumor control probability should be evaluated with real patient dose distributions to make the conclusions from this research more acceptable to clinical practices.
This work is funded by NCI for clinical trial data quality assurance (QA). The research outcome of this work directly impacts the daily QA workflow performed by IROC.
Funding
This project was supported by grants U10CA180868 and U24CA180803 from the National Cancer Institute.
Conflicts of Interest
The authors declare no conflicts of interest regarding the publication of this paper.
Cite this paper
Yu, J.L., Geng, H.Z., Gong, Y.T., Machtay, M., Lukka, H.R., Liao, Z.X., Xiao, Y. and Zou, W. (2020) Investigation of Target Minimum and Maximum Dosimetric Criteria for the Evaluation of Standardized Radiotherapy Plan. International Journal of Medical Physics, Clinical Engineering and Radiation Oncology, 9, 43-51. https://doi.org/10.4236/ijmpcero.2020.92005
References
- 1. Bekelman, J.E., Deye, J.A., Vikram, B., et al. (2012) Redesigning Radiotherapy Quality Assurance: Opportunities to Develop an Efficient, Evidence-Based System to Support Clinical Trials—Report of the National Cancer Institute Work Group on Radiotherapy Quality Assurance. International Journal of Radiation Oncology · Biology · Physics, 83, 782-790. https://doi.org/10.1016/j.ijrobp.2011.12.080
- 2. Purdy, J.A. (2008) Quality Assurance Issues in Conducting Multi-Institutional Advanced Technology Clinical Trials. International Journal of Radiation Oncology · Biology · Physics, 71, S66-S70. https://doi.org/10.1016/j.ijrobp.2007.07.2393
- 3. Palta, J.R., Deye, J.A., Ibbott, G.S., et al. (2004) Credentialing of Institutions for IMRT in Clinical Trials. International Journal of Radiation Oncology · Biology · Physics, 59, 1257-1259. https://doi.org/10.1016/j.ijrobp.2004.03.007
- 4. Fitz Gerald, T.J. (2014) A New Model for Imaging and Radiation Therapy Quality Assurance in the National Clinical Trials Network of the National Cancer Institute. International Journal of Radiation Oncology · Biology · Physics, 88, 272-273. https://doi.org/10.1016/j.ijrobp.2013.09.030
- 5. Carrie, C., Hoffstetter, S., Gomez, F., et al. (1999) Impact of Targeting Deviations on Outcome in Medulloblastoma: Study of the French Society of Pediatric Oncology (SFOP). International Journal of Radiation Oncology · Biology · Physics, 45, 435-439. https://doi.org/10.1016/S0360-3016(99)00200-X
- 6. NRG Oncology Center for Innovation Website. https://www.nrgoncology.org/Clinical-Trials
- 7. Grégoire, V. and Mackie, T.R. (2011) State of the Art on Dose Prescription, Reporting and Recording in Intensity-Modulated Radiation Therapy (ICRU Report No. 83). Cancer Radiotherapie, 15, 555-559. https://doi.org/10.1016/j.canrad.2011.04.003
- 8. Okunieff, P., Morgan, D., Niemierko, A., et al. (1995) Radiation Dose-Response of Human Tumors. International Journal of Radiation Oncology · Biology · Physics, 32, 1227-1237. https://doi.org/10.1016/0360-3016(94)00475-Z
- 9. Suit, H., Shalek, R. and Wette, R. (1965) Cellular Radiation Biology. 514-530.
- 10. Martel, M.K., Ten Haken, R.K., Hazuka, M.B., et al. (1999) Estimation of Tumor Control Probability Model Parameters from 3-D Dose Distributions of Non-Small Cell Lung Cancer Patients. Lung Cancer, 24, 31-37. https://doi.org/10.1016/S0169-5002(99)00019-7
- 11. Fenwick, J.D., Nahum, A.E., Malik, Z.I., et al. (2009) Escalation and Intensification of Radiotherapy for Stage III Non-Small Cell Lung Cancer: Opportunities for Treatment Improvement. Clinical Oncology, 21, 343-360. https://doi.org/10.1016/j.clon.2008.12.011
- 12. Levegrün, S., Jackson, A., Zelefsky, M.J., et al. (2002) Risk Group Dependence of Dose-Response for Biopsy Outcome after Three-Dimensional Conformal Radiation Therapy of Prostate Cancer. Radiotherapy and Oncology, 63, 11-26. https://doi.org/10.1016/S0167-8140(02)00062-2