Modeling and Numerical Simulation of Material Science
Vol.4 No.1(2014), Article ID:41611,7 pages DOI:10.4236/mnsms.2014.41001
Heat Transfer Analysis during External Chilling of Composite Material Castings through Experimental and Finite Element (FE) Modelling
Mechanical Engineering, H.M.S. Institute of Technology, Tumkur, India
Email: joelhemanth@hotmail.com
Copyright © 2014 Joel Hemanth. This is an open access article distributed under the Creative Commons Attribution License, which permits unrestricted use, distribution, and reproduction in any medium, provided the original work is properly cited. In accordance of the Creative Commons Attribution License all Copyrights © 2014 are reserved for SCIRP and the owner of the intellectual property Joel Hemanth. All Copyright © 2014 are guarded by law and by SCIRP as a guardian.
Received November 8, 2013; revised December 10, 2013; accepted December 17, 2013
Keywords:Solidification; Heat; Chill; Casting; Temperature
ABSTRACT
In controlled solidification, one of the important factors that affects heat transfer from the solidifying casting is the resistance offered at the casting/chill interface. In the present investigation, heat transfer analysis during solidification of Al-12%Si (LM 13) alloy is carried out by collecting temperature history of the solidifying casting. The temperature distribution during solidification in the present investigation is obtained using ANSYS multi physics software and further for comparison. The temperature profiles are also obtained by FE (Finite Element) modelling using the same software. By using a temperature data logger and lab view based software, the temperature data is acquired and processed at every second. The cooling curves obtained are analysed to know the effect of chilling on solidification behaviour of Al-12%Si alloy castings. Finally, it is concluded from the above research that the cooling curves and temperature distribution obtained by FE analysis do not so closely converge with the experimental data due to modelling limitations.
1. Introduction
With the increasing demand for stringent properties and high quality castings, controlled solidification has become the present need. Many of the early metallic materials failed when exposed to complex requirements of industrial, automotive and structural applications due to unsoundness.
Hence, the controlled heat transfer during solidification forms an essential area of investigation. Controlling the rate of solidification using chills is one among many existing foundry practices and use of chills during the solidification plays a major role in promoting directional solidification [1-5].
In recent years, research in the area of numerical modelling of solidification is gaining much importance [6].
The computer simulation of freezing patterns in casting has done much to broaden the understanding of solidification of materials. The way by which the heat flows across the casting/chill interface strongly affects the evaluation of solidification and plays a remarkable role in the structural integrity of castings. Heat transfer at chill/metal interface during solidification is the driving factor in determining the microstructure and mechanical properties of the material [7,8]. It becomes significant when the solidifying metal and the chill have reasonably good conductance. Depending on the material and the size, chills increase heat transfer rate affecting the microstructure and hence altering the mechanical properties of the castings. To understand the behaviour at chill/casting interface during solidification, several experimental methods are available [9] since solidification does not occur under equilibrium conditions. But still the cooling curve method is popularly used to understand and interpret the temperature-time data collected during solidification [10-13].
It is often difficult to obtain the analytical solution for phase change problems in multi-dimensions. Therefore, in the literature, some preliminary studies of solidification of metals using a finite difference technique have been reported [14] in order to analyse the factors affecting the rate of cooling. These factors include the material properties, and the heat sink temperature. The previous results, however, have neglected the effect of natural convection in the liquid melt [15]. Several experimental results have confirmed that convection has an important role in solid/liquid phase change [16-18].
The simulation method was based on an axi-symmetric model with enthalpy formulation of the energy equation coupled with the momentum equations and thus simulation has taken natural convection into account during the freezing process. Further, calculations are done by using the finite volume analysis with SIMPLER algorithm for pressure correction and other processing parameters affecting the rate of solidification [19].
Earlier, there have been several attempts to model and simulate the process of solidification of materials but the physics of microstructural solidification is not completely understood [20]. In addition, the generation of accurate finite element and finite difference solutions may take prohibitive amounts of computational time. Brown and Spittle [21] pointed out from their investigation that finite element and finite difference analysis methods can offer powerful solutions to solidification problems. The primary and most obvious phenomenon during solidification is the transfer of heat from the cooling casting to the sand mould. Provision of chills in the mol corresponds to an appropriate interfacial heat-transfer coefficient value across the chill/metal interface [22-25]. Since the objective of feeding design is to keep hot spots in the feeder, the reliability of a numerical analysis would largely depend on the heat-transfer modelling across the metal-mould interface. There has been great interest on the experimental side as well as on the numerical research side in understanding the complexity of the heat transfer across the casting mould interface. In the present investigation, heat transfer at the chill/casting interface is obtained by obtaining temperature history at the interface using thermocouples. Thermocouples are extensively used to measure dynamic or transient temperature history at strategic locations in the mould or in the solidifying melt.
The temperature history is obtained using data logging and acquisition system. The cooling curve method is the most widely used method for investigating solidification of metals and alloys. Cooling curves thus obtained from the data are finally analysed. In order to know the temperature distribution during solidification, a simple macro modelling and simulation of casting was carried out using a software code. Therefore, the present work uses ANSYS multi physics code to model phase change during solidification and to know the temperature distribution during solidification. The application and setup is the most simplistic and therefore can be widely used by both academic and industry researchers. The setup involves placing a thermocouple in the melt and allowing the melt to solidify while temperature is recorded as a function of time.
2. Experimental Procedure
The heat transfer analysis during solidification in the present investigation is carried out by thermo-couple method. Encapsulated K-type (Chromel-alumel) thermocouples were inserted in to sand mould at location T1, the chill/casting interface, and at other two locations T2 & T3, entirely within the solidifying casting. The locations on the centre line are at chill/casting interface (T1) and at other two points at 20 mm (T2) and 40 mm (T3) away from it (Figure 1). The thermocouples are connected to the temperature data logger, which is inturn, connected to the computer. Using Lab view based Scanner IV software, the temperature data is acquired and processed every second after the melt is poured into the sand mould at 700˚C. Pilot trials are run and all steps are taken to avoid uncertainties during temperature measurement. Figure 2 shows Al-12% Si alloy castings after solidification along with thermocouples.
The casting dimensions of 112.5 mm × 75 mm × 25 mm (AFS standard) are considered for heat transfer analysis. The temperature history is acquired for 20 minutes and is processed by the software to give temperature Vs time graph (cooling curve). The analysis is carried out for solidification against copper end chill. The temperature data logger is capable of collecting data from 12 channels at a time and the unit is provided with LCD display for temperature, channel number and scan delay. The data from the temperature data logger is fed to PC through RS232 communication port where the data is captured through data acquisition software.
2.1. Finite Element Modelling and Meshing.
The 2-D analysis of the composite casting is carried out assuming unit thickness. The geometry of the model is as shown in the Figure 3 and the finite element model is as

Figure 1. Schematic representation of the experimental setup with data acquisition system.
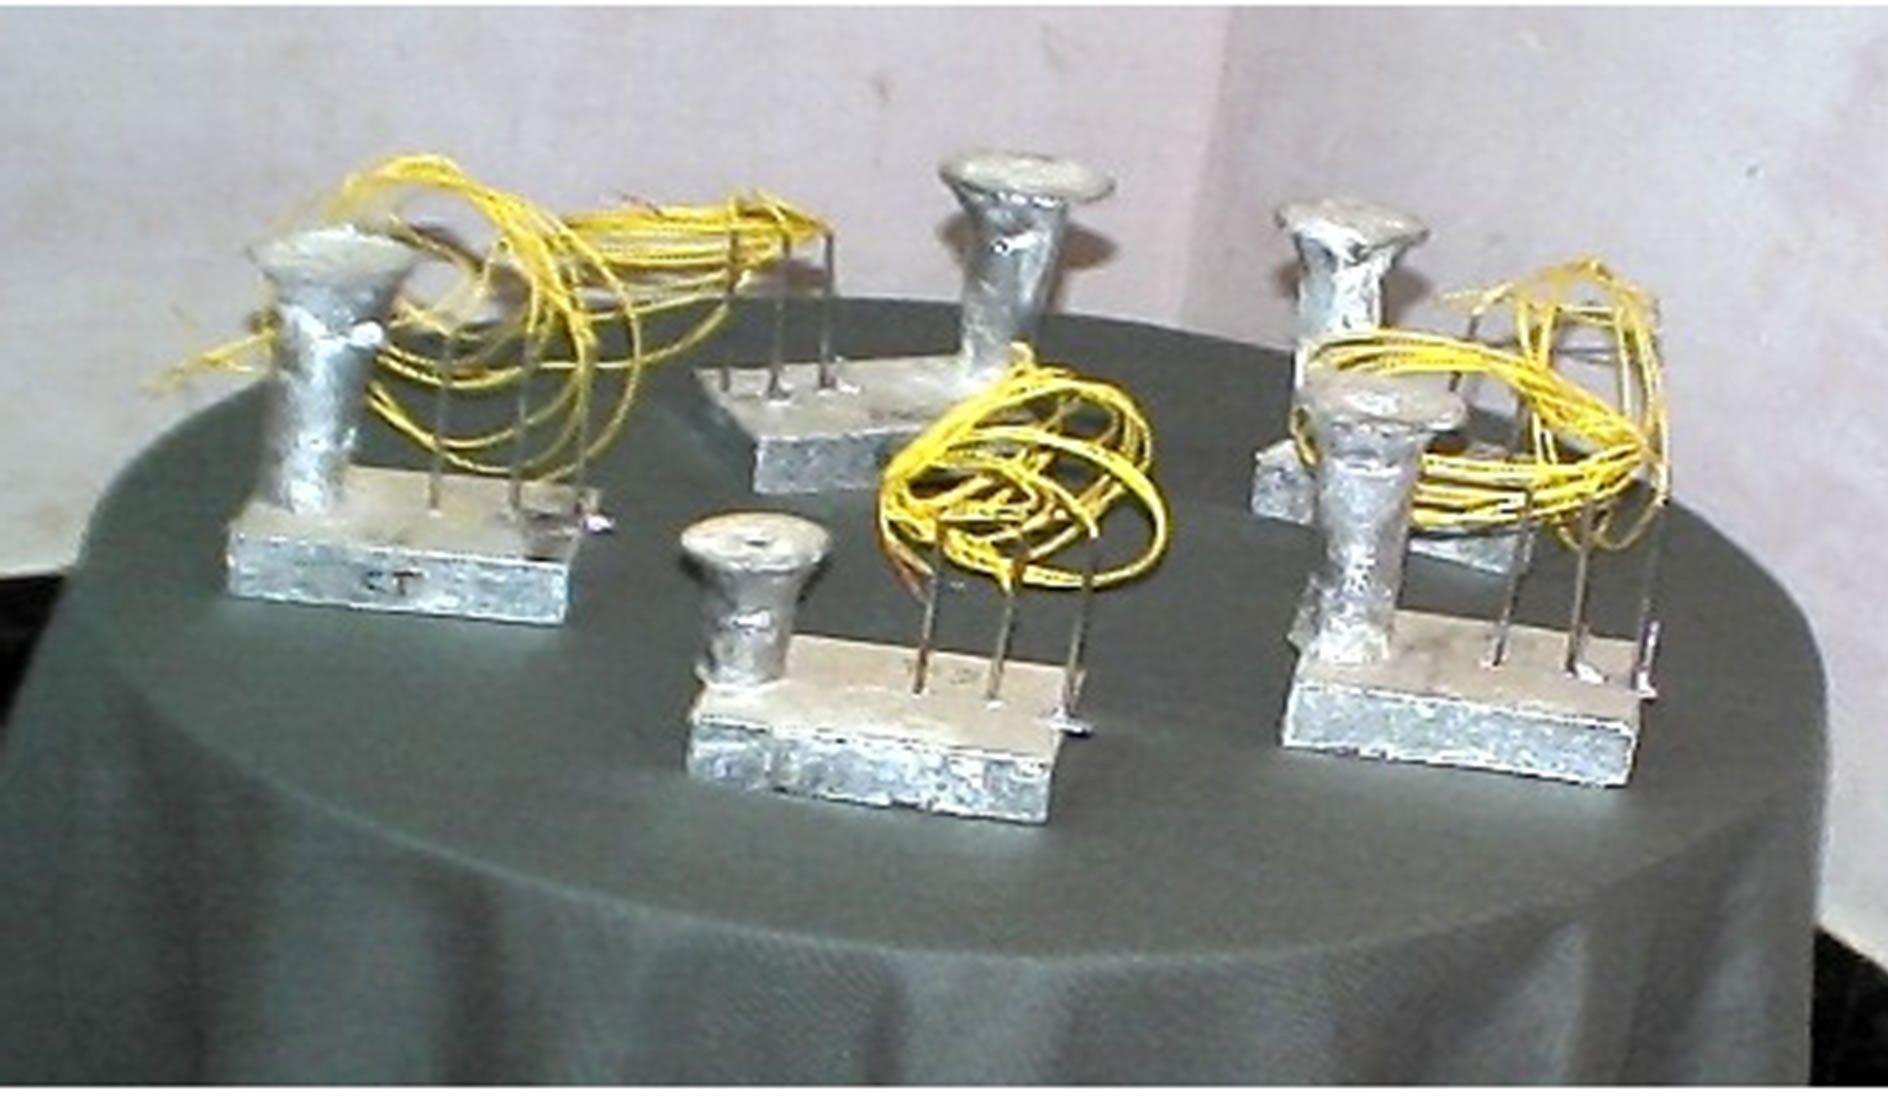
Figure 2. Castings after solidification along with thermocouples.
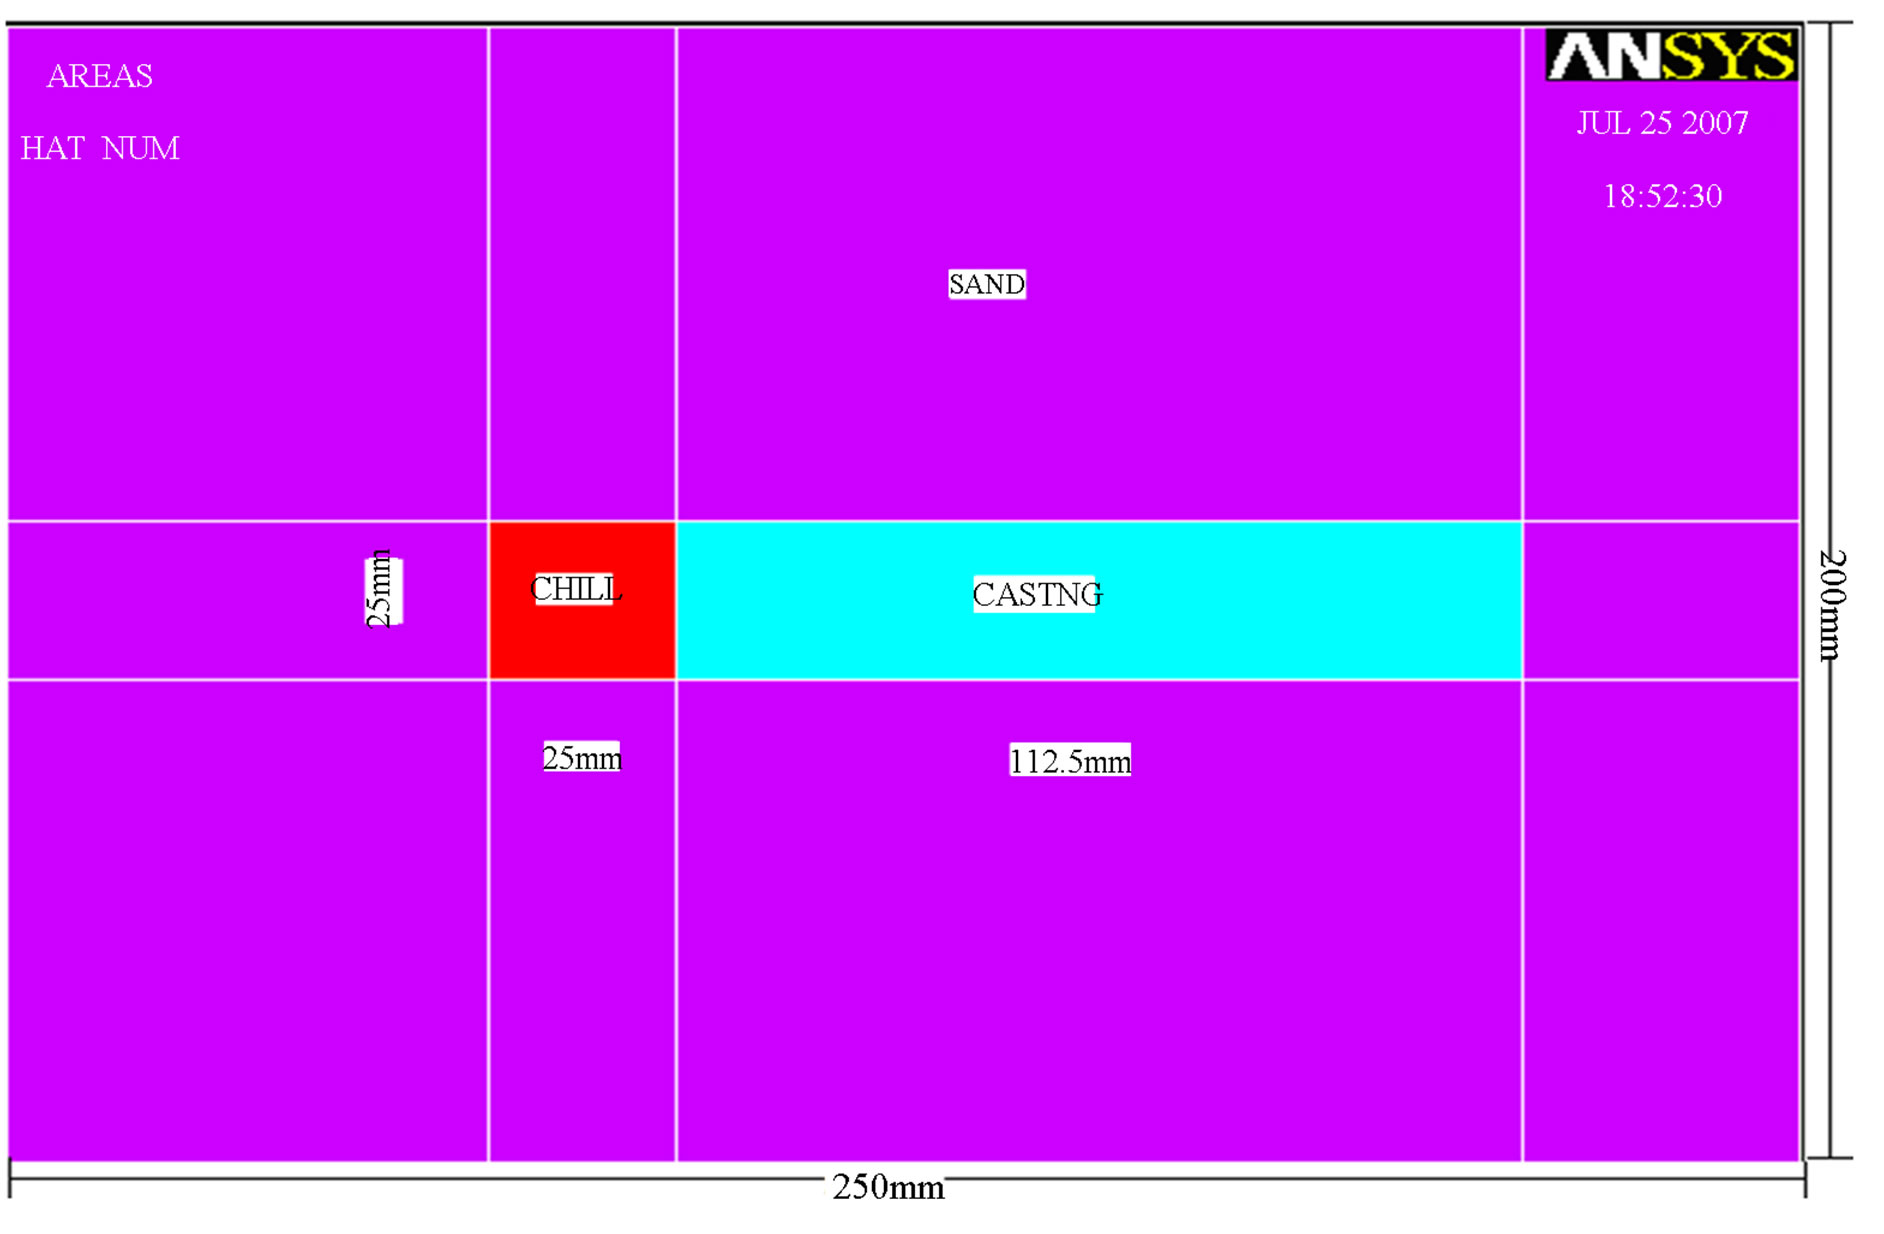
Figure 3. Geometry of Finite Element (FE) model.
shown in the Figure 4. Finite elements model consist of 8435 2-D thermal solid elements, 6935 for the sand mould, 992 for the metal and 400 for the chill. The total number of nodes in the model is 8035.
The element has four nodes with a single degree of freedom (temperature) at each node.
The shape function for this finite element is:
 (1)
(1)
where TI, TJ, TK, and TL are nodal temperatures, s and t axis of local (element based) coordinate system. Boundary and initial conditions: on the boundary of the model, excluding axis of symmetry, a constant value for film coefficient (hf = 7.5W/m2˚C), air temperature (T0 = 30˚C), uniformly distributed initial temperatures of sand (T0 = 30˚C) and alloy (T2 = 700˚C) temperatures were considered.
2.2. Finite Element Procedure
The analysis is carried out for copper end at temperatures T1, T2, & T3 locations of the casting during solidification and the cooling curves are also obtained for the analysis. The geometry of the FE model is as shown in Figure 5.
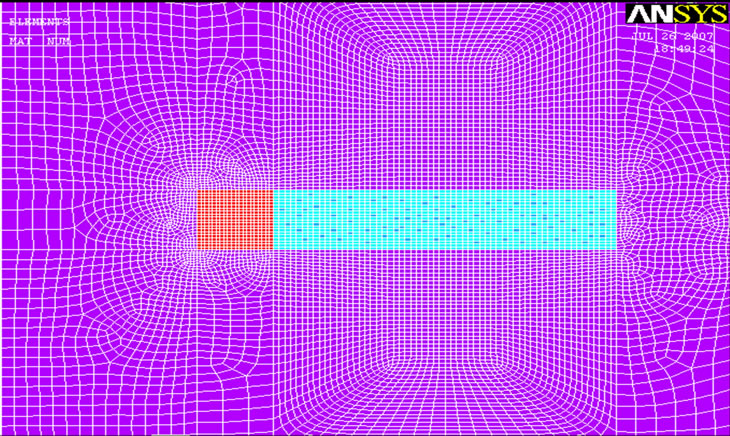
Figure 4. Meshed model of the chill and the mould.

Figure 5. Geometry of the finite element model.
The part to be cast is assumed to be at the centre of the mould box of length 250 mm and width 200 mm. The molten metal is introduced into the mould at 700˚C. The mould is initially at 30˚C. The top face and side of the mould exchange heat with the environment by free convection. The ambient temperature is taken as 30˚C and film co-efficient on the side of the mould is 7.5˚C W/m2˚C and 5.75 W/m2˚C on the top. Axi-symmetric behaviour is assumed for sand mould and metal melt.
The temperatures of the melding sand and the chill are assumed to be constant and uniform throughout. A transient analysis is set up using initial conditions with sand mould at 30˚C and metal melt at 700˚C. The side and top convective loads are included on the mould exterior. No surface boundary conditions are specified on the bottom or centreline.
In order to understand temperature distribution during solidification heat transfer, two-dimensional FE modelling and analysis has been investigated. The comercially available ANSYS multi-physics software code is used for the present analysis. For simplicity, only conductive heat transfer after pouring is considered for modelling and analysis but physical properties of chill and the sand materials do not vary during solidification. Varying specific heat and thermal conductivity are considered as material properties. Modelling is done using PLANE55 first order quadrilateral element. The ANSYS code uses backward Euler time integration method for solution [26].
3. Results, Discussions and Analysis
3.1. Numerical Modelling
According to the first law of thermodynamics, the total heat of a closed system remains unchanged. As applied on differential control volume, one can state:
 ……. (2)
where: ρ, density, c, specific heat, t, time,  , temperature distribution function,
  - heat flux vector,
  -heat generation rate per unit volume. Equation (2) is the so-called transport equation for thermal energy.
It should be realized that the terms  and
and  might also be interpreted as grad T and
 , respectively. Then, it clearly highlights the various transport processes: the first term on the left hand side of Equation (2) is rate of change term, the second is convective term, and the third is diffusive term, while on the right hand side of the equation there is the source term (regarding a differential control volume). Fourier’s law was used to relate the heat flux vector to the thermal gradients:
 (3)
(3)
[D] is the conductivity matrix, Kxx, Kyy, Kzz-conductivity in the element x, y, and z directions, respectively.
Combining Equations (2) and (3), assuming that all effects are related to the global Cartesian system:
 (4)
(4)
Three types of boundary conditions are considered. It presumes that these cover the entire element.
a) T = T*, where T* is specified temperatures acting over surface S1;
b) , where q*-specified heat flow acting over surface S2,
  -unit outward normal vector, c)
 , specified convection surfaces acting over surface S3 (Newton’s law of cooling), where hf is film coefficient evaluated at
  (unless otherwise specified for the element), TB-bulk temperature of the adjacent fluid, TS-temperature at the surface of the model.
If we introduce  as vector of nodal temperatures, changes in temperature over element and time domain
  could be presented as:
 (5)
(5)
where , element shape function.
After some manipulation and integration over element volume, using relation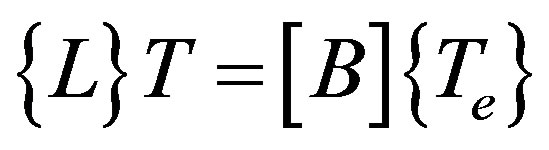 , where
  T Equation (4) can be written as:
 (6)
(6)
Mould density assumed to remain constant over the volume of the element. Nodal quantities ,
,  and
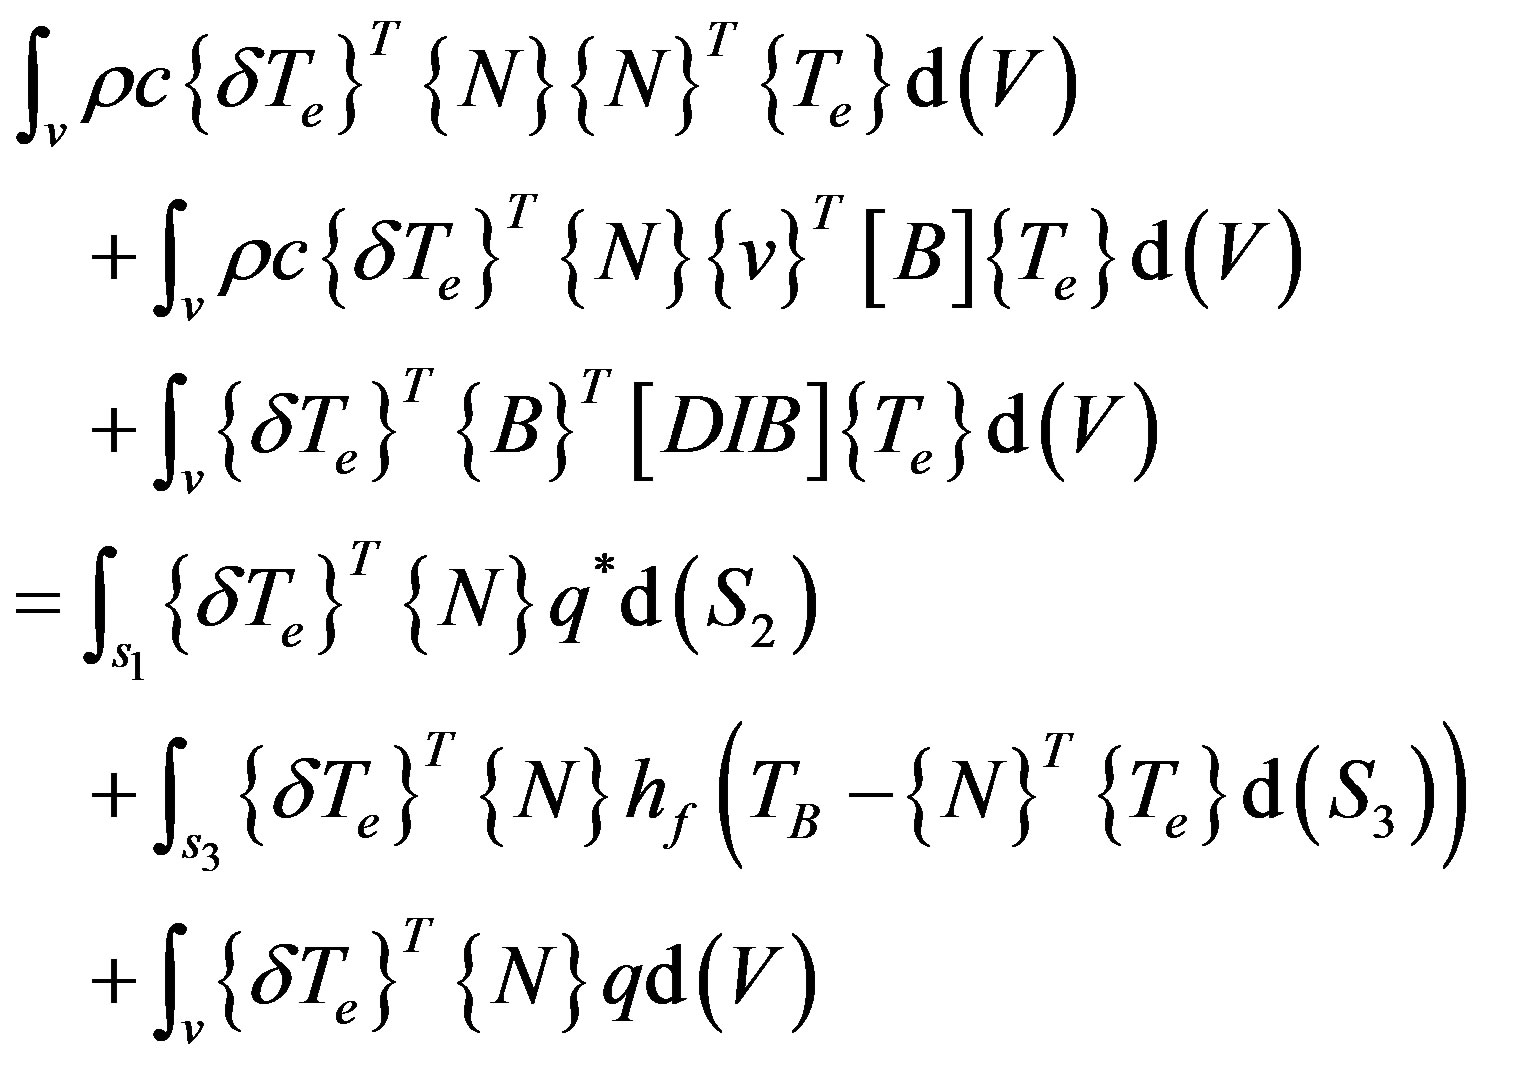
and  are constant in the domain of the element and they can be removed from the integral, while c and q may vary over the element, so after some manipulation yields to the matrix form of law of heat energy conservation:
 (7)
(7)
where,
 -element specific heat (thermal damping) matrix.
For the phase change problems, members of this matrix are defined from the enthalpy vs. temperature curve, according enthalpy model, and taking into account latent heat of phase change.
 , element mass transport conductivity matrix;
 , element diffusion conductivity matrix;
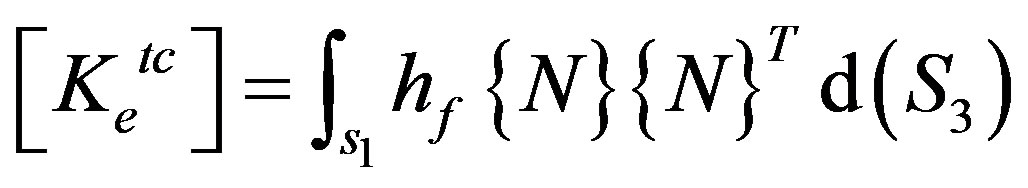 , element convection surface conductivity matrix; this matrix is diagonal, with the diagonal terms defined by the vector
 , element mass flux vector.
 , element convection surface heat flow vector;
 , element heat generation load.
3.2. Numerical Procedure
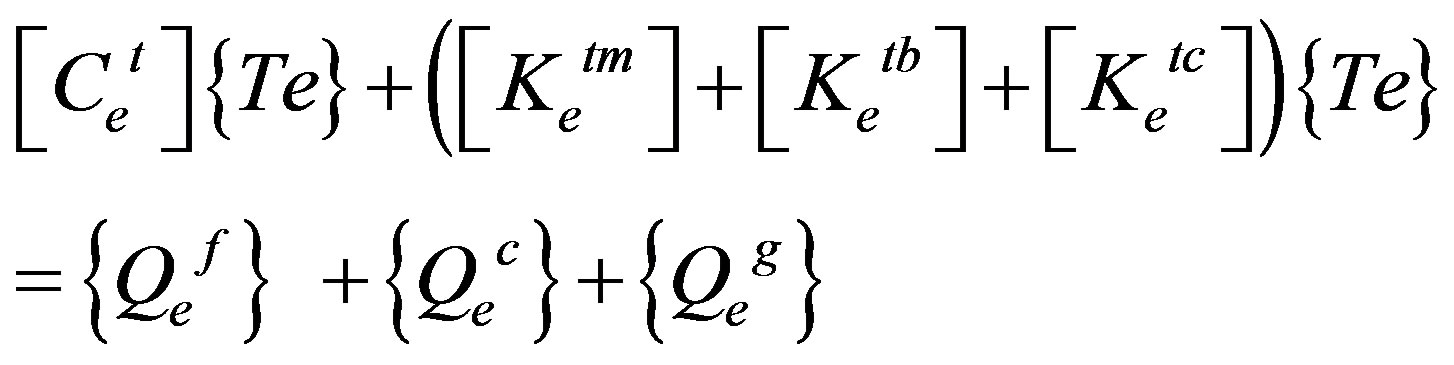
After defining conductivity matrices for each finite element as in Equation (7), one can obtain a set of linear equations defining behaviour of whole system of finite elements. This set has the following form:

where [C], specific heat matrix of the system; [K], conductivity matrix of the system; {T}, nodal temperature vector; {Qa}, external heat load.
While solving phase change problem, the above transient heat conduction equation is solved. The second and the term on to the right of the above equation is not affected by phase change. The phase change is accounted by  in the above equation. This system is solved using full Newton-Ralphson method and an Euler backward difference scheme is used for the transient time integration. In order to avoid numerical instability, the maximum time step size was controlled by the description of the loading input and the minimum time step size (or maximum element size) by defining its value based on the following relationship:
 .
.
3.3. MNSMS
The Δ value is the conducting length of an element (along the direction of heat flow) in the expected highest temperature gradient. The α value is the thermal diffusivity, given by k/ρC. The k value is the thermal conductivity, ρ is the mass density, and C is the specific heat. If the above relationship (ITS = Δ2/4α) is violated, unwanted numerical oscillations and values of calculated temperature outside of the physically possible range, may occur [27].
3.4. Cooling Curves during Solidification of Al-12%Si Alloy Cast against a Copper Chill
The cooling curves at T1, T2 & T3 locations inside casting during solidification of Al-12%Si alloy are as shown in the Figure 6. The solidification at T1 location has begun at a lower temperature compared to T2 & T3 locations due to the presence of copper chill. The difference in temperature between T1 and T3 locations is around 50˚C. This decrease is because of both chilling and convective heat transfer in the melt. The curve portion in the mushy region for T1 & T2 locations is steeper than the curve at T3 location. This signifies that the liquid-solid transformation takes place much earlier near the chill end than at locations away from it. The decrease in temperature throughout solidification at T3 location maintains temperature difference from T1 & T2 locations. Whereas

Figure 6. Cooling curves (temperature in ˚C verses time in seconds) obtained at thermocouple locations T1, T2 and T3 for Al-12%Si alloy cooling against a copper chill.
the curve at T1 seems to rise above T2 curve during cooling phase of solid-solid transformation. This is because of chill temperature which rises during solidification does not decline at the same rate.
The presence of chill has influenced the solidification behaviour as shown in Figures 6. The solidification curves at T1, T2 and T3 locations of Al-12%Si alloy cooling against copper chill showed a distinct behaviour because of super cooling at the melt/chill interface. This indicates the effect of chill/melt interfacial heat transfer that has affected the solidification behaviour. The onset of nucleation is at lower temperature near chill/melt (T1) interface compared to locations at T2 and T3. To reduce air gap resistance, the chill surfaces facing the composite melt are given very fine finish. Observably, the solidification in the mushy region at the chill/melt interface (T1) is eutectic type compared to the locations at T2 and T3. After three minutes, the cooling rate for all the three locations has been stabilized. The cooling curves thus shows that in the last phase of solidification heat transfer, the T1 curve has shown upward trend compared to T2 curve. During the last phase of solidification (solid-solid cooling), the melt at T1 location is affected by the cooling rate of the hot chill. Since cooling rate of the hot chill differs from other parts of the casting, the T1 curve shows higher temperature than T2 curve during last stages of solidification.
3.5. Temperature Profiles for Al-12%Si Alloy Cast against a Copper Chill
The predicted temperature profiles of Al-12%Si alloy solidifying against copper chill at 10 sec., 75 sec. and 180 sec. are shown in the Figures 7-9. It is found from the temperature profile that, heat transfer has taken place towards the chill end from the riser end with mushy region at 75 sec. and completion of solidification at 180 sec. The temperature profile of the solidifying alloy at different times and temperature at chill/metal interface and the riser end are generated by the program. Finally it is found that at the end of 75 seconds, maximum melt temperature at riser end was 405˚C and at chill end 361˚C.

Figure 7. Predicted temperature profiles of solidifying base alloy (Al-12%Si) under the influence of copper chill at the end of 10 second.

Figure 8. Predicted temperature profiles of solidifying base alloy (Al-12%Si) under the influence of copper chill at the end of 75 seconds.

Figure 9. Predicted temperature profiles of solidifying base alloy (Al-12%Si) under the influence of copper chill at the end of 180 seconds.
The results shown by the temperature profiles of the solidifying are also generated by the program. In general, the profile exhibit a temperature gradient that reduces towards the chill end. This indicates that the chill is establishing the directional solidification and heat transfer is taking place from riser end to chill end. Hence chills has influenced appreciably the temperature distribution along the length of the casting. In the first three minutes after pouring, the copper chilled Al-12%Si alloy has shown higher temperatures at 10 sec. and reduces after 75 sec. and 180 sec. Observation also indicated that the temperature profile results of FE analysis is qualitatively in line with the experimental cooling curves. It can be seen from the experimental cooling curves that the dip in the initial temperature for the Al alloy when chilled is observably more. This fact is further evidenced by the cooling curves obtained by the FE analysis. T his shows that chill material has affected the heat transfer and hence the temperature distributions in the solidifying melt. However, the overall cooling rates are controlled by heat transfer at chill end, heat transfer through sand, metallurgical condition of the melt and convective currents.
3.6. Cooling Curve from FE Analysis
The cooling curves obtained by FE simulation of the solidifying Al-12%Si alloy cast against copper end-chill. The cooling curve is obtained at three locations inside the solidifying melt such as chill/melt interface (T1), 20 mm from chill (T2) and 40 mm from chill (T3). These locations are considered along the centre line of the casting thickness (25 mm). It is observed that in the first three minutes, the copper chilled Al-12%Si alloy has solidified at relatively higher temperatures at T1, T2 & T3 locations.
The present FE analysis assumes only conductive heat transfer during solidification whereas convective heat transfer in the melt during and after pouring also exists. This is because modelling of solidification phenomena becomes very complex if convection heat transfer is also taken into account. Hence it is observed that there is a little mismatch which exist between the experimental and FE cooling curves due to modelling limitations. With these modelling limitations, the FEM cooling curves cannot be quantitatively compared with the experimental results.
4. Conclusions
The cooling curves obtained at chill/melt interface and at different locations of the solidifying melt indicate that the chills have a pronounced effect on the solidification. The solidification at chill/melt interface starts at lower temperatures compared to other locations along the length of the casting. This indicates that the chills have established steep temperature gradient along the length of casting and promote directional solidification.
A successful attempt has been made to model phase change and to know temperature distribution in composites during solidification using ANSYS-10 FE comercial software.
With the modelling limitations, the results give some insights into temperature distribution during Al-12%Si alloy solidification. Observing the temperature gradients obtained, conclusion can be drawn that the heat transfer has occurred from riser end to chill end promoting directional solidification. Within three minutes of solidification, the cooling curves obtained by FEM model shows similar trend as that of experimental curves. It can be seen from the experimental cooling curves that the dip in the initial temperature for the Al alloy when chilled is observably more. Finally, the FE cooling curves cannot be compared fully and quantitatively with experimental cooling curves because of modelling limitations.
REFERENCES
- J. Hemanth, “Fracture Behaviour of Cryogenically Solidified Al-Alloy Reinforced with Nano ZrO2MMCs,” International Journal of Microstructure and Materials Properties (IJMMP), Vol. 7, No. 4, 2012, pp. 68-77.
- J. Hemanth, “Microstructure, Mechanical Properties and Wear Behaviour of Metallic, Non-Metallic and Deep Cryogenically Chilled ASTM a216 WCB Steel,” Journal of Alloys and Compounds, Elsevier Science, Vol. 506, 2010, pp. 645-652.
- J. Hemanth, “Development and Wear Behaviour of Al/ Al2SiO5/C Chilled Hybrid Metal Matrix Composites by Both Experimental and Finite Element Method,” SAE International, Ohio, 2011.
- J. Hemanth, “Abrasive and Slurry Wear Behaviour of Chilled Aluminium Alloy (A356) Reinforced with Used Silica (SiO2p) MMCs,” Composites Part B, Elsevier Science, Vol. 42, No. 7, 2011, pp. 1826-1833.
- J. Hemanth, “Cryo Effect during Solidification on the Tribological Behaviour of Al-Alloy/GlassSiO2 MMCs,” Journal of Composite Materials, Vol. 43, No. 6, 2009, pp. 675-688.
- P. K. Rohatgi, et al., “Heat Transfer Characteristics of Mould Materials,” Journal of Materials Science, Vol. 29, No. 20, 1994, pp. 5357-5366. http://dx.doi.org/10.1007/BF01171548
- G. S. Hanumanth and G. A. Irons, “Solidification Behaviour of Aluminium Alloy Die Castings,” Metallurgical and Materials Transactions B, Vol. 27, No. 4, 1996, pp. 663-671. http://dx.doi.org/10.1007/BF02915665
- S. L. Soo, “Multiphase Fluid Dynamics,” Science Press, Beijing, 1990.
- G. S. Hanumanth, G. A. Irons and S. Lafreniere, “Effect of Chill Metal Interface during Solidification of Aluminium Alloys,” Metallurgical and Materials Transactions B, Vol. 23, No. 6, 1992, pp. 753-763. http://dx.doi.org/10.1007/BF02656454
- C. Beckermann and C. Y. Wang, “Annual Review of Heat Transfer,” In: C. L. Tien, Ed., Begell House, New York, 1995, pp. 98-115.
- A. Scott, “Cooling Curve Analysis of Chilled Aluminium 12% Si Alloys,” M.S. Thesis, Virginia Polytechnic Institute and State University, Blacksburg, 1996.
- K. N. Seetharamu and Sadhana, “Solidification Behaviour of Aluminiumalloy Composite by Die Casting Method,” Journal of Composites, Vol. 26, 2009, pp. 103-120.
- R. W. Lewis and R. S. Ransingh, “Solidification Analysis through Cooling Curves for Aluminium Alloy Reinforced with SiO2 Composites,” Metallurgical and Materials Transactions, Vol. 29B, 1988, pp. 435-444.
- K. S. Kannan, et al., “Effect of Heat Transfer on during Solidification of Steel Castings,” Indian Journal of Technology, Vol. 28, 1990, pp. 460-474.
- L. Bäckerud and B. Chalmers, “Effect of Convection Heat Transfer during Solidification of Aluminium Alloy Castings,” Transactions of the Metallurgical Society of AIME, Vol. 245, No. 2, 1969, pp. 309-318.
- L.-S. Chao and W.-C. Du, “Effect of Air Gap Formation in Chills Ruing Solidification of Copper Alloy Castings,” Proc. Natl. Sci. Counc. ROC (A), Vol. 23, No. 5, 1999, pp. 622-629.
- J. Tamminen, “Heat Transfer Analysis between Chill and Metal Interface,” Ph.D. Thesis, University of Stockholm, Stockholm, 2010.
- H. Morrogh and W. J. Williams, “Convective Heat Transfer Analysis during Solidification of Steel Alloys,” Journal of Iron and Steel Institute, Vol. 12, 1999, pp. 375- 378.
- A. Nathan, “Correction of Transient Solid-Embedded Thermocouple Data with Application to Inverse Heat Conduction,” Ph.D. Thesis, Mississippi State University, Mississippi, 2011.
- ANSYS Software Company, “Manual of ANSYS-10 Multi-Physics Tutorials on Phase Change Problems,” 2011.
- C. A. Long, “Essential Heat transfer,” Addition Wesley Longman Publications, Boston, 2001.
- R. Asthana, “Finite Element Analysis of Solidification Behaviour of Metals,” Journal of Materials Science, Vol. 15, No. 11, 1998, pp. 213-255.
- J. Hashim, L. Looney and M. S. J. Hashmi, “Finite Element Modelling of Heat Transfer Analysis during Solidification of Aluminium Alloy Castings,” Journal of Material Processing Technology, Vol. 123, No. 2, 2002, pp. 251-257. http://dx.doi.org/10.1016/S0924-0136(02)00098-5
- Z. Markovie and B. Rasuo, “Finite Element and Finite Difference Method of Analysing Hear Transfer during Solidification,” International Conference on Computational Mechanics (CM04), Belgrade, November 2004, pp. 26-34.
- T. Goel and M. Rowan, “Film Coefficient of Heat Transfer for Aluminium Alloy Chilled Castings,” Material Science Letters, Elsevier Science, Vol 25, 2010, pp. 81- 89.
- M. Hughes and K. L. Warren, “ANSYS Code for Euler’s Backward Integration Method for Solution to Heat Transfer during Solidification Problems,” Journal of Advanced Heat Transfer, Vol. 17, No. 2, 2011, pp. 34-47.
- S. Sawato, J. L. Guy and L. H. Philips, “Temperature Gradients during Solidification—A Numerical Approach,” Journal of AIME, Vol. 24, No. 9, 2010, pp. 56-67.