Natural Resources
Vol.08 No.09(2017), Article ID:78538,9 pages
10.4236/nr.2017.89037
Carbon Footprint of Recycling Service in Waste Treatment: Used Beverage Cans and Waste Papers
Yuki Sakamoto1*, Zenzo Ishii2, Shinichi Sato2, Eiichi Yoshida2
1Faculty of Informatics, Nara Gakuen University, Nara, Japan
2NIK Kankyo Inc., Okayama, Japan

Copyright © 2017 by authors and Scientific Research Publishing Inc.
This work is licensed under the Creative Commons Attribution International License (CC BY 4.0).
http://creativecommons.org/licenses/by/4.0/


Received: July 26, 2017; Accepted: August 15, 2017; Published: August 18, 2017
ABSTRACT
There are very few studies of the Carbon Footprint of Products (CFPs) in the service sector (e.g. transport and waste treatment) in comparison with those of industrial products and farm products. In this study, the CFPs of the recycling services of used beverage cans (aluminum and steel) and waste papers (cardboard, magazine and newspaper) in waste treatment were estimated as a first trial model of the service sector. Regarding the CFPs of whole life cycle of the recycling services, the amounts of CO2-equivalent (CO2e) greenhouse gas (GHG) emissions from the collection and transportation process were the largest in all recycling cases. The reason that the collection and transportation process emits the largest amounts of GHG emissions is that the collection vehicles (trucks) consume the large amounts of diesel fuel. Regarding the CFPs of the capital equipment, the amounts of GHG emissions from the capital equipment were the second largest in all recycling cases. It was found that the percentages of amounts of GHG emissions from the capital equipment in the recycling services were larger than those of industrial products and farm products.
Keywords:
Carbon Footprint, Life Cycle Assessment, Recycling Service, Waste Treatment, Capital Equipment

1. Introduction
The recent substantial rise in global atmospheric CO2 concentration and the ensuing greenhouse effect is considered to be caused mainly by consumption of large amount of fossil fuels due to increased human activities. On the other hand, in order to reduce greenhouse gases (GHGs) emissions, the “Carbon Footprint of Products scheme (CFP scheme)” had been promoted as one of the visualization measures of GHG emissions by the national pilot project (The Ministry of Economy, Trade and Industry (METI) and related ministries in Japan [1] . Furthermore, the Japan Environmental Management Association for Industry (JEMAI) has taken over the Japanese CFP scheme and has been officially started the operations of the “CFP Communication Program” [2] . However, there are very few studies of CFP in the service sector (e.g. transport and waste treatment) in comparison with those of industrial products and farm products [3] [4] , and there has been no study for the CFPs of recycling services.
In this study, the authors have been participating in the aforementioned schemes and developed and revised the Product Category Rule (PCR) for the waste treatment service [5] [6] , and the amounts of CO2-equivalent (CO2e) GHG emissions (i.e. as the labeling of CFP) from the recycling services (the recycling services of used beverage cans and waste papers) in waste treatment were estimated as a first trial model of the service sector on the above scheme. Furthermore, the amounts of GHG emissions from the capital equipment in the recycling services were estimated as one of Life Cycle Assessment (LCA) study, and the total amounts of GHG emissions of baled materials (aluminum, steel and papers) for aluminum cans, steel cans, cardboard, magazine and newspaper were estimated as the CFPs of the recycling services.
2. Recycling Service
2.1. Recycling Process
Figure 1 shows the process for the recycling services in this study. This process is divided into the three unit processes: 1) Collection and Transportation; 2) Sorting; and 3) Compressing and Baling.
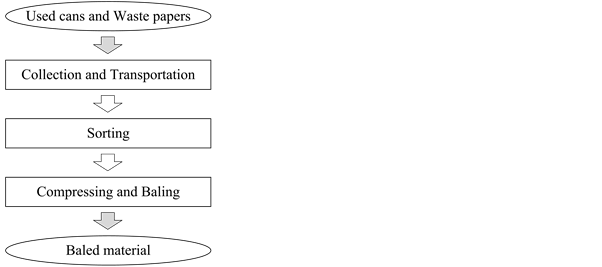
Figure 1. Process of recycling service.
1) Collection and Transportation
The used beverage cans (aluminum cans and steel cans) and the waste papers (cardboard, magazine and newspaper) in the stock yards of companies and municipalities are collected and transported to the recycling service company by the collection vehicles.
2) Sorting
The collected cans (the mixture of aluminum cans and steel cans) are sorted by the permanent magnet of sorting machine in the recycling service company.
Regarding the waste papers, the collected waste papers are without the sorting process because those have been already sorted before the transportation.
3) Compressing and Baling
The sorted cans and papers are compressed and baled (as baled materials) by each machine. Regarding the baling for papers, the papers are bailed by the steel wire.
2.2. Major Equipment (Capital Equipment)
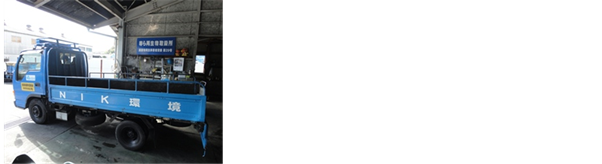
Figure 2 shows the major equipment (capital equipment) for this recycling service.
1) Collection and Transportation
• Collection vehicle: Figure 2(a)
Truck type: Cargo truck (Flat body truck and Garbage truck)
Maximum loading capacity: 2 ton

 (a) (b)
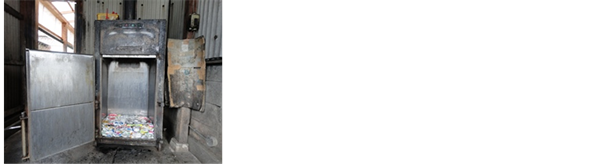
 (c) (d)
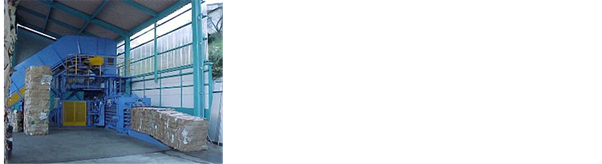
Figure 2. Major equipment for recycling service. (a) Cargo truck; (b) Sorting machine for cans; (c) Compressing machine for cans; (d) Compressing and baling machine for papers.
Fuel type: Diesel.
2) Sorting for aluminum cans and steel cans
• Sorting machine: Figure 2(b)
Sorting method: Permanent magnet
Carrying system: Belt conveyor system (by electric motor drive)
Motor power: total 2.7 kW.
3) Compressing and Baling
• Compressing machine for aluminum cans and steel cans: Figure 2(c)
Compression method: Oil hydraulic press (by electric motor drive)
Motor power: 2.2 kW
• Compressing and baling machine for cardboard, magazine and newspaper: Figure 2(d)
Compression method: Oil hydraulic press (by electric motor drive)
Motor power: total 41 kW.
2.3. Baled Material
Table 1 and Figure 3 show the baled size and weight of baled materials.
3. Methodology
3.1. System Boundary
The system boundary for the recycling services includes the three unit processes: 1) collection and transportation, 2) sorting, and 3) compressing and baling), as shown in Figure 1. On the basic rules of “General Principles” and “Basic instructions” of CFP [7] [8] , the process 1), 2) and 3) correspond to (a) Raw material acquisition stage as 1) and (b) Production stage as 2) and 3), respectively,
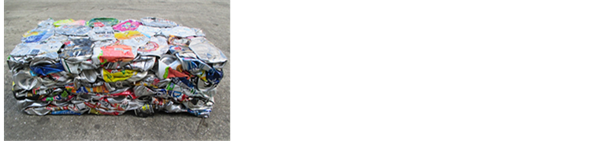
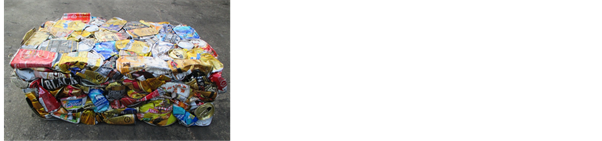 (a)(b)
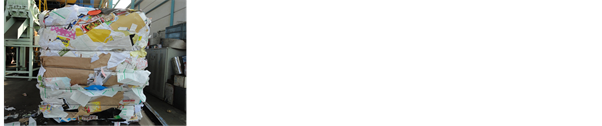
 (c)(d)(e)
Figure 3. Baled material for recycling service. (a) Aluminum; (b) Steel; (c) Cardboard; (d) Magazine; (e) Newspaper.

Table 1. Baled size and weight of baled material.
and the baling process in this study is the end of system boundary in whole life cycle of the product system on the aforementioned basic rules [7] [8] .
3.2. Calculation Method
The calculation method in this study was based on the rules of “Requirements for CFP-PCR” [9] , “Requirements for CFP quantification and declaration” [10] and the aforementioned principles and instructions of CFP [7] [8] . The amounts of GHG emissions were calculated in each process as referred to in Figure 1 and summed up according to the equation given below:

where i stands for a process.
“Activity”, that is to be multiplied by GHG emission factor, e.g. the amounts of material consumption (unit: kg or ton), electricity consumption (unit: kWh) and fuel consumption (unit: kg or liter) for production and transportation processes, etc. Each GHG emission factor was based on rules and requirements of the CFP Communication Program [11] [12] [13] and quoted from “Basic secondary data” of the CFP Communication Program [14] , e.g. GHG emission factor to produce material per kilogram (unit: kg-GHG/kg-material), GHG emission factor to generate electricity per kilowatt hour (kWh) (unit: GHG/ kWh) and GHG emission factor to burn fuel per liter (unit: kg-GHG/liter-fuel in this study).
In this study, the each GHG emission per kilogram-baled material (unit: g- CO2e/kg-baled material) was calculated as the functional unit in each process, and the data collecting time of the inputs in each process is one year.
Regarding the estimation of the amounts of GHG emissions from the capital equipment (e.g. collection vehicles, sorting machine, compressing machine and baling machine), the calculation method was based on the scenario of aforementioned PCR [6] , the basic rules and the requirements of CFP [7] [8] [9] [10] , in addition, the calculation process was divided into two categories (1: Raw materials of capital equipment, and 2: Manufacture (processing and assembling) of capital equipment), and the amount of GHG emission per one year (i.e. the data collecting time) from each capital equipment was calculated by dividing the used years of each capital equipment.
Regarding the allocation of the amount of GHG emission from the capital equipment, the amounts of fuel consumptions of collection vehicles, electricity consumptions of sorting machine and compressing and baling machine were allocated by the weight of each baled material.
4. Results and Discussion
4.1. CFP of Recycling Process
Table 2 shows the CFP of each recycling process. In all recycling cases, the amounts of GHG emissions (as g-CO2e emission per 1 kg of the baled material) from the collection and transportation process were the largest and accounted for approximately 89% - 94% of the total amounts of GHG emissions, and those of the compressing and baling process and the sorting process followed and accounted for approximately 3% - 11% and 3% (excluding the amounts of GHG emissions for papers) of the total amounts of GHG emissions, respectively. The reason that the collection and transportation process emits the largest amounts of GHG emissions is that the collection vehicles (trucks) consume the large amounts of diesel fuel and expendable supplies (e.g. tires, engine oil, repair parts and miscellaneous expendable parts). The amounts of GHG emissions from the collection and transportation process and expendable supplies accounted for approximately 68% - 90% and 10% - 32% of the amounts of GHG emissions from the collection and transportation process, respectively.
Regarding the difference of the amounts of GHG emissions of cans and papers in the collection and transportation process, the amounts of GHG emissions of the baled cans are approximately 1.5 - 2.1 times as large as in comparison with those of papers. This is due to the difference of transport efficiency of cans and papers (i.e., the papers usually have been already sorted and packed, and the bulk densities of papers are higher than those of cans).
4.2. CFP of Capital Equipment
Table 3 shows the CFP of capital equipment of each recycling process. In all recycling cases, the amounts of GHG emissions from the collection vehicles in the collection and transportation process were the largest and accounted for approximately 78% - 89% of the total amounts of GHG emissions, and those of the
Table 2. CFP of recycling process.
Table 3. CFP of capital equipment.
sorting process and the compressing and baling process accounted for approximately 13% - 15% (excluding the amounts of GHG emissions of papers) and 7% - 17% of the total amounts of GHG emissions, respectively.
Regarding the amounts of GHG emissions from the trucks as the collection vehicles in the capital equipment were largest, this is because the trucks require various raw materials, parts and manufacturing processes in comparison with those of the sorting machine and compressing and baling machines, and the amounts of GHG emissions from the manufacturing processes are larger than those of raw materials of the total amounts of GHG emissions from the collection vehicles and accounted for approximately 55% of the total amounts of GHG emissions from the collection vehicles.
4.3. CFP of Whole LIFE Cycle of Recycling Service
Table 4 shows the CFP of whole life cycle of each recycling service as one of LCA study. In all recycling cases, the amounts of GHG emissions from the collection and transportation process were the largest and accounted for approximately 75% - 81% of the total amounts of GHG emissions, and those of the capital equipment and the sorting, compressing and baling processes followed and accounted for approximately 13% - 18% and 5% - 9% of the total amounts of GHG emissions, respectively.
Regarding the amounts of GHG emissions from the capital equipment, the amounts of those GHG emissions have not been taken into account as the subject of calculation for industrial products and farm products because the amounts of those GHG emissions for various industrial products do not have a significant impact on a result of the total amounts of GHG emissions in general (i.e. the CFPs of capital equipment of industrial products and farm products are almost negligibly small.). However, it was found that the amounts of those GHG emissions in the recycling services had a large impact on a result of the total amounts of GHG emissions in this calculation.
5. Conclusions
In this study, the CFPs of the recycling services of the used beverage cans and papers in waste treatment were estimated as a first trial model of the service sec-
Table 4. CFP of whole life cycle of service.
tor. Furthermore, the CFPs of the capital equipment in the recycling services were estimated as one of LCA study, and the total CFPs of baled metals (aluminum and steel) for aluminum cans and steel cans and baled papers (cardboard, magazine and newspaper) were estimated as the CFPs of the recycling services throughout whole life cycle. The following conclusions were obtained from the results in this study:
Regarding the CFPs of whole life cycle of the recycling services, the amounts of GHG emissions from the collection and transportation process were the largest and accounted for approximately 75% - 81% (32.7 - 69.2 g-CO2e/kg-baled material) of the total amounts of GHG emissions (42.9 - 85.0 g-CO2e/kg-baled material) in all recycling cases. Therefore, this estimation indicates that the improvements of the transportation efficiency (e.g. optimization of collection route and compressing of cans in the stock yards before the collection and transportation process) and the fuel efficiency are essential to reduce the amounts of GHG emissions in the collection and transportation process.
Regarding the CFPs of the capital equipment as one of LCA study, the amounts of GHG emissions from the capital equipment accounted for approximately 13% - 18% (6.2 - 11.2 g-CO2e/kg-baled material) of the total amounts of GHG emissions in all recycling cases. It was found that the percentages of amounts of GHG emissions from the capital equipment in the recycling services were larger than those of industrial products and farm products.
Acknowledgements
This work was supported and sponsored by the Japanese national government (METI) and the relevant organizations. The authors are deeply grateful to METI and the relevant organizations for the contributions.
Cite this paper
Sakamoto, Y., Ishii, Z., Sato, S. and Yoshida, E. (2017) Carbon Footprint of Recycling Service in Waste Treatment: Used Beverage Cans and Waste Papers. Natural Resources, 8, 583- 591. https://doi.org/10.4236/nr.2017.89037
References
- 1. The Ministry of Economy, Trade and Industry (METI) (2010) Carbon Footprint of Products in Japan.
http://www.meti.go.jp/english/policy/energy_environment/cfp/pdf/cfp_products.pdf - 2. The Japan Environmental Management Association for Industry (JEMAI) (2011) Overview of the CFP Communication Program.
https://www.cfp-japan.jp/english/overview/index.html - 3. The Japan Environmental Management Association for Industry (JEMAI) (2011) List of the Approved CFP Products.
https://www.cfp-japan.jp/english/list/index.html - 4. The Japan Environmental Management Association for Industry (JEMAI) (2014) List of the Approved CFP Products. (In Japanese)
http://www.cfp-japan.jp/calculate/verify/permission.php - 5. The Japan Environmental Management Association for Industry (JEMAI) (2013) Carbon Footprint of Products-Product Category Rule of “Recycling Service in Waste Treatment 1st Edition”. (In Japanese)
https://www.cfp-japan.jp/common/pdf_authorize/000173/PA-DM-01.pdf - 6. The Japan Environmental Management Association for Industry (JEMAI) (2014) Carbon Footprint of Products—Product Category Rule of “Recycling Service in Waste Treatment 2nd Edition”. (In Japanese)
https://www.cfp-japan.jp/common/pdf_authorize/000179/PA-DM-02.pdf - 7. The Ministry of Economy, Trade and Industry (METI) (2009) General Principles for the Assessment and Labeling of Carbon Footprint of Products (Japanese Technical Specification: TS Q 0010: Abolished at Present).
- 8. The Japan Environmental Management Association for Industry (JEMAI) (2012) CFP Communication Program “Basic instructions”.
https://www.cfp-japan.jp/english/rules/pdf/G-01-02.pdf - 9. The Japan Environmental Management Association for Industry (JEMAI) (2012) CFP Communication Program “Requirements for CFP-PCR”.
https://www.cfp-japan.jp/english/rules/pdf/C-06-01.pdf - 10. The Japan Environmental Management Association for Industry (JEMAI) (2012) CFP Communication Program “Requirements for CFP Quantification and Declaration”.
https://www.cfp-japan.jp/english/rules/pdf/C-09-03.pdf - 11. The Japan Environmental Management Association for Industry (JEMAI) (2012) CFP Communication Program “Rules on Verification and Operation of Emission Factor Data”.
https://www.cfp-japan.jp/english/rules/pdf/R-05-01.pdf - 12. The Japan Environmental Management Association for Industry (JEMAI) (2012) CFP Communication Program “Requirements for Basic Secondary Data”.
https://www.cfp-japan.jp/english/rules/pdf/C-01-01.pdf - 13. The Japan Environmental Management Association for Industry (JEMAI) (2012) CFP Communication Program “Requirements for the Available Secondary Data”.
https://www.cfp-japan.jp/english/rules/pdf/C-02-01.pdf - 14. The Japan Environmental Management Association for Industry (JEMAI) (2012) CFP Communication Program “Basic Secondary Data”. (In Japanese)
https://www.cfp-japan.jp/calculate/verify/data.html