Journal of Encapsulation and Adsorption Sciences
Vol.3 No.4(2013), Article ID:40543,9 pages DOI:10.4236/jeas.2013.34012
Caboxymetylcellulose/Gelatin Blends Loaded with Piroxicam: Preparation, Characterization and Evaluation of in Vitro Release Profile
Campus of Joinville, Joinville-Brazil Campus Universitário, University of Region of Joinville—UNIVILLE, Joinville, Brazil
Email: *stlvi@yahoo.com.br
Copyright © 2013 Vivia Buzzi et al. This is an open access article distributed under the Creative Commons Attribution License, which permits unrestricted use, distribution, and reproduction in any medium, provided the original work is properly cited.
Received September 19, 2013; revised October 19, 2013; accepted October 26, 2013
Keywords: Piroxicam; gelatin; carboxymethyl cellulose
ABSTRACT
Piroxicam is a non-steroidal anti-inflammatory drug (NSAID) exhibiting analgesic and antipiretic properties and widely used in the management of chronic diseases. Associated with these use, there are registers of adverse reactions. Microparticle formulations in hydrogel matrix can be used to form a semi-permeable barrier which enables their actions and can reduce the effects. This work presents a study on the effect of gelatin/carboxymethyl cellulose (Gel/CMC) semi-IPN matrix composition on the retention and kinetic behavior of releasing this drug. The microparticles were obtained through the emulsion-crosslinking method using 23 factorial planning and the piroxicam was added as solid particles. In order to characterize the interaction between matrix-active agent and quantification of the drug, the following techniques were applied: SEM, DSC and XRD. SEM micrographs revealed microparticles with regular and spherical shape and that in some compositions the drug is partially absorbed and not encapsulated. Beyond that DSC and XRD analyses indicate that the piroxicam remained in the matrixes, maintains the same crystalline form. The factorial planning analysis indicated that matrix obtained a maximum encapsulation efficiency (EE%) of 10.64% and became possible to create a response surface graph using a EE% as answer. In addition to this, release kinetics analyses demonstrated that the release process seems to be governed by distinctly kinetic models, considering the composition of the sample. In some samples the release can be driven by Fickinianan diffusion, others by anomalous transport or swelling.
1. Introduction
Microencapsulation is a widely applied process in the pharmaceutical field with various objectives, which include: development of means of controlled release, attainment of gastro-resistant microparticles, development of means of intrapulmonary and intra-articular release, reduction in gastrointestinal toxicity, increased dissolution and the bioavailability of drugs, among others [1,2]. One very interesting drug in relation to reducing the toxicity is piroxicam, a drug commonly used to relieve the symptoms of rheumatoid arthritis, osteoarthritis, postoperative pain and which also acts as an analgesic, especially when there is an inflammatory component. However, this drug causes gastro-intestinal irritations as shown by the numerous complaints from users of this drug, mainly when performing long term treatment during which gastritis occurs, often developing into an ulcer or something even more serious [3]. Thus, encapsulating drugs such as piroxicam is a simple strategy that can reduce these problems. Some polymers present these characteristics, for example, bioabsorbent polyesters and some polysaccharides in the form of hydrogels [4]. One of the ways of obtaining hydrogel microspheres with such characteristics is through semi-IPN systems (semiinterpenetrating polymer network) or IPN. The first system is characterized by a combination of a polymer in cross-linked form and the second in linear form. The IPN hydrogels are formed by a combination of two different polymers and both are cross-linked. The interest in hydrogels is due to their characteristics such as biocompatibility and non-toxicity, making them potential candidates for application in the medical and pharmaceutical fields, mainly in the preparation of orally administered pharmaceuticals. Gelatin, sodium alginate and some cellulose hydrosoluble derivatives can be used as bioabsorbablematrixes for releasing drugs into these systems [5- 11]. Also, this drug can be taken by other routes, such as intra-articular administration, where a biodegradable microparticulate system is advantageous. The incorporation of piroxicam in microspheres offers a means not only to control the drug release by oral route, but also by parenteral route. Proposals for encapsulating piroxicam were found in recent literature, [12-14], which expressed the importance of seeking alternatives for maintaining this drug in use and the differential nature of this study to propose the application of hydrogels. In order to study the release of a drug from the matrix it is necessary to identify the type of mechanism that governs this process and among the most important are diffusion, swelling and erosion [15]. In the case of hydrogel systems, the release models are classified as: controlled by diffusion, swelling or chemically controlled. The first is widely applied and describes the release of the drug based on Fick’s Laws; the second is assumed when diffusion is faster than swelling and in this model it is necessary to involve moving boundary conditions since the swelling is associated with an increase in particle size. The classification chemically controlled release is given to cases in which release occurs due to reactions inside the matrix. Mathematical models are used as a tool for both classifying as well as providing a deeper understanding of the release of drugs, which according to [16] can be classified as mechanistic realistic or empirical/semi-empirical theories. The last one is easy to apply and, as a mathematical analysis, can be used to compare different release profiles. However, for its application it is extremely important to delimit the conditions under which the release process occurs. In this sense, the aim of this work was to study the effect of the gelatin/carboxymethyl cellulose (Gel/CMC) as semi-IPN matrix composition on encapsulation and on the kinetic behavior of releasing the piroxicam drug.
2. Methods
2.1. Preparation of Gelatin/CMC Microparticles
The semi-IPN microparticle system was obtained through the emulsion-crosslinking method based on the technique proposed by [17], adapted by [18] and shown in Figure 1. A solution was prepared consisting of 4% (m/v) gelatin for 10 mL solution. Following which, CMC (Deg, São Paulo, Brazil) was added to the gelatin solution (Vetec química fina Ltda). The mixture was agitated (Ikamag Ret), at a rate of 300 rpm, at 40˚C, for 30 min, for complete gelatin and CMC dissolution and the piroxicam

Figure 1. Scheme for obtaining Gel/CMC microparticles through emulsion-crosslinking method.
(Deg Imp. de Produtos Químicos) was added. This solution was then slowly poured over a mixture of 60/40 (m/m) petroleum paraffin/ether (Vetec química fina Ltda /Maia indústria e Comércio Ltda) containing 0.5% (m/m) Span 80 (Sigma Aldrich), agitated for 10 min at a rate of 1000 rpm. Glutaraldehyde (25% in water (PA), Casa da química indústria, comércio Ltda) was slowly added to this emulsion, with agitation rate maintained for more than 35 min. The mixture was carefully poured into a Bü- chner filter, and the microparticles carefully washed with 300 mL n-hexane, 300 mL commercial ethyl alcohol and 200 mL deionized water, subsequently. With the help of a spatula, the particles were transferred to Falcon tubes and refrigerated for 8 hours. Following this, the chilled material was transferred to a lyophilizer flask and frozen for at least 5 hours. It was lyophilized for 2 hours and 30 minutes.
2.2. Experimental Planning for Gelatin/CMC Microparticles
Tables 1 and 2 presents changes in the levels of CMC, glutaraldehyde (crosslinking agent) and piroxicam according to 23 factorial designed for this system.
It was produced a sample with absence of piroxicam containing only the Gel/CMC matrix called GB.
2.3. Determination of Encapsulation Efficiency (EE%) of Active Agent in Matrix
100 mg of samples were weighed and maintained in acetone (P.A) for 24 hours. Following this, an aliquot of supernatant was collected and transferred to eppendorf tubes and frozen for 24 hours. Then 0.1 mL was removed from this aliquot and 0.9 mL acetone was added. The samples were submitted to high performance liquid chromatography (HPLC) analysis (Merck Hitachi model:

Table 1. Indication of variables and upper and lower levels used in factorial design.

Table 2. 23 factorial planning for the preparation of microparticles in Gel/CMC matrix. The indices (-) and (+) indicate the level of each variable as lower and higher, respectively.
D-7000 IF, with column: Merck Lichrosfer RP-18) where the EE% was determined through equation (1):
 (1)
(1)
Theoretical drug loading The analyses were performed in triplicate with the average concentrations being considered.
2.4. Statistical Analyses
All data obtained were analyzed through the statistical test for rejecting deviating values (Dixon Q Test), being accepted or not, with a confidence level of 95% [19]. The Pareto analysis was used for factorial planning which enables identification and quantification of the effect of each one of the factors (CMC percentage, cross-linking agent and piroxicam) and their interactions in experiments carried out, with the EE% parameter being evaluated as response.
2.5. Morphology and Surface of Microparticles
Evaluation of the morphology and the characteristics of the microparticle surfaces were performed using a scanning electron microscope (SEM) (Philips XL30). Samples of each formulation were fixed to metal supports, covered with a fine layer of gold and studied under an electron microscope using a tension of 10.0 kV.
2.6. Matrix-Drug Interaction and Physical State of Active Agent
The matrix-drug interaction and the presence of the active agent in the microparticles were investigated through the following analyses:
1) Differential scanning calorimetry (DSC): the curves were obtained with 2 to 5 mg samples in DSC (TA-Instrument, DSC 2920) in N2 atmosphere equipped with a LNCA type cooling system (cooled with liquid nitrogen). Only one heating was performed from room temperature to 250˚C at the heating rate of 10˚C/min because in the second heating the samples were amorphous, in other words, they showed no melting point.
2) X-ray Diffraction (XRD): the physical state of piroxicam in microparticles was evaluated using the XRD diffractometer (x-Pert, Philips) with CuKα radiation (I = 1.54056Å). The scanning was done between 2˚ of 5˚ to 50˚.
2.7. In Vitro Drug Release Profile
Microparticles containing the equivalent of 15 mg drug were placed in sealed flasks and then 30 mL of phosphate buffer pH 7.4 (condition sink) was added and kept immersed in a bath (GFL, D 3006), at (37 ± 2)˚C. At pre-determined intervals, 5 mL aliquots were removed and after reading, returned to the medium when possible. For some samples, a new buffer solution aliquot was restored to the medium to maintain a constant volume in the test tubes. The piroxicam concentration in the medium was determined through absorption spectrophotometry in the UV region at λmax = 353 nm, using a spectrophotometer (SHIMADZU, 1601 PC). Based on the calculation curve (concentration range of 1.0 to 20.0 mg/L of drug), the quantity of piroxicam released into the medium according to time was calculated.
The results of the release assay carried out a study of the mechanisms involved in the release process. For this, different models were applied.
3. Results and Discussions
Table 3 presents the mean EE% and the standard deviation (DP%) for the Gel/CMC formulation samples, considering factorial planning.
Maximum EE% was recorded for sample G8, at a value of approximately 11%, which was achieved under higher levels of CMC and piroxicam in the internal and glutaraldehyde phase in emulsion. It was verified that the EE% recorded for samples G1 to G6 varied between 1.2 and 4.8%.
Figure 2 shows the Pareto graph presenting 3 variables and 4 interactions. It was observed that, in addition to the CMC and glutaraldehyde effects, it was possible to identify a significant influence on the combination of CMC/glutaraldehyde ((1) * (2)) and CMC/glutaraldehyde /piroxicam factors ((1) * (2) * (3)) at the highest levels, confirming observations in Table 3.

Table 3. Encapsulation efficiency (EE%) and standard deviation for Gel/CMC formulations.

Figure 2. Pareto graph for the Gel/CMC microparticles.
The response surface graph (Figure 3) shows the influence of glutaraldehyde and CMC on the EE%. It was observed that the EE% reached a value of around 10% when CMC and glutaraldehyde contents go from a lower level (10 and 5%, respectively) to a higher level (20 and 10% respectively), corresponding to samples G7 and G8.
table 4 shows the ANOVA for the graph and response surface.
The difficulty in encapsulating this drug has been recorded in literature. Prepared microparticles of cellulose acetate butyrate and poly (3-hydroxibutyrate) (PHB) containing piroxicam, in which all formulations studied had around 50% of the total amount of the non encapsulated drug added with the drug content in the microparticles being practically the same, around 15 mg. Prepared piroxicam microparticles using PHB as matrix, and confirmed that the EE% varied from 5.5 to 89.8% [20]. The best encapsulation indices were recorded by preparing polycarbonate microparticles which, under the conditions described in the method, attained an EE% of 95% for the piroxicam. It is worth noting the importance in optimizing the conditions of the microencapsulation process to achieve high EE% values and that this work proposed

Figure 3. Response surface for the Gel/CMC particles.

Table 4. Results of the influence of the factors on EE%, ANOVA analysis.
a differentiated system for retaining the drug and these results refer to the exploratory study.
In virtue of this, as a way of evaluating the effects of matrix composition and piroxicam content, in morphological, thermal and crystallinity characteristics, 4 of the factorials were selected so as to analyze the effect of each factor individually. The samples with the highest EE% were selected. Based on this criterion the samples G4, G5, G7 and G8 were defined and characterizations followed.
3.1. Gel/CMC Microparticle Characterization
Figure 4 shows the piroxicam (PP) micrographs, the microparticles obtained for the control (GB) and for the formulations G4, G5, G7, G8, in Gel/CMC, respectively.
The microparticles coming from the gelatin based formulations showed regular, spherical shapes with a rough surface, according to that shown in Figure 4. Encapsulating ketorolac tromethamine in Gel/CMC matrix, observed that the particles presented a slightly rough surface and particle mean size ranged from 247 to 535 µm. The presence of piroxicam crystals was observed on the microparticle surface, mainly in samples G4, G5 and

Figure 4. Electron scanning microscopy micrographs of Gel/CMC microparticles obtained from formulation P (pi- roxicam), GB (control), G4, G5, G7and G8.
G7, shown by the arrows in Figure 4, indicating that the drug is partially absorbed and not encapsulated. In sample G8 there is no evidence of crystals in the microparticle surface, suggesting a better encapsulation [21]. The presence of non encapsulated piroxicam near the surface was recorded.
3.2. Differential Scanning Calorimetry (DSC) and X-Ray Diffraction (XRD) Analyses
The Gel/CMC microparticle DSC curves are shown in Figure 5, for the selected factorial compositions, the matrix (GB) and the standard piroxicam (PP).
The DSC curve analysis together with the data in Table 3 suggests that the drug was encapsulated. The samples G5 and G7 present an endothermic peak of around 198˚C, characteristic of the piroxicam melting process, which according to literature varies from 198 to 200˚C [22]. The sample G8 presented a melting temperature (Tm) of 194˚C which is being attributed to the presence of piroxicam in the matrix. Encapsulating the piroxicam in PHB/ chitosan matrix, observed one endothermic event only corresponding to the melting process, shifting to a lower temperature in relation to the Tm of pure components. The absence of a drug melting peak temperature of 204˚C could be an indication that the piroxicam was molecularly dispersed in the polymer matrix, amorphously. Figure 6 shows the diffractograms for the Gel/CMC microparticles.
As can be observed, the standard piroxicam (PP) pre-

Figure 5. DSC curves for Gel/CMC microparticles.

Figure 6. Gel /CMC microparticle diffractograms obtained from formulation G4, G5, G7, G8, GB control (without drug) and PP (standard piroxicam).
sented diffraction peaks of 2q equal to 8˚; 14˚; 17.5˚ and 27.5˚, being similar to the polymorphic I form described by Vrečer, which gives a detailed study of the polymorphic structures of piroxicam [23]. The control sample (GB) showed an amorphous halo of 2q equal to 21˚. It was observed that samples G5, G7 and G8 are similar and present the same amorphous halo at 21˚, as well as the diffraction peak at 8˚, referring to piroxicam. The sample G4 amorphous halo was less evident than the previous samples and the peak 2q equal to 8˚. The intensity of this peak was lower for samples G4 and G5 in relation to G7 and G8, indicating immobilization of a lower quantity of piroxicam. Sample G8 presents both the halo at 21˚ as well as the peaks at 2q equal to 8; 12; 14; 17.5 and 27.5˚, indicating that this sample has higher piroxicam content in relation to the others, which is consistent with the EE% results. The presence of the drug in the matrixes, maintaining the same crystalline form can be justified considering the method of obtaining the Gel/ CMC particles, as in this case the piroxicam is added in solid form together with the polymer solution, in the first phase of the process.
3.3. In Vitro Drug Release Profile
Initially the model proposed by Reis [24], was applied due to the system being based on hydrogel polymers. In this model it is assumed that the release process is a means of transport governed by diffusion as well as a phenomenon of the partitioning of the solute between the solvent phase and the hydrogel matrix. Thus, on determining the maximum fraction (Fmax) of solute released it is possible to apply first and second order kinetic models and evaluate the release profile of the solute in question. Based on the concept discussed by those authors, the fraction of released piroxicam (FR) during assay time was determined in this study and the maximum fraction was obtained graphically (Figure 7) according to the procedure indicated for sample G7.
It was observed that the four samples released 100% of the drug in a 120 min period. In the first 30 min the G4, G7 and G8 compositions showed similar behavior including similar FR x t curves, the same cannot be said about the curve shown in sample G5, which suggests that release occurred in well defined stages, one in the first 10 min, another between 10 and 45 min, and a third between 45 and 60 min. The first minutes can be attributed to the release of piroxicam located on the sur face followed by the process of releasing the drug contained within the microparticles.

Figure 7. Released piroxicam fraction according to assay time for samples G4, G5, G7 and G8.
Based on the data obtained in Figure 7 and assuming that the release process can be treated as a partition phenomenon the equation was applied that assumes first order kinetics in the following terms described in equation (2):
 (2)
(2)
Figure 8 shows the application of this equation on the piroxicam release data from the four samples G8, G7, G5 and G4 and the R2 values obtained.
In a similar way the second order kinetic model was applied for the release data according to equation (3):
 (3)
(3)
where a is considered the partition parameter estimated by the ratio described in equation (4):
 (4)
(4)
Figure 9 presents the results obtained by applying this model.
In table 5 are the rate constants and the release of values R2 for kinetic models.
On analyzing the results, it was verified that the samples behaved distinctly under the kinetic models used. The set of data recorded for the G8 system in the first 30 min, appears to be governed by first order kinetics (R2 = 0.996), in other words, depending on the piroxicam concentration. While for sample G4, the kinetics was apparently second order (R2 = 0.990), depending on the concentration of the drug. In both cases it can be said that, in the time intervals analyzed, the piroxicam release can be approached by Fickinian diffusion.
Sample G5, in the interval between 0 and 40 min presented two distinct release events: the first up to 10 min,

Figure 8. Experimental data for time-dependent release of piroxicam from samples G4, G5, G7 and G8 at 25˚C, plotted according first-order kinetics equation.

Figure 9. Experimental data for time-dependent release of piroxicam from samples G4, G5, G7 and G8 at 25˚C, plotted according second-order kinetics equation.

Table 5. Constant of the release rate (kR) and R2 values obtained from linear regression evaluations of first (Equation (2)) and second-order (Equation (3)) kinetics models.
which corresponds to the release of 60% of immobilized piroxicam and a second, slower event which suggests the relationship between the diffusion of water into the particle and release of the drug from the swollen material. This fast release is in accordance with the micrographic analysis, in which it is possible to observe a quantity of piroxicam crystals on the surface of this sample enhancing, therefore, solution diffusion. By considering the first event as a material release from the particle surface, it is understood that piroxicam partition occurs between this surface and the solution. However, the low R2 values do not confirm this process as a simple diffusion process. The second event presented R2 values of around 0.97 under the two models applied, thus not enabling confirmation that release is governed by diffusion. The same observation serves for sample G7, in the time interval covered. In virtue of this analysis, the semi-empirical Power Law model developed by Peppas was applied and which suggests under specific conditions, among other aspects, the release mechanism. This mathematical model is based on equation (5):
 (5)
(5)
In which MR is the quantity of substance released in time t, M∞ the total quantity released during the time interval studied, k is a constant incorporating structural and geometric characteristics of the particles and n is the exponential factor related to the release mechanism of drug release.
In the pharmaceutical field, this model is known as Korsmeyer-Peppas (1983), and is generally used to release a drug from the polymer matrix when this is not well known or when one or more types of phenomena are involved [25]. Table 6 lists the n values for different polymer matrix geometric forms and different mechanisms.
Considering that the total concentration of piroxicam in the microparticles is lower than its solubility in the buffered medium, and using the assumption that particles are spherical, Power Law model can be applied.
Based on these considerations, the value of n was graphically estimated for the ratio envisaged in the model equation. In the case of sample G7, the best correlation index was recorded when n = 0.67 (Figure 10) which indicates the mechanism denominated anomalous transport, that is, there is an overlapping of different phenomena during release, such as drug diffusion and polymer swelling. This analysis agrees with the SEM and XRD analyses for the sample.
Similar treatment was applied to sample G5 in what is called the second stage of release and is shown in Figure 11. The best determination coefficient found was R2 = 0.973 for n = 0.85. This n value suggests that the piroxicam release mechanism in the time interval between 20 and 40 min occurred due to matrix swelling.
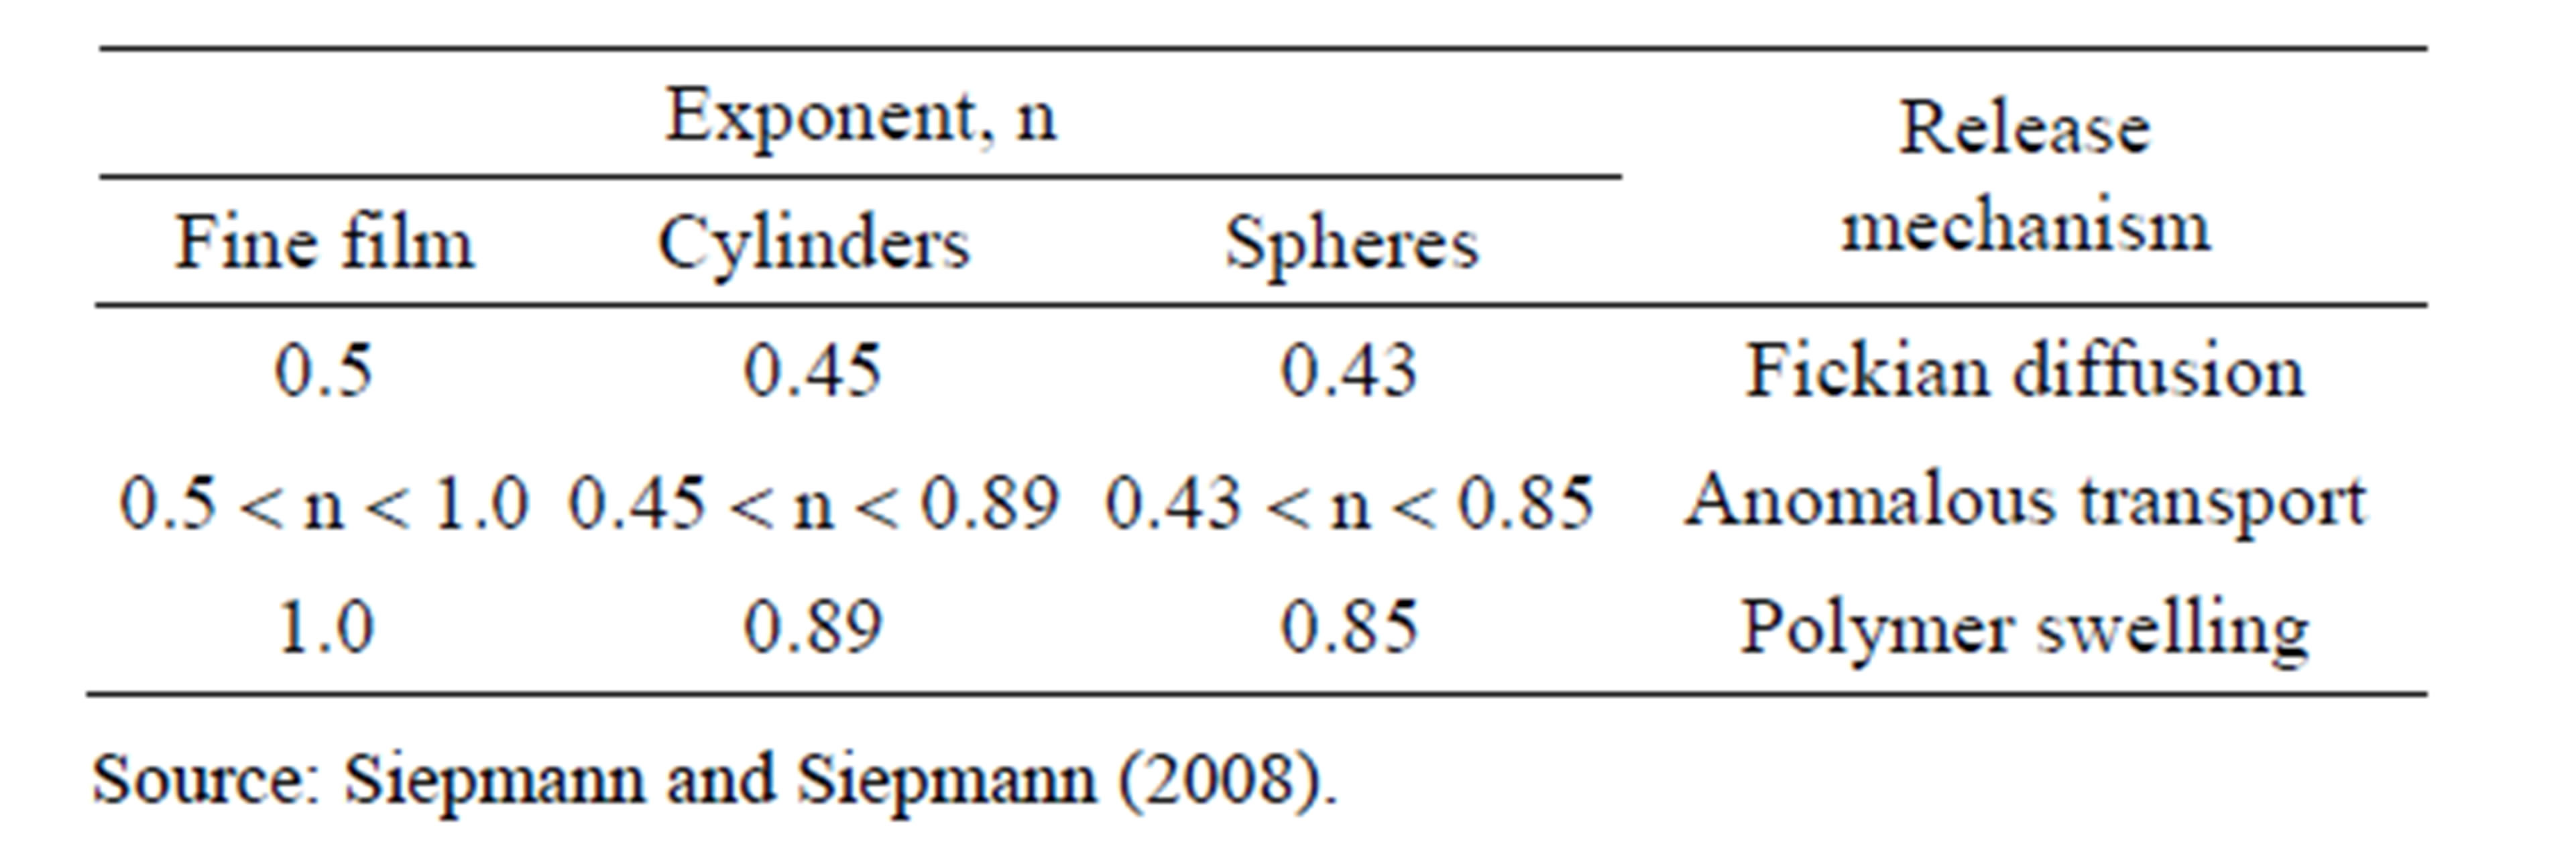
Table 6. Values for the exponent n of the Peppas equation and the drug release mechanism from the polymeric systems of different geometries.

Figure 10. Application of Peppas equation for sample G7 and correlation coefficient recorded for the piroxicam release process according to time elevation to n = 0.67.

Figure 11. Application of Peppas equation for sample G5 and R2 recorded for the piroxicam release process according to time elevation to n = 0.85.
The piroxicam release kinetics analysis based on different Gel/CMC sample compositions and the drug quantity present in the medium show that the release mechanism differ from each other in the first minutes of assay. Samples G4 and G8 are governed by diffusion, the first under the first kinetic order and the second under the second kinetic order. Samples G7 and G5 are distinctly governed by anomalous transport in the first 35 min and matrix swelling for the time interval between 20 and 40 min, respectively. It is understood that the formulations envisaged in factorial planning, in addition to influencing the EE%, caused changes in the release mechanism in the first minutes of this process.
4. Conclusions
The factorial planning analysis indicated that the Gel/ CMC matrix had a maximum encapsulation efficiency (EE%) of 10.64% when the matrix contained higher levels of CMC and glutaraldehyde. However, the micrographics of some compositions revealed part of the drug absorbed on the particle surface. The DSC and XRD analyses indicated that the piroxicam remained in the matrixes, keeping the same crystalline form identified when pure.
On evaluating release through the model proposed by Reis et al. (2007) it was observed that the four samples G4, G5, G7 and G8 released 100% of the drug in a 120 min period.
The piroxicam release kinetics study based on different gelatin/CMC matrix compositions and the quantity of drug present in the medium revealed that the differences in the contents of each factor interfere with the release mechanism in the first minutes of the assay. In accordance with the models applied, piroxicam release from samples G4 and G8 is governed by diffusion, the first according to first order kinetics and the second under second order kinetics. Sample G7 is governed by anomalous transport in the first 35 min and the sample G5 by matrix swelling for the time interval between 20 and 40 min. It is understood that the formulations envisaged in factorial planning, in addition to influencing the EE%, caused changes in the release mechanism in the first minutes of this process.
REFERENCES
- R. M. Pereira, L. Cruz, I. M. Ré and S. S. Guterres, “Micropartículas Secas Contendo Fármaco Modelo Lipofílico Preparadasa Partir de Suspensão Aquosa: Estudo de Formulação,” Acta Farm. Bonaerense, Vol. 25, No. 2, 2006, pp. 198-205.
- A. J. Vaidya, P. Aviral Khare, K. Ram, J. Agrawal and K. Sanjay, “Metronidazole Loaded Pectin Microspheres for Colon Targeting,” 2009.
- A. Korolkovas, “Dicionário Terapêutico Guanabara 2002/ 2003,” Rio de Janeiro: Guanabara Koogan, 2002.
- F. Cui, K. Shi, L. Zhang, A. Tao and Y. Kawashima, “Biodegradable Nanoparticles Loaded with Insulin-Phospholipid Complex for Oral Delivery: Preparation, in Vitro Characterization and in Vivo Evaluation,” Journal of Controlled Release, Vol. 114, No. 2, 2006, pp. 242-250. http://dx.doi.org/10.1016/j.jconrel.2006.05.013
- P. Couvreur, M. J. Blanco-Pietro, F. Puisieux, B. Roques and E. Fatal, “Multiple Emulsion Technology for the Design of Microspheres Containing Peptides and Oligopeptides,” Advanced Drug Delivery Reviews, Vol. 28, No. 1, 1997, pp. 85-96. http://dx.doi.org/10.1016/S0169-409X(97)00052-5
- R. Dinarvand, S. Mirfattah and F. Atyabi, “Preparation, Characterization and in Vitro Drug Release of Isosorbide Dinitrate Microspheres,” Journal of Microencapsulation, Vol. 19, No. 1, 2002, pp. 73-81. http://dx.doi.org/10.1080/02652040110065387
- M. R. Guilherme, M. R. De Moura, E. Radovanovic, G. Geuskens, A. F. Rubira and E. C. Muniz, “Polymer,” 2005.
- E. C. Muniz and G. Geuskens, “Influence of Temperature on the Permeability of Polyacrylamide Hydrogels and Semi-IPNs with Poly(N-Isopropylacrylamide),” Journal of Membrane Science, Vol. 172, No. 1-2, 2000, pp. 287-293. http://dx.doi.org/10.1016/S0376-7388(00)00346-X
- N. A. Peppas, P. Bures, W. Leobandungle and H. Ichikawa, “Hydrogels in Pharmaceutical Formulations,” European Journal of Pharmaceutics and Biopharmaceutics, Vol. 50, No. 1, 2000, pp. 27-46. http://dx.doi.org/10.1016/S0939-6411(00)00090-4
- A. V. Reis, O. A. Cavalcanti, A. F. Rubira and E. C. Muniz, “Synthesis and Characterization of Hydrogels Formed from a Glycidyl Methacrylate Derivative of Galactomannan,” International Journal of Pharmaceutics, Vol. 267, No. 1-2, 2003, pp. 13-25.
- X. Zhang, Z. Hu and Y. Li, “Rubber Elasticity of Polyacrylamide Gels in High Network Concentration,” Polymer, Vol. 39, No. 13, 1998, pp. 2783-2788. http://dx.doi.org/10.1016/S0032-3861(97)00642-3
- C. G. Bazzo, L. E. Senna and N. T. A. Pires, “Poly (3 Hydroxybutyrate)/Chitosan/Ketoprofen or Piroxicam Composite Microparticles: Preparation and Controlled Drug Release Evaluation,” Carbohydrate Polymers, Vol. 77, No. 4, 2009, pp. 839-844. http://dx.doi.org/10.1016/j.carbpol.2009.03.006
- T. P. A. Rinaldi, K. S. Mazera, R. B. Pezzini, M. Zétola and C. G. Bazzo, “Preparo e Caracterização de Micropartículas de Acetobutirato de Celulose e Poli(3-hidroxibutirato) Contendo Piroxicam. Acta Scientiarum,” Health Sciences, Vol. 31, No. 1, 2009, pp. 51-56.
- J. N. Joseph, S. Lakshimi and A. Jayakrishnan, “A Floating-Type Oral Dosage form for Piroxicam Based on Hollow Polycarbonate Microspheres: In Vitro and in Vivo Evaluation in Rabbits,” Journal of Controlled Release, Vol. 79, No. 1-3, 2002, pp. 71-79. http://dx.doi.org/10.1016/S0168-3659(01)00507-7
- J. Siepmann and N. A. Peppas, “Modelingof Drug Release from Delivery Systems Based on Hydroxypropryl Methylcellulose (HPMC),” Advanced Drug Delivery Reviews, Vol. 48, No. 2-3, 2001, pp. 139-157. http://dx.doi.org/10.1016/S0169-409X(01)00112-0
- J. Siepmann and F. Siepmann, “Mathematical Modeling of Drug Delivery,” International Journal of Pharmaceutics, Vol. 364, No. 2, 2008, pp. 328-343. http://dx.doi.org/10.1016/j.ijpharm.2008.09.004
- Y. Tabata and Y. Ikada, “Synthesis of Gelatin Microspheres Containing Interferon,” Pharmaceutical Research, Vol. 6, No. 5, 1989, pp. 422-427. http://dx.doi.org/10.1023/A:1015991617704
- A. P. Rokhade, S. A. Agnihotri, A. P. Sangamesh, N. N. Mallikarjuna, P. V. Kulkarni and T. M. Aminabhavi, “Semi-Interpenetrating Polymer Network Microspheres of Gelatin and Sodium Carboximethyl Cellulose for Controlled Release of Ketorolac Tromethamine,” Carbohydrate Polymers, Vol. 65, No. 3, 2006, pp. 243-252. http://dx.doi.org/10.1016/j.carbpol.2006.01.013
- B. D. Rorabacher, “Statistical Treatment for Rejection of Deviant Values: Critical Values of Dixon’s “Q” Parameter and Related Subrange Ratios at the 95% Confidence Level,” Analytical Chemistry, Vol. 63, No. 2, 1991, pp. 139-146. http://dx.doi.org/10.1021/ac00002a010
- G. C. Bazzo, E. Lemos-Senna, M. C. Goncalves and A. T. N. Pires, “Effect of Preparation Conditions on Morphology, Drug Content and Release Profiles of Poly(hydroxylbutyrate) Microparticles Containing Piroxicam,” The Journal of the Brazilian Chemical Society, Vol. 19, No. 5, 2008, pp. 914-921. http://dx.doi.org/10.1590/S0103-50532008000500016
- A. P. Rokhade, S. A. Agnihotri, A. P. Sangamesh, N. N. Mallikarjuna, P. V. Kulkarni and T. M. Aminabhavi, “Semi-Interpenetrating Polymer Network Microspheres of Gelatin and Sodium Carboximethyl Cellulose for Controlled Release of Ketorolac Tromethamine,” Carbohydrate Polymers, Vol. 65, No. 3, 2006, pp. 243-252. http://dx.doi.org/10.1016/j.carbpol.2006.01.013
- “Farmacopéia Portuguesa,” 7th Edition, Infarmed, Lisboa, 2003.
- F. Vrečer, M. Vrbinc and A. Meden, “Characterization of Piroxicam Crystal Modifications,” International Journal of Pharmaceutics, Vol. 256, No. 1-2, 2003, pp. 3-15. http://dx.doi.org/10.1016/S0378-5173(03)00057-7
- V. A. Reis, R. M. Guilherme, F. A. Rubira and C. E. Muniz, “Mathematical Model for the Prediction of the Overall Profile of in Vitro Solute Release from Polymer Networks,” Journal of Colloid and Interface Science, Vol. 310, No. 1, 2007, pp. 128-135. http://dx.doi.org/10.1016/j.jcis.2006.12.058
- P. Costa and J. M. S. Lobo, “Modeling and Comparison of Dissolution Profiles,” European Journal of Pharmaceutical Sciences, Vol. 13, No. 2, 2001, pp. 123-133. http://dx.doi.org/10.1016/S0928-0987(01)00095-1
NOTES
*Corresponding author.