Mechanistic Study of Anticancer Activity of Some Known Aminopyrimidoisoquinolinequinones via QSAR Classification Methodology ()
1. Introduction
The quinone moiety has been showed to possess anticancer activity and numerous cancer drugs in clinical use contain this unit since the discovery of daunorubicin (daunomycin 1a) and adriamycin (doxorubicin 1b) in 1960’s [1] [2] [3]. These two compounds are commonly used clinical agents in the therapy of various types of cancers (hematologic, solid tumors, …, etc.) [4]. They belong to anthracycline class of compounds which are featured by anthracene-9,10-dione chromophore to which is fused a six-membered alicyclic ring with a carbethoxy group at C9 and a sugar moiety at C7 [5].
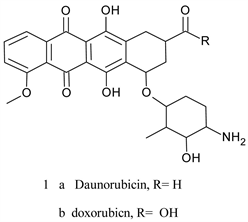
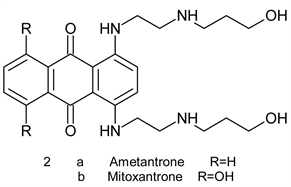
These compounds are naturally occurring antibiotic isolated from cultures of streptomyces species [2]. They relate to tetracycline antibiotics but are far more toxic. Drawbacks of anthracycline therapy include, among others, pronounced dose-dependent cardiotoxicity (heart failure in some patients) stem from generationof hydrogen peroxide and reactive oxygen species (ROS) through redox cycling [6] [7]. This is also true for ametantrone 2a, which is a derivative of anthraquinone (anthracene-9-10-diones), that has high cardiotoxicity riskand mitoxantrone 2b, another synthetic derivative of anthracene-9-10-dionewhich induces an acute myocarditis and arrhythmia during infusion [8] [9].
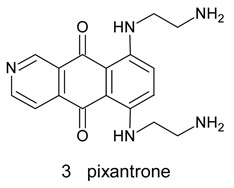
Pixantrone 3 is a modified ametantroneazaanolgue where the C-atom at position 9 was replaced by N-atom. It was proved to have anticancer activity with lower cardiotoxicity. This drug, however, fail to obtain FDA approval in the USA due to inconsistence of Phase II and Phase III data regarding cardiotoxicity. Recent studies shades doubts about its alleged reduced cardiotoxicity [10] [11].
Research efforts were directed toward obtaining better agents in an attempt to mitigate the cardiotoxicity of the initial anthracycline exposure, thereby preserving the myocardial integrity [12]. Chromophore modification to alleviate cardiotoxicity yielded anthrapyrazoles and their aza analogues4, which related to ametantrone and mitoxantrone. The most active compounds from these categories is losoxantrone 4a, which is an anthrapyrazole, and BBR3438 4b which is an aza anthrapyrazole. The modification includes the incorporation of a pyrazole ring converting the quinone moiety into quasi quinone and, in case of aza analogues, incorporation of an N atom in position 9 [13] [14].

Angucyclinones 5a are aromatic polyketides and naturally occurring biologically active angular benz (a) anthrathene-9,10-dione derivatives [15]. They look like the anthracyclines in that they are naturally occurring isolated from numerous strains of Streptomyces [16], in addition to their derivation from the same chromophore. They show antifungal, antiviral, antibiotic, antitumor activities [17]. The capability of modification in the angucyclinones rouses arouses a considerable interest in their synthesis toward development of a new antitumor drug [18].
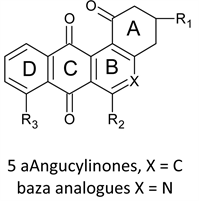
Reports about the aza analogues 5b of angucyclinone are less common and are due mainly to Valderrama [19]. These workers synthesized a number of azaanalogues of angucyclinone which show good activity when tested against a panel of cancer cell lines. The same group reported the synthesis and anticancer evaluation of two groups of tricyclic aza analogues with ring D removed. The angular ring isdimethylprimidodione in one group, (8-aminopyrimido [4,5-c] isoquinolinequinones, APIQ’s) [20] anda cyclohexanone in the other (8- and 9-phenylamino-3,4-tetrahydro-phenanthridine-1,7,10 (2H)-triones, PPT) [21]. Both groups show comparable activity which is generally better than that of angucyclinones. In this paper we study the activity of APIQ’s in attempt to expose mechanistic aspects via Quantitative structure-activity relationships (QSAR) mythology.
QSAR is a mature scientific discipline which aids to find a mathematical relationship between the biological response of a series of congeneric molecules and various aspects of molecular behavior encoded by numerous molecular descriptors or physicochemical parameters [22]. To that end, computational methods become an indispensable tool for drug designers to obtain molecular descriptors and to derive the mathematical correlation [23].
If the sole purpose of a model is prediction of activity of related untested compounds, regression analysis is used, but if the purpose of analysis is to categorize data according to a specific criterion, then classification methods is resorted to. There are several algorithms to perform each of these types of QSAR analyses. Regression could be done by linear regression, partial least squire regression, principle component analysis among others. Classification, on the other hand, could be performed by decision tree, random forest, K-nearest neighbor and regression clustering [24] [25]. The principle of classification analysis is to break down a larger data set with poor correlation metrics into smaller subsets with much improved metrics [26]. Regression clustering could be used in mechanistic study to furnish the attractive features of explaining the variabilities of descriptors with response. Linear regression and regression clustering are used in the present study to extract information about predictive ability and about hidden mechanistic trends of a data set of 29 known aminopyrimidoisoquinolinequinones (APIQ’s).
2. Method and Material
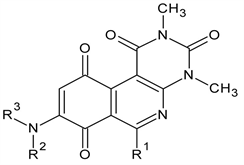
Drawing of structures and calculating the descriptors was carried out using ACDlab/chemsketchfreeware2015.2.5, Arguslab 4 and Molecular operation environment (MOE) 2008 software. The descriptors used in the present study include the logarithm of octanol/water partition coefficient (Log P), moler volume (MV), molar refractivity (MR), sum of atomic polarizabilities (apol), electrophilicity index (ω), surface rugosity (Rug) and hydrogen bond donor capacity (HBD). Statistical analysis was performed using Microsoft Excel 2010 program. Classification through regression clustering was performed as we described before [27]. The biological activity used in the present study is the anticancer activities of compounds 1-29 against human gastric adenocarcinoma (AGS) cell line which were taken from literature (Vasquez et al. 2010). Table 1 below shows the structures of compounds used in the present study.
The molecular descriptors and biological activity data of APIQ’s are shown in Table 2 below.
![]()
Table 1. Chemical structures of aminopyrimidoisoquinolinequinones (APIQ’s).
![]()
Table 2. Molecular descriptors and biological activity data of compounds 1 - 29.
AGS* human gastric adenocarcinoma cell line; NA** = not available.
3. Results and Discussion
1) Regression analysis of log P, MR, MV and their combination versus IC50
Biological activity data was first curated by removing problematic data points. These are namely points 1 and 2 because of their high standard error of the mean; point 14 for which no datum is available (NA) and point 21 for which the value is not specified (>100). The rest of data points were used to develop QSAR equations. We run both simple and multiple linear regressions to find the degree of correlation of each parameter with IC50 and that of them, combining two at a time, with IC50. The combination of two parameters is done after referring to their correlation matrix (Table 3 below).
LogP could be combined with both MR and MV owing to its low collinearity with each of them (R2 = 0.36 and 0.48 respectively). MR and MV cannot, however, be combined in one and the same equation owing to their collinearity (R2 = 0.8). The resulting equations are as follows:
Correlation of logP versus IC50:
(1)
n = 25, R2 = 0.00048, S = 7.04, F = 0.0111
Correlation of MR versus IC50:
(2)
n = 25, R2 = 0.15, S = 6.5, F = 4.04
Correlation of MV versus IC50
(3)
n = 25, R2 = 0.2, S = 6.308, F = 5.7
Correlation of both logP and MR versus IC50
(4)
n = 25, R2 = 0.25, S = 6.243, F = 3.646
Correlation of both logP and MV versus IC50
(5)
n = 25, R2 = 0.41. S = 5.54, F = 7.622.
Equations (1)-(5) indicate that the models are not predictive as evident from poor statistical materics. Equation (1) represents correlation between lipophilicity measured by logP and biological response. The nearly zero value for Pearson coefficient (R2) indicates that the variation in biological activity of APIQ’s is totally independent from variation in lipophilicity. MR is a descriptor of both polarizability and volume of the molecule and it accounts for about 15% (R2 = 0.15, Equation (2)) of the variation of biological activity. Owing to the higher contribution of MV in explaining the variation of biological activity (~20%, Equation (3)), it seems that the presence of a term for molecular polarizability in the expression of MR lower overall contribution in explaining the variability of the biological response. Combination of LogP and MR give improved correlation
![]()
Table 3. Correlation matrix of descriptors and response.
(25% explained variability). Abetter correlation was obtained by combining logP with MV (41% explained variability). Still the model could not be used for predictive purposes. Individual compounds exhibit appreciable activity against cancer although the present sets of descriptors could not capture the variability of the biological activity. This may result from the existence of various subgroupshidden in the main dataset, which oppose each other leading to weakening of a unifying trend line correlating the descriptors with their response. These descriptors could, therefore, be used to expose these supposed subgroups. This is done through classification.
2) Classification analysis
Each of data set used to develop Equations (1)-(3) above, were subjected to a process of simple clustering described before [27]. The clustering was based on each of the parameters in turns. Upon scrutiny, we choose the clustering based on MV to explore mechanistic trends. The reasons for this choice are: 1) MV gave us the highest R2 value in regression analysis of the original data set (R2 = 0.2); 2) it gave five clusters each containing five data points therefore obeying the rule of thumb of QSAR (5 data points for each parameter). The regression clustering output thus obtained is shown in Table 4 below.
The regression lines along which data points of each clusterlie are illustrated in Figure 1 below.
![]()
Figure 1. Regression lines for various clusters.
![]()
Table 4. Statistical metrics for clustering based on (MV).
It is noticed that cluster 5 is not depicted in Figure 1 above owing to the poorness of its MV/IC50 correlation as evident from the R2 value (−0.03). In order to justify our classification, we selected some other parameters which reflect different aspects of molecular behavior. These include, in addition to logP, sum of atomic polarizabilities (apol) to describe dispersion forces such as van der Waal interaction; surface rugosity or roughness (Rug) to follow surface topology of the legend; hydrogen bond donor capacity HBD to capture the ability of legend to act as a donor in hydrogen bonding with receptor and electrophilicity index ω which reflects the ability of legend to act as an electrophile accepting electrons from the receptor. All the above described descriptors were regressed against IC50 both linearly and parabolically and Pearson coefficients are collected in Table 5 below.
The presence of mechanistic subgroup nested in APIQ data set could be justified by examining Table 5 above. We are going to discuss the variation of biological activity with each parameter for clusters 1 - 5, one at time, to demark the mechanistic difference among these clusters.
Sum of atomic polarizabilities (apol): this could be considered as an indicator of dispersion interaction of APIQ’s with their receptor [28]. Figure 2 below shows the plots of apol vs IC50 for each cluster exhibited side by side for easy comparison. It could be seen from the plots that clusters 1, 2 and 4 show high association between apol and IC50 (
, 0.87 and 0.86 respectively) but they traverse different response space; cluster 1 exists between (0 - 20) response units while cluster 2 exists between (~0 - 30) response unit; cluster 4 exists between (2 - 10) response units. For these clusters the response is directly proportional to descriptor. Cluster 3 shows moderate association between the descriptor and the response (
) and spans between (0 - 15) response units. The response has an inverse proportionality to descriptor in cluster 3. No linear
![]()
Table 5. Pearson coefficient for correlation between IC50 and selected parameters for clusters 1 - 5.
![]()
Figure 2. The shape regression lines resulted from plotting IC50 vs apol for the clusters obtained based on MV.
correlation is to be found between the descriptor and the response in case of cluster 5 (
). All the above arguments indicate the existence of different mechanistic profiles among our five clusters of APIQ’s as far as dispersion interaction-represented by apol is concerned.
Both linear and parabolic fittings are similar for clusters 1 and 4;
for cluster 1, compared to
and
for cluster 4. For the rest of clusters, the parabolic fitting gives higher R2 compared to linear fitting. This is dramatically borne out by cluster 5 where R2 rises from 0.00 for linear fitting to almost 0.79 for parabolic fitting. Similarly, for cluster 2 the rise in R2 is also sharp; 0.87 for linear to 0.99 for parabolic. Cluster 3 exhibits a milder increase;
to
. The foregoing argument implies that for clusters 3 and 5, the descriptor apol explains the variability in the biological response in non-linear manner. The overall good linear and/or parabolic correlations indicate that the distribution of electron along the entire volume of the legend has something to complement with inside the receptor pocket.
Surface rugosity (Rug) is a descriptor for molecular surface roughness. It represents the ratio of volume to surface. The smaller the ratio is, the larger the rugosity [29]. It is apparent from Table 5 above that the correlation between Rug and IC50 is parabolic rather than linear for all clusters (
, 0.98, −0.86, 0.94 and 0.83 for 1, 2, 3, 4 and 5 respectively).
Hydrogen bond donor capacity HBD: expressed in terms of the number of possible hydrogen-bond donors [29]. This is inversely correlated with the response for clusters 1, 2, and 4 and directly correlated with the response for clusters 3 and 5. Again the relations are parabolic rather than linear. Clusters 1, 2 and 3 show high positive non-linear (parabolic) correlations (
, 0.93 and 0.95 respectively) while cluster 4 shows a poor positive non-linear correlation (
). Cluster 5 shows a moderate (
) positive correlation.
Electrophilicity index ω: measures the tendency of a molecule as a whole to accommodate electrons [29]. The descriptor ω shows very poor correlation for all the clusters with exception to cluster 2 which exhibits very good correlation both linearly (
) and parabolically (
). Upon contemplating the structures of the member compounds of this cluster we noticed that four of them (5, 17, 18 and 19) carry a strong electronegative groups at the para position of aniline ring attached at C8 of the parent molecules; namely methoxy, hydroxy, methoxy and flouro respectively. The fifth compound (compound 23) carries two methoxy groups at ortho and meta positions. It seems that the presence of these electronegative atoms in these compounds increase their ability to accommodate electrons hence the compliance between ω and the observation (presence of electronegative atoms) discussed above. This fits nicely with our finding and gives a good credit for our clustering methodology. We can add a comment about the complimentary receptor site receiving such molecules; which must be nucleophilic, capable of donating electrons to be accommodated by our compounds. A detailed quantum mechanical study of electronic disposition of the compounds of cluster 2 will be published in a separate paper.
Logarithm of octanol/water partition coefficient Log P: this parameter shows high linear and/or parabolic correlations with the response for clusters 1 (
,
), cluster 3 (
,
) and cluster 5 (
,
). For clusters 2 and cluster 4 the correlations are very poor (
and −0.01 respectively).
4. Conclusion
We conclude that for this particular group of APIQ’s, the absence of universal correlation between their anticancer activity and the descriptors for lipophilicity and volume/polarizability is due to presence of nesting subgroups exhibiting varied mechanistic profiles. We have used a simple clustering method to segregate the data set into 5 clusters, each of which fits a separate trend line based on MV. We used five descriptors to emphasize the divergence of APIQ’s into distinct mechanistic profiles.