Computer Aided Design for the Recovery of Boil-Off Gas from LNG Plant ()
1. Introduction
According to statistical data from IEA (International Energy Agency) in 2010, Liquefied Natural Gas (LNG) international market now accounts for approximately 299 billion cubic metrics which is about 9% of need for natural gas [1] . It further says that LNG has been steadily increasing its market share in the global gas trade. Natural gas is preferred over fossil fuel because of its abundance, cleaner and purer burning characteristics and possible lower cost. The world natural gas liquefaction nameplate capacity reached 301.5 MTPA (million tonnes per annum) in 2015 according to (Carroll, 2016) [2] also; the total LNG trade reached 244.8 MT (million tonnes) in 2015, up 4.7 MT from 2014. Presently, a new liquefaction complex of about 142 MTPA capacity as of January 2016 was under construction worldwide; however, a total production has reached 890 MTPA [2] .
LNG is considered as a clear, nontoxic, noncorrosive, odourless cryogenic liquid, which is mostly methane that is cooled to its liquid state at atmospheric pressure. The natural gas requires cooling to a temperature of approximately −160˚C. The actual temperature depends on the precise composition of the natural gas profile. For LNG shipping to be economically viable, liquefying the natural gas is the way to go. It reduces the volume by a factor of about 600 folds.
Liquefied natural gas (LNG) is liquid at a temperature just below its boiling point. It is mostly stored and transported in tanks as a cryogenic liquid. It evaporates at temperatures above its boiling point and generates Boil-Off Gas (BOG). This Boil-off is caused by the heat ingress into the LNG stream during storage, loading/unloading operations and shipping. The amount of BOG generated depends on the design and the actual operating conditions of LNG tanks, process lines and ships.
BOG is continuously generated due to the temperature gradient from the immediate environment and the LNG product in the tank or process lines.
During LNG handling activities like loading, unloading, shipping, and storage, the product is still kept at cryogenic temperatures within the system. If the generated vapour is not managed properly, it has to be disposed via venting or flaring causing environmental air pollution around the facilities and huge financial losses. BOG major composition is methane (CH4). It has global warming potential of about 21 times than that of CO2 over a century period [3] .
In a receiving terminal Boil-off-gas (BOG), generation and recovery is well established. But, BOG handling and recovery in a liquefaction plant offers some real interesting challenges. According to Huang et al., 2007 [4] during normal operation of a natural gas (NG) liquefaction facility, BOG is produced due to the following activities:
1) Flashing of the LNG in the tank.
2) Heat ingress into the LNG storage tanks and piping system.
3) Heat added from plant LNG cryogenic pumps.
This mode can be called the holding mode operation of the liquefaction plant. The BOG generated during this mode is compressed and mostly used as fuel gas.
During LNG ship-loading activity i.e. loading mode, additional BOG is generated due to the following:
1) Vapour displacement from the ship tanks.
2) Initial cooling down of the carrier tanks.
3) Energy input from LNG loading cryogenic pumps
4) Heat leakage through piping and vessels.
Physio-Chemical Properties of the LNG Boil-off Gas
The composition of LNG according to (Benito, 2009) [5] depends on the traits of the natural gas source and the process treatment of gas at the liquefaction facility, i.e. the liquefaction pre-treatment and the liquefaction process. It can also vary with storage conditions and customer specification. Liquefied natural gas (LNG) is a liquid substance which is a mixture of light hydrocarbons primarily composed of methane (CH4, 85% - 98% by volume), with smaller quantities of ethane (C2H6), propane (C3H8), higher hydrocarbons (C4+) and nitrogen as an inert component. Namely, LNG producers decide the quality of their LNG based on their gas field composition and very importantly, market demand. Liquefied natural gas end product is colourless, odourless, noncorrosive and non-toxic liquid in nature which is lighter than water. Typical thermo-physical properties of LNG are presented in Table 1.
![]()
Table 1. Thermo-physical properties of LNG [6] .
From the current literature survey, the basic studies on optimal design and operation for recovering BOG from flare in LNG receiving/loading terminals are still lacking. The illustration of this work is from industrial study on BOG scenarios and how it was being handled.
During operation of the facility five typical BOG scenarios can be identified:
1) Gas-up of ship (containing either CO2 or N2) or inert gases, mostly ship from Dry-dock.
2) “Extended cool-down” of a ship above the intake temperature of the BOG compressors (−45˚C).
3) “Extended cool-down” below the intake temperature of the BOG compressors.
4) Design loading mode: BOG returning at a temperature about −140˚C (normal cold ship loading and tank boil-off),
5) Design holding mode: tank BOG only.
These scenarios are handled differently.
1) From the first scenario, there is no choice but to send the BOG to flare until the inert gas is displaced with methane vapour. The BOG system is operated in such a way that the Pressure Control Valve (34PC031) remains shut to prevent CO2 from potentially freezing the valve. This is normally done on Jetty 2, aligning the vapour return up with the low-pressure tank flare to maximise the physical separation with the pressure control valve (34PC031).
2) For the second scenario BOG is usually routed to the flare as it cannot be routed to the BOG compressors because the temperature is way above the compressor to avoid quenching or high power throughput from the BOG Compressor.
3) In the third scenario for the extended cool-down below the intake temperature of the BOG Compressor, the BOG compressors are fully loaded and any excess BOG can in principle be taken in by the end-flash gas compressors, up to a 900 tonnes per day (t/d). This is not always done, as it requires reduction of the run-down temperature, which is negatively impacting production.
4&5) Design loading mode: BOG returning at a temperature about −140˚C (normal cold ship loading and tank boil-off) and Design holding mode: tank BOG only. Finally, the above two conditions (Design Loading Mode & Design Holding Mode) are considered as the normal loading operation which is seamlessly handled by the BOG compressors only. But upon maximum feed at BOG header, assistance by the End Flash Gas compressors may be required, thereby lowering rundown temperature of the LNG to tank as required. During normal production the BOG compressors can usually handle the production without the help of the EFG compressors.
In this work, Computer Aided Design for the recovery of BOG from flare in an LNG Plant considered the dynamic nature of the BOG with the minimum total energy consumption. A rigorous simulation based optimization model using HYSYS V8.8 was presented. BOG scenarios are considered and the scope of this work was chosen from scenario 2 to 5. The flare generated as a result of the operational activities considering the scenarios are tabulated in Table 2 and Pie representation of possible flare areas discussed.
Considering the flare contributors in the Pie Chart Figure 1, is quite clear that 25.3% of BOG is flared on minor trips from End Flash Gas Compressors (EFGC)
![]()
Figure 1. Pie Chart of Flare Contributors in an LNG Plant [7] .
which is not discussed in this work. The focus of this work is on the recovery of 23.6% BOG flared from Warm ship which will significantly improve the earnings of the LNG Plant in Figure 1 and salvage the immediate environment.
The table below was the survey done on 2010 considering LNG Ship handling and flaring figures per quarter [7] .
It was obvious that Warm Ship with flaring has the highest total number of ships against the Number of inert ships from dock-yard and Ship without flaring.
As a result of increase in the amount of LNG ships loaded, the turnover of warm ships has also increased. Add numbers here. This, in turn, has resulted in more flaring of warm vapours during ship cool-down. However, the use of Computer-aided design to recover the warm vapour within the limits of our KPI to minimise high flaring of boil-off gas from the LNG plant is the aim of this work.
2. Problem Statement
One of the problems in LNG transportation and storage is the generation of BOG. These vapours are created due to the heat added into the LNG during storage, transportation and loading/unloading operations. Major problem in the downstream sector is the flaring of excess BOG to the atmosphere from LNG plant, owing to limited space to contain the produced Boil-off Gas. Environmental issues arising from the above have led to problem of acid rain, greenhouse gas emission, global warming to global flooding and several public health issues.
From Table 2, considering the BOG scenario, it is quite clear that the Warm Ship has highest amount of BOG (Tons) flared compared to other stated conditions.
![]()
Table 2. LNG Ship Handling and Flaring Figures [7] .
The BOG scenario number two depicts a condition where the BOG from the header has a higher temperature compared to the Suction temperature of BOG Compressor > −45˚C and End Flash Compressors. “Extended cool-down” of a ship above the intake temperature of the BOG compressors (−45˚C). This implies that the warm LNG carrier needs to be cooled down to BOG Compressor suction temperature before been loaded.
Throughout the loading operation, the ship returns Boil-Off Gas to shore, which flows through the BOG header to the LNG storage tanks, the BOG compressors and End-Flash Gas compressors. The initial gas displaced from the ship’s vapour return (SVR) header is initially warm since the vapour return line is allowed to warm up between ship loadings. This warm gas, is flared until the temperature reduces to the maximum temperature allowed by the BOG compressor suction temperature controller, (34-TRCA-079) (~below -45˚C). The warm ship is considered between 20˚C to - 44˚C ship temperature. The Extended Cool Down for scenario 2 of the LNG carrier where the ship and process lines are warm lasts between 6 - 12 hours minimum before the vessel LNG loading commences. The BOG vapour is routed to flare for that long hours.
For scenario 3 where the BOG from the LNG carrier is below the intake temperature of the BOG compressors, it takes about 1 - 2 hours of flaring. More so, because the capacity of the BOG Compressor and End Flash Compressor is known and limited. Once the maximum margin is achieved the rest of the vapour in flow is routed to flare due to limited capacity of the compressors to recover the BOG. Thus the need to recover the BOG before been flared arises.
On Normal Design loading and Holding Mode, the BOG & End Flash Gas (EFG) compressors can handle the vapour return from the vessel with minimum or no flare. The output of the Compressors goes to the Fuel- gas Header for plant use.
Governing Equation
EOS: Peng-Robinson equation of state. This is considered for the fluid package in Aspen HYSYS which is effective for Natural gas behaviours.
(2.1)
where ω is the acentric factor of the species. R is the universal gas constant and
(2.2)
Z is compressibility factor. P is Pressure (bar), T is Temperature in ˚C.
1) The parameters should be expressible in terms of the critical properties and the acentric factor.
2) The model should provide reasonable accuracy near the critical point, particularly for calculations of the compressibility factor and liquid density.
3) The mixing rules should not employ more than a single binary interaction parameter, which should be independent of temperature, pressure and composition.
4) The equation should be applicable to all calculations of all fluid properties in natural gas processes.
Boil-Off Rate (BOR): This is the rate at which the LNG boils off to vapour on exposure to temperature variation. The amount of liquid that is evaporating from a cargo, storage tank or process line due to heat leakage are expressed in percentage of total liquid volume per unit time.
This value can be calculated by the expression:
(2.3)
(2.4)
where BOR is in %/day,
VBOG is volume of BOG in m3/s,
VLNG is volume of LNG in cargo tanks in m3,
ρ density of LNG in kg/m3,
Q heat exchange in W, (KJ/s)
ΔH latent heat of vaporisation in J/kg.
Typical BOR caused by heat ingress for newer LNG tankers ranges from 0.10% to 0.15% for laden (loaded) voyage and from 0.06% to 0.10% for ballast voyage [5] [6] [8] .
3. Methods
In the course of this design, the scope of work of this project was considered. The scope of this work will cover three typical BOG scenarios in an LNG Plant. The areas include but not limited to: Extended cool-down of ship above the intake temperature of the BOG Compressors (−45˚C). Extended cool-down of ship below the intake temperature of the BOG Compressors (−45˚C). Design Loading Mode & Holding Mode: BOG returning at a temperature about −140˚C (Normal Cold Ship loading and tank boil-off).
The scope was a result of quantitative study done on Ship handling and Flaring contributors in 2010 on an LNG Plant where flaring was high against the KPI standard for the Plant. The BOG scenarios were deduced as the root causes of the flaring.
3.1. What Was Done
This BOG recovery design was done using computer aided software (Aspen HYSYS) to evaluate the value addition in the stream. After the Process Flow Scheme was developed, it was simulated considering the assumed BOG temperature scenarios. The assumed BOG temperature considered were −15˚C for Warm Ship above the BOG Suction temperature, −90˚C for Cold ship below the intake suction BOG temperature and finally −140˚C for Normal Cold Ship loading and tank Boil-Off. These different BOG-Feed temperatures were fed into the Flash Drum (Quencher) of figure 3.2 at different simulation scenarios at assumed constant mass flow rates of 25,000 kg/s with the normal Liquefied Natural Gas (LNG & LNG1) at 161˚C from the LNG Loading Header as quenchers also at assumed constant mass flow rate of 6250 kg/s. The BOG was quenched inside the drum where the process separated into vapour at the top and Liquid below. The vapour was fed into a BOG Compressor where the discharged pressure and temperature was increased. The output of the Compressor was fed to the Air cooler for temperature drop which gives a Cold stream product which can be used for utilities. While the outlet liquid from the Drum was pumped using figure 3.6 Cryogenic Pump to the LNG loading header as Liquid Product.
At −15˚C BOG Feed, after simulation of the PFS the Liquid Product temperature became −134.6˚C. For −90˚C BOG Feed, the Liquid Product temperature became −163.2˚C. Finally, at −140˚C BOG Feed, the Liquid Product temperature became −177.4˚C. The results can be seen in the datasheet at Appendices.
3.2. Computer Aided Design of the Process Simulation
This Process Flow simulation shows the interconnection of unit operation equipment and their respective energy duties. The Simulation was designed using ASPEN HYSYS software Version 8.8. The fluid-package for the design was Peng-Robinson Equation of State. This Process Flow Scheme showed three inputs in the Flash drum and two outputs (Vapour and Liquid phases) into the BOG Centrifugal Compressor and a Cryogenic Pump. The Compressor discharge went to a Cooler and the output was a Cold Product.
Also, the Liquid output from the Flash drum went into the Cryogenic Pump and the Pump discharge was a Liquid Product which goes to the Loading Header. The characteristics of each of the equipment used in the design are in the datasheet attached in the Appendices (Figure 2).
4. Results and Discussion
4.1. Liquefied Natural Gas Characterisation Results
Liquefied Natural Gas Characterisation Results showed the various output temperature achieved from different assumed BOG temperature scenarios after the simulation. This was stated in Table 3.
![]()
Table 3. BOG scenario of simulated temperature versus the corresponding Liquid Product.
From the simulation done considering BOG temperatures at various degrees to represent.
![]()
Figure 2. The HYSYS Simulation Model for the Recovery of the BOG in the LNG Plant.
1) Extended cool down of warm ship at −15˚C which was flared because it was above the BOG compressor suction temperature of −45˚C.
2) BOG temperature at −90˚C which represents extended cool down of ship below the BOG compressor Suction temperature of −45˚C.
3) Finally, the consideration was also for BOG temperature of −140˚C for Normal Design Loading & Holding Mode which was when the ship at the berth came very cold at that temperature. So her loading was seamless without flaring or at holding mode when the ship was not loading, the LNG stored in the tank generates BOG, due to the temperature gradient. This is called tank age BOG which was also considered for recovery.
4.2. Result of the Process Flow Simulation of the LNG Boil-off Using Aspen HYSYS
The Plant view material streams as stated in the report covered the inlet streams into the Flash Drum and outlet streams from the Compressor and Cryogenic pump. With HYSYS simulation at assumed constant inlet mass flowrate 25,000 kg/s for BOG FEED, 6250 kg/s for LNG & LNG1 used for quenching at various BOG feed temperature −15˚C, −90˚C and −140˚C, the outputs were achieved in Table 4.
![]()
Table 4. Scenarios and corresponding recoveries of the Process from the Appendices A, B & C.
4.3. Results of the Energy Streams Used for the BOG Recovery
From the Energy streams in Table 5, it’s quite clear that for Warm Ships benchmarked on average of about −15˚C has a Compressor Duty higher than Normal Cold Ship and Normal Design Mode. The energy expended by the compressor is more. This is accounted base on the Mass flow rate of vapour generated at the discharge of the compressor. The suction temperature of the compressor was −135˚C after quenching and the discharge temperature became 257.2˚C, along with the rise in pressure from 15 KPa to 2515 KPa (Appendix A).
For the cryogenic pump, less energy was expended pumping the Liquid product from the Flash drum back to the jetty head. This was because of the Liquid Product recovered from the process when compared to the Normal Design Mode.
![]()
Table 5. Energy Streams of Heat flow from the Appendices A, B & C.
The Air Cooler was able to cool the hot compressor discharge of about 257.2˚C to 45˚C expending the cooler duty of 1.903E+007. This accounts for the high mass flow 35,183 kg/s of Cold Product generated when compared to the other scenarios. The Liquid Volumetric flowrate generated for the Warm Ship scenario in the output Liquid Product was 26.92 m3/h and for the Cold Product was 93.49 m3/h.
The graphical representation of the performance behaviour of the cooler considering temperature and pressure was attached for further deductions.
4.4. Results of Inlet and Outlet Compositions Recovered from the Various Scenarios
The tables and figures below showed the compositions of the Inlet feed and the Output product recovered after the Process simulation (Tables 6-8 and Figures 3-5).
5. Conclusion and Recommendation
Conclusion
From the above tables, generated from the HYSYS Process simulation, it is shown that it is possible to separate almost pure CH4 on the cold stream output. There can be further value addition to maximise this clean energy end product.
The Liquid Product goes straight to the LNG header to the loading jetty. It contains less of methane gas and more heavies.
From the analysis above, the BOG recovered came out as either Liquid Product LNG or Cold Product gas. These results were all possible recoveries which were rather flared during ship loading operations at the jetty.
Extra value can be added to the Process Flow Scheme simulation to achieve less heat flow on the energy stream, and also, create more financial opportunities than resorting to flaring. More so, warm gas can be routed through this Process simulation of Quenching technology. Some reasonable amount of throughput of both Liquid and Cold products will be achieved which will be sent to the LNG loading header for liquid streams while the cold stream output will be utilised for local utilities and energy driven technology.
![]()
Figure 3. The LNG compositions and the corresponding mole concentration of the output after simulation −15˚C.
![]()
Figure 4. The LNG compositions and the corresponding mole concentration of the output after simulation at −90˚C.
![]()
Figure 5. The LNG compositions and the corresponding mole concentration of the output after simulation at −140˚C.
![]()
Table 6. Compositions of the Inlet feed and Output Product at (−15˚C) from Appendix A.
![]()
Table 7. Compositions of the Inlet feed and Output Product at (−90˚C) from Appendix B.
![]()
Table 8. Compositions of the Inlet feed and Output Product at (−140˚C) from Appendix C.
Finally, the host communities can benefit from the value addition on the cold product stream. Power turbines can be driven by the cold steams to generate electricity for the communities nearby and even exporting to the national power grid for revenue, rather than destroying the environment through continuous flaring of these gases, thus encouraging global warming effects and environmental pollution.
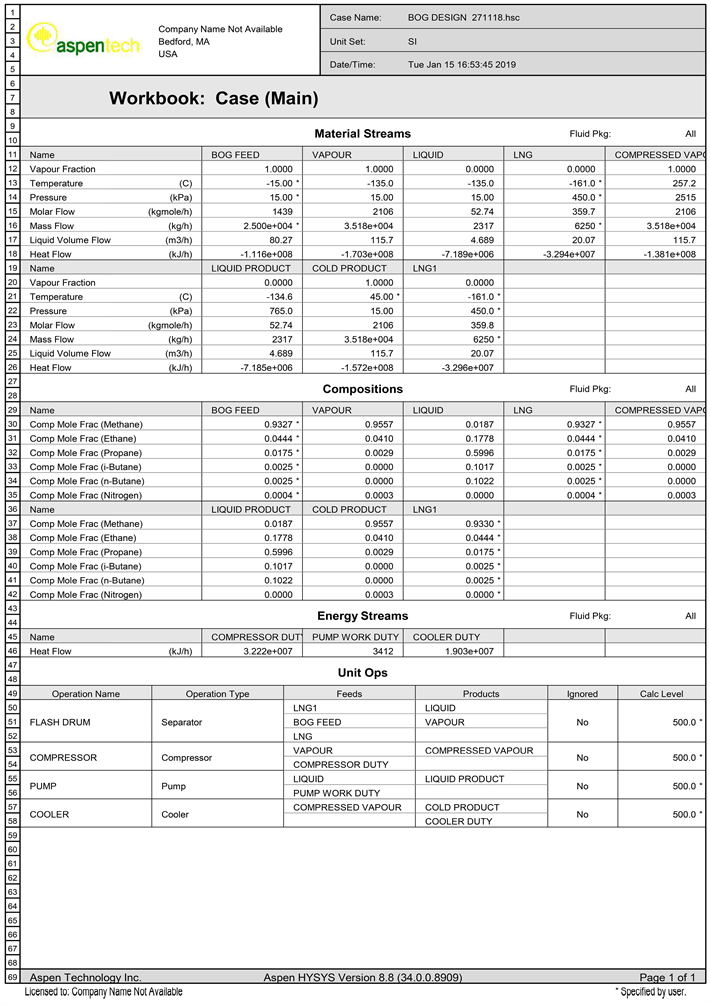
APPENDIX A
DATA SHEET RESULTS FOR THE SIMULATED TEMPERATURE (−15˚C).
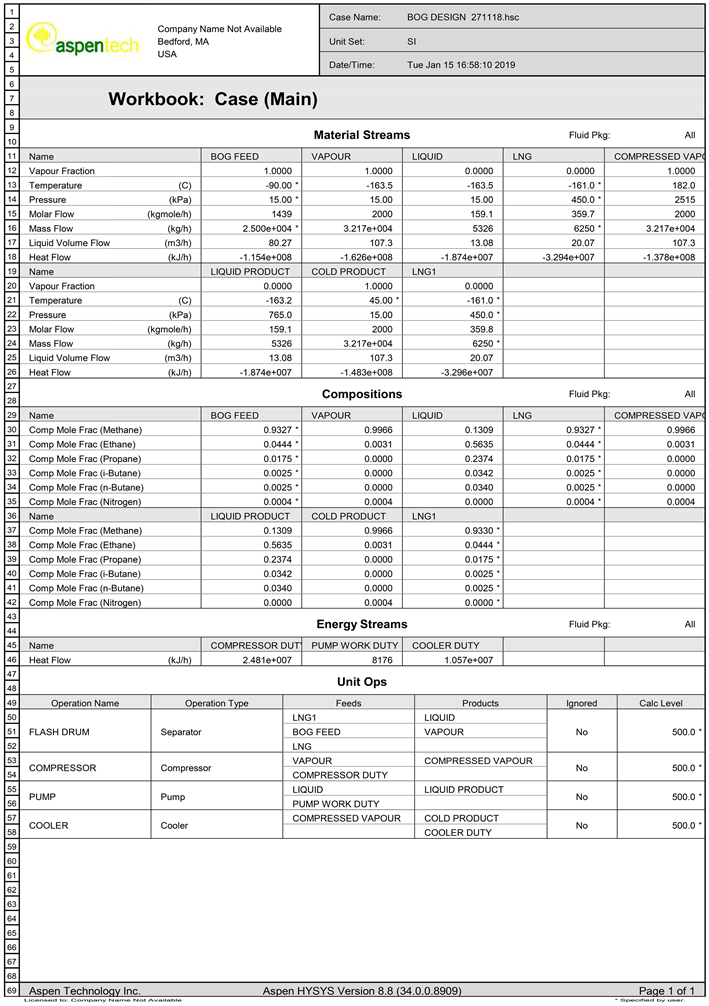
APPENDIX B
DATA SHEET RESULTS FOR THE SIMULATED TEMPERATURE (−90˚C).
APPENDIX C
DATA SHEET RESULTS FOR THE SIMULATED TEMPERATURE (−140˚C).
