On the Use of Benford’s Law to Detect JPEG Biometric Data Tampering ()
1. Introduction
1.1. Motivation for Tampered Biometric Modalities
Digital image manipulation is very common recently for different reasons such as digital image frauds, which include fingerprints replacement to doctor a fingerprint image [1] . Digital image tampering can be carried out easily with the help of digital processing tools such as Photoshop which are rampantly available [2] .
Manipulation of digital images include: 1) copy-paste manipulation which has an inserted region that is uncompressed, but the composite image is saved in a Joint Photographic Expert Group (JPEG) format; 2) copy-paste manipulation which has an inserted region that is compressed and the composite image is saved in JPEG format; and 3) inpainting manipulation of JPEG images [3] . Biometric databases contain biometric modalities such as face images, fingerprint images, and iris images amongst others [4] . Most of these modalities are digitally captured and saved in JPEG format [5] . These databases are often stored for backup purposes whereas a database of the derived features is used for operational purposes. However, it is not inconceivable that insider attackers have access to the backup copy of the database and carryout their manipulation. The field of biometrics has two major concerns which are sensor tampering [6] and database tampering [3] . Sensor tampering, which is also referred to as presentation attack [7] includes replay-attack and print-attack, which are all spoofing approaches to fool biometric sensors [6] . Database tampering includes splicing, copy/paste, inpainting and some pre-processing effects carried out maliciously on an authentic image [8] . Biometric systems are exposed to several attacks, but considering digital tampering, Ratha et al. [9] noted that, templates stored in the database maybe modified or removed, or new templates may be introduced in the database. This could cause authorization of a fraudulent individual, or denial of service for the legitimate person whose template sample is modified [9] . There are possibilities of digital tampering of JPEG biometric data posing several threats, such as introducing a False Rejection Rate (FRR) (where a biometric sample features in the database is digitally manipulated and an input biometric sample fails to be matched) or False Acceptance Rate (FAR) (where different features from a different biometric sample are introduce on another sample and the input biometric sample is incorrectly matched). Biometric data such as fingerprints and photographs are used by most countries to prevent identity fraud and help in tracing criminals. Even though, this biometric data tends to be very useful, a legitimate worker that has access to the data may handle such sensitive data wrongly or an insider attacker may illegally have access to this sensitive data. A case of nine million stolen and exposed Israelis’ biometric information shocked the world in 2006, which contained Israels primary national biometric database [10] . Therefore, there exist some real cases of digital tampering with biometric data in real world applications. It is therefore important to protect raw biometric samples against insider attacks and external hackers. By insider attack, we mean someone that maybe working with confidential biometric data, but may digitally manipulate such data.
Fingerprint and face modalities are very useful for identification and verification of individuals at the airports and secured places [4] . However, there are different fingerprints which maybe contact-less acquired latent fingerprints, optically acquired fingerprints and synthetic generated fingerprints, amongst others. These fingerprints are supposed to be used for different applications, but maybe intentionally or accidentally used in a different application which may pose a serious threat. For example, contact-less acquired latent fingerprints used in this study is meant to be used for research purposes in investigating crime scene forensics [11] , synthetic fingerprints is meant for research purposes for performance evaluation, training and testing fingerprint-based systems [12] and optically acquired fingerprints maybe used for a country’s biometric database.
Most research is carried out using face and fingerprints biometric modalities for verification, identification and as evidence in the court. People sometimes might tend to maliciously tamper with such biometric modalities either in the database or before presenting them as evidence to the court. Several but separate research efforts have been carried out on image tampering detection, face recognition in forensic scenarios amongst others, but to the best of our knowledge, research has not been carried out in verifying the integrity, authenticity and reliability of biometric modalities with the help of Benford’s law. Also, research has not been carried out on the use of Benford’s law divergence metric to differentiate between contact-less acquired latent fingerprints, optically acquired fingerprints and synthetically generated fingerprints.
Inspired by digital tampering of stored biometric fingerprints in databases and a possibility of intentional or accidental use of particular fingerprints instead of another fingerprint, we propose the use of Benford’s law to assist in detection of tampered biometric fingerprint images in biometric databases. Also, we propose the use of Benford’s law divergence to differentiate between artificially printed contact-less acquired latent fingerprints, optically acquired fingerprints and synthetically generated fingerprints.
1.2. Effectiveness of the Benford’s Law
In [5] we showed that biometric images followed the Benford’s law. The Benford’s law was coined by Frank Benford in 1938 [13] . It is also referred to as the first digit law or the law of “anomalous digits” which considers only the most significant digit (MSD) [13] . By MSD we mean 0.412 is 4 and 400 is also 4. This law states that the probability distribution of the first digit,
in a set of natural numbers is logarithmic [14] . Hill [15] described this law in the form of a logarithmic distribution, when considering the probability distribution of the first digit from 1 to 9 for a range of natural data [15] . It is observed that naturally generated data are supposed to obey this law whereas tampered or randomly guessed data are supposed to disobey this law [16] . Forensics literature has shown many applications of the Benford’s law such as in financial data [17] . This law works on the magnitude of the gradient of an image and also for the Laplacian pyramid code [18] . A great breakthrough of the use of Benford’s law on images can be seen where Gonzalez et al. [19] showed that images in the pixel domain did not follow the Benford’s law, but did observe that images when transformed to Discrete Cosine Transform (DCT) followed this law. Detection of hidden data in a natural image using the generalized Benford’s law was also carried out by them [19] . This law was used by Fu et al. [16] on DCT coefficients with the aim of detecting unknown JPEG compression. Qadir et al. [20] used the Benford’s law to identify unbalanced lighting in an image with the help of DWT [20] . The statistical features of the first digits of individual alternate current (AC) coefficients and SVM were used by Li et al. [3] to detect and locate the tampered regions in natural images. Farid [2] carried out a survey on image forgery detection techniques and explained how Benford’s law has been used to detect tampering in natural images. Iorliam et al. [5] showed that biometric data (face images and fingerprints images) follow the Benford’s law and a deviation from this could assist in detecting malicious tampering [5] . However, realistic tampering was not carried in [5] . Iorliam [21] recently applied the power laws (Benford’s law and Zipf’s law) to biometrics, forensics and network traffic analysis.
The key contributions in this paper include:
・ Use of Benford’s law features with SVM to protect the authenticity and integrity of biometric data in the DCT domain of JPEG compressed images.
・ Use of Benford’s law divergence to separate optically acquired fingerprints, artificially printed contact-less acquired latent fingerprints, and synthetically generated fingerprints.
2. Overview of Benford’s Law and Block-DCT Coefficients
2.1. Benford’s Law
A typical distribution of the Benford’s law can be seen in Figure 1. Therefore any data that closely follows this pattern follow the standard Benford’s law.
When considering the Most Significant Digit (MSD) where 0 is excluded, and the datasets satisfy the Benford’s law, then the law can be expressed as Equation (1) [15] .
![]()
Figure 1. Probability distribution of Benford’s law.
(1)
where x is the first digit of the number and
refers to the probability distribution of x.
The generalised Benford’s law which was described by Fu et al. [16] to closely follow a logarithmic law is defined in Equation (2).
(2)
where N is a normalisation factor which makes
a probability distribution. The model parameters in this case are represented by s and q which describe the distributions for different images and different compression QF’s as defined in [16] . The s and q are data-dependent and they are determined by the Matlab curve fitting tool box as used in [16] . As the QF reduces, the values of N, q, and s are numerically adjusted to fit to the generalized Benford’s law. It could be observed that when
, and
, the generalized Benford’s law reduces to the standard Benford’s law [16] .
2.2. Block-DCT Coefficients
The Benford’s law has been studied closely for the JPEG image compression [16] . The DCT is used to transform a signal or image from the spatial domain to the frequency domain. It is however noted that, the direct conversion of a 2D spatial function
into the 2D spectrum
of spatial frequencies and vice-versa does not lose any information from the signal or image [22] . When considering images, the 2D DCT is used because of the 2D signals of images. According to Fu et al. [16] , JPEG image compression is block-DCT based and has the 8 × 8 Block-DCT, Quantization and Entropy Coding. To achieve the first digits’ probability distribution based on the DCT, the partitioning of an original uncompressed image into a non-overlapped 8 × 8 pixel blocks is first performed. This process brings about the block-DCT coefficients. A 2D DCT is applied to each block in order to convert it to a frequency space. These results into 64 values, the value at the upper-left corner is referred to as the DC Coefficient and the other 63 values are referred to as the AC coefficients. The quantization table is therefore applied to each block of the DCT coefficients [22] . After this process, the JPEG coefficients are produced. We are therefore interested in studying the probability distribution of the first digits of AC component for the JPEG coefficients excluding the DC coefficient.
3. Experiments
The goal of the first experiment is to investigate the JPEG coefficients for the optical sensor acquired fingerprints images, artificially printed contact-less acquired latent fingerprint images and synthetic generated fingerprints to determine whether they follow the generalised Benford’s law. The second set of the experiment is to use the divergence metrics to show how the data samples used
for this experiments departs from the generalised Benford’s law. The third set of experiment is to detect and localize tampered fingerprint regions.
Equation (3) shows the divergence metrics [16] used in our experiment.
(3)
where
is the actual first digit probability of the JPEG coefficients of fingerprint images used in this experiments and
is the logarithmic law (generalized Benford’s law) as given in Equation (2). Figure 2, shows the experimental setup.
3.1. Data Sets
Three data sets were used for this experiment. The FVC2000 has four different data sets (DB1, DB2, DB3 and DB4) [23] . DB1 data set contains 80 gray-scale fingerprint images that are captured by low-cost optical sensor, while DB4 contains 80 gray-scale synthetic fingerprint images. DB1 and DB4 were used for our experiments. The third data set used was from contactless acquired computer generated and printed latent fingerprints [11] for our artificially printed contact-less acquired latent fingerprint images which are stored as gray-scale images with 32 bit colour depth.
3.2. Need to Separate Different Types of Fingerprints
Generally biometrics is used either for verification (1-to-1 matching) where we seek to answer the question “Is this person who they say they are?” or for identification (1-to-many (n) matching) where we seek to answer the question “Who is this person?” or “Who generated this biometric?” [24] . Fingerprints are used for identification or verification for over a century.
Even though, fingerprints are used for verification or identification, they are sometimes used for different applications. For instance, fingerprints captured using optical sensors maybe used for collecting a country’s biometric fingerprint database, where as synthetic generated fingerprints are used for testing fingerprint recognition algorithms which require large databases and collecting real fingerprints for such large databases is very expensive, boring and problematic [12] . The contact-less acquired latent fingerprints were generated for evaluation and research purposes with the aim of avoiding privacy implications [11] . The fingerprints generated by Hildebrandt et al. [11] are different from synthetically generated fingerprints in that, the synthetically generated datasets by SFinGe [12] are printed using a Canon Pixma iP4950 ink-jet printer with artificial sweat [11] .
We are therefore interested in applying the Benford’s law on these three data sets and to investigate:
1) If they all follow the generalised Benford’s law.
2) If the Benford’s law divergence can assist in separating them.
3.3. Results for Generalised Benford’s Law
The first digit distribution of JPEG coefficients for optically acquired fingerprints, artificially printed contact-less acquired latent fingerprints and synthetically generated fingerprints are investigated. These three databases were JPEG compressed at a QF of 50 to 100 in a step of 10 to achieve the JPEG coefficients. The mean distribution of the first digits of the JPEG coefficients on the three databases was performed.
We observe that the JPEG coefficients of the optically acquired fingerprints and synthetically generated fingerprints closely followed the generalized Benford’s law based on a Quality Factor (QF) of 100, N = 1.456, q = 1.47, and s = 0.0372 as shown in Figure 3(a), and in Figure 3(c), respectively. However, artificially printed contact-less acquired latent fingerprints follow generalized Benford’s law at QF = 100 except at digit 1 as seen in Figure 3(b). This might be caused due to the conversations on the data sets. In our future work, an investigation will be carried out in this direction. A QF = 100 was used because this QF produces the best image quality when compared with other QFs. The plots also showed the standard Benford’s law (in blue) for comparison. The divergence of 0.0014, 0.04 and 0.002 were obtained for QF = 100 for the optically acquired fingerprints, artificially printed contact-less acquired latent fingerprints, and synthetically generated fingerprints respectively. It was however noted that, optically acquired fingerprints and synthetically generated fingerprints showed a better fitting as compared to artificially printed contact-less acquired latent fingerprints when using the model parameters as used in [16] . Other QFs were also found to give a fitting that follows this pattern. This process requires tuning of distribution parameters such as N, s, and q. These can be done using an external, unrelated data set [16] . We used the UCID [25] data sets for this purpose.
In order to separate these three databases, the divergence metric is studied in more details in the next section.
3.4. Divergence Metric and Separability of the Three Databases
The divergence metrics is used to show how close or far a particular data set is, either with the standard or generalised Benford’s law. In all cases, a smaller divergence gives a better fitting. In our experiment, the three databases were singly compressed at a QF of 50 to 100 in a step of 10. The divergence was calculated as an average on all the data sets as can be seen in Figure 4.
![]()
Figure 3. JPEG coefficients of: (a) optically acquired fingerprints closely follow generalized Benford’s law at QF = 100; (b) artificially printed contact-less acquired latent fingerprints follow generalized Benford’s law at QF = 100 except at digit 1; (c) JPEG converted, synthetically generated fingerprints closely follow generalized Benford’s law at QF = 100.
![]()
Figure 4. Box plot of the divergence for singly compressed optically captured fingerprints (left), synthetically generated fingerprints (center) and contact-less acquired latent fingerprints (right) for a QF = 50 to 100 in step of 10.
![]()
Table 1. Median Values of the individual databases at QF from 50 to 100 in a step of 10.
The box plot in Figure 4 clearly shows that optically captured fingerprints, synthetically generated fingerprints and contact-less acquired fingerprints divergence at different QF’s from 50 to 100 in step of 10 are not the same. We therefore investigate the median values at the individual QF’s as can be seen in Table 1.
Considering Figure 4 and Table 1, it was observed that even though the optically acquired fingerprints and synthetically generated fingerprints divergence box plot at different compressions almost followed the same pattern, the corresponding median values were different. It was however observed that, the contact-less acquired fingerprints divergence values at the different compressions differed both in the pattern and median values as compared to the other two databases.
4. Tamper Detection Using the Benford’s Law Features
In [5] , we showed that biometric images (face images and fingerprint images) closely followed the Benford’s law. However, in Section 3.4 we showed that different types of fingerprints behave differently when analysed using the Benford’s law. Doubly compressed images at different QF’s violates a logarithmic pattern where as singly compressed images follows a logarithmic pattern [26] . This property is used when detecting tampering in natural images. The technique works under the hypothesis that a tampered region has undergone a single JPEG compression and an un-tampered region has undergone a double JPEG compression [3] . An example of this property can be seen in Figure 5 where the first digits distribution of singly compressed fingerprints at
follows the logarithmic law whereas the doubly compressed fingerprints at
and
violates the logarithmic law.
The most-based first digit features (MBFDF) are used to detect tampered regions in natural images [3] . However, it has not been performed on biometric data. Hence, we conduct experiments on tampered fingerprints which are one of the biometric modalities. The tampering was performed mainly using a copy/paste approach and some little modification to make sure the tampered regions are not visible to the eyes. Eighty fingerprint images from DB1 were digitally tampered by copying the center part of a different fingerprint and pasting on the center part of another fingerprint. At the end of the manipulation, com-
![]()
Figure 5. First digits distribution of singly compressed fingerprints at
follows the logarithmic law and doubly compressed fingerprints at
and
violates the logarithmic law.
![]()
Figure 6. Fingerprint image: (a) JPEG compressed at QF = 80, (b) JPEG compressed at QF = 50, (c) center portion of (b) replaced with center portion from (a).
posite JPEG fingerprint images were produced. Figure 6 shows some sample images for our experiment. In this work, we extend this approach to the use of Benford’s law features with the help of two class support vector machine (SVM) as proposed by Li et al. [3] to detect tampering of biometric fingerprint images.
One thousand randomly selected natural images were singly JPEG compressed (which are usually uncompressed images from UCID [25] ) and double JPEG compression of the same images was performed. Single JPEG compression was carried out using
to 90 in a step of 10 and double JPEG compression was carried out using
to 75 in a step of 10 and
to 90 in a step of 10. The first digits’ probability distribution of the top 20 AC modes for the singly JPEG compressed data and doubly JPEG compressed data was performed as proposed by Li et al. [26] . The MBFDF features are used to train a two-class SVM. We however, used tampered fingerprint images for testing, which were divided into continuous non-overlapping
pixel blocks. For each block of the biometric fingerprint image, a sub-image of size
blocks was taken, where n = 0, 1, 2 and the first digits probability distribution of JPEG coefficients of the first i AC modes for each of the sub-image are used as feature vector which has a dimension of
to determine if such sub-image has been manipulated or not with the help of SVM. In this experiment n was set to 2 and i was set to 20 to detect the tampered regions on the tampered fingerprints as learnt from experiments performed by Li et al. [3] . The detection results can be seen in Figures 7(a)-(f), where the tampered regions are identified as white regions and the untampered regions are identified as black regions. Figure 7(g) & Figure 7(h) shows the detection results for un- tampered JPEG fingerprints.
5. Estimation of Block-Level Tampering and Densities
When a biometric fingerprint is tampered, some blocks are tampered, while
![]()
Figure 7. Detection of: (a) uncompressed fingerprint (.tif) inserted into a compressed fingerprint (QF = 50) and the composite fingerprint saved at a QF = 70; (b) uncompressed fingerprint (.tif) inserted into a compressed fingerprint (QF = 60) and the composite fingerprint saved at a QF = 75; (c) compressed fingerprint (QF = 80) inserted into a compressed fingerprint (QF = 50) and the composite fingerprint saved at a QF = 70; (d) compressed fingerprint (QF = 50) inserted into a compressed fingerprint (QF = 70) and the composite fingerprint saved at a QF = 70; (e) compressed fingerprint (QF = 60) inserted into a compressed fingerprint (QF = 75) and the composite fingerprint saved at a QF = 75; (f) uncompressed fingerprint (.tif) inserted into a compressed fingerprint (QF = 80) and the composite fingerprint saved at a QF = 70. ((g), (h)) un-tampered JPEG fingerprints. Each square represents a
block.

other blocks are not. We therefore propose a method to detect the number of tampered blocks and also estimate the densities of tampered and un-tampered blocks. This is to illustrate exactly where a biometric sample is tampered, taking into consideration a corresponding un-tampered biometric sample.
The main steps are as follows:
1) Load an un-tampered and a corresponding tampered image which are both in JPEG format.
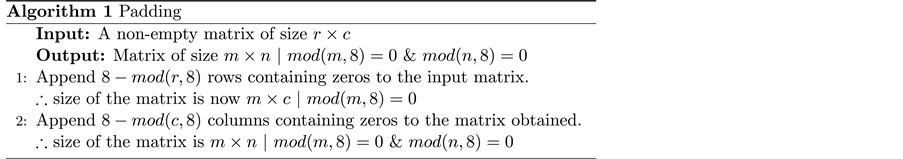
2) Pad the matrices using Algorithm 1, to avoid un-equal blocks in order to achieve rows and columns that are divisible by 8.
3) Divide the individual biometric fingerprint images into non-overlapping
blocks.
4) To avoid cropping effects at the edges of the biometric fingerprint images, mask each of the biometric fingerprint images at edges using Algorithm 2.
5) With the help of thresholding on the tampered image, get the number of tampered and un-tampered regions.
6) Feed the tampered and un-tampered regions into the Weighted Error Rate (WER) [27] software to estimate their densities based on the classifier output as observations.
To test the above algorithm, an experiment was performed on 80 tampered and un-tampered fingerprint images and the tampering was concentrated at the center.
6. Results for Performance Evaluation
In order to measure the performance of how the tampered fingerprint blocks were discriminated from the un-tampered ones, the kernel density estimation technique was used to first estimate the probability density function (pdf) [28] . It was used because of two advantages: first, the modeled distribution is smooth (unlike histogram); and second, the method is non-parametric, thus does not engage in any assumption about the form of distribution of the data. Hence, it was used to compare two densities. Figure 8 shows the block-level distributions of tampered and un-tampered blocks of the fingerprints, and Figure 9 shows the DET curve of the block-level tampering detection algorithm on 80 fingerprint images. The EER point is highlighted by a red mark in the DET curve as shown in Figure 9.
To assess how the above algorithm is effective in discriminating tampered fingerprints from un-tampered fingerprints, the DET curve was used. Usually, the DET curve shows the False Rejection Rate (FRR) versus False Acceptance Rate (FAR) as a plot which is in the inverse of the standard normal deviates scales [29] . Using the tampered regions as the reference, which is the target class to be detected, their respective definitions are:
The DET curve is usually a plot of FRR in the y-axis versus FAR in the x-axis by varying the decision threshold such that:
![]()
Figure 8. Block-level distributions of tampered and un-tampered blocks of the fingerprints.
![]()
Figure 9. DET curve of the block-level tampering detection algorithm on 80 fingerprint images.
It is an established fact that a smaller FAR and FRR values are desirable. Therefore, it is expected that a DET curve for a good detection system should usually be aligned closer to the origin (lower left corner) of a DET curve. Furthermore, an EER is a unique operating point where FAR=FRR. This summa- rises the entire DET curve and is considered as a useful metric for biometric evaluation. An EER of 2.08% was achieved using the block-level tampering algorithm. It is an established fact that a lower EER is better and as such an EER of 2.08% is considered low.
7. Discussion
We have investigated two different methods: Benford’s law divergence without training and Benford’s law features with training via SVM.
Benford’s law divergence without training is a passive (blind) detection method [3] which does not require prior knowledge about the image under investigation. This is really advantageous to our research because, in most cases, we may not have prior knowledge about the biometric fingerprint we wish to separate. Therefore the use of active detection method [3] which requires prior information to be embedded into an original image will not be helpful. Even without training, the Benford’s law divergence for singly compressed optically acquired fingerprints, synthetically generated fingerprints and contact-less acquired latent fingerprints for a QF = 50 to 100 in step of 10 with corresponding values of N, s and q used during our experiments as learnt from [16] can distinguish the three classes of fingerprints under investigation, namely, optically acquired fingerprints, artificially printed contact-less acquired latent fingerprints and synthetically generated fingerprints.
The Benford’s law features when used in conjunction with an SVM classifier, can effectively detect and localize tampering. We find that, the Benford’s law features and SVM classifier can detect tampering effectively, with Equal Error Rate (EER) of 2.08 %. The EER was found to be low, therefore indicating a higher degree of separability.
The advantage of being able to detect tampering means that one can deploy Benford’s law in protecting against insider attacks and hackers on manipulating raw images stored in biometric databases.
8. Conclusion and Future Work
The authenticity of biometric databases is exposed to a great threat due to digital tampering of JPEG biometric data. In this paper, digital tampering of biometric fingerprint images was performed using Photoshop to demonstrate how simple an attacker can digitally manipulate such data. We proposed the use of Benford’s law divergence metric to assist in separating three databases. We showed that the Benford’s law features with SVM can greatly assist in protecting the authenticity and integrity of biometric fingerprint databases. In our future work, we will investigate detection of tampered biometric face image and iris images regions. Also, we will investigate if digital tampering negatively affects the recognition performance on digitally tampered face and fingerprint images. Furthermore, the applicability of Benford’s law will be investigated for 16/32-bit images. Moreover, for forensic applications, a lossless compression should be investigated in details. This will also be covered in our future work. Lastly, we will investigate raw data manipulations in the full colour-depth and their impact on the DCT coefficients after the JPEG transformation.
Acknowledgements
Sincere thanks to Prof. Anthony T.S. Ho, Dr. Norman Poh, Dr. Santosh Tirunagari, Mrs Nik Suki, Prof. Jana Dittmann and Dr. Mario Hildebrandt for their useful inputs into this work. This paper is part of Iorliam’s PhD research [21] at the University of Surrey, UK.