Conditions of Non-Unique Identifiers in Record Linkage Using Japanese Cohort Dataset ()
1. Introduction
Recent information technology enables us to handle a considerably large amount and variety of data at high velocities [1] . Taking advantage of this, it will be beneficial, from statistical point of view, to access and handle such accumulated large amount of datasets and use them as information in which we find. In epidemiology, cohort study is one way to identify chronological pattern and effect of health and disease conditions. However, in order to enhance the quality of dataset more, it is essential to merge and link different datasets.
Typically, personal information such as name, address, race and sex are required to link different datasets [2] . However, since Act on the Protection of Personal Information, personal information is not allowed to utilize even for statistical purposes and it has been limited only to handle analytical dataset. In North America, Social Security Number (so called “SSN”) is commonly used to identify individuals whereas hash-function ID is adopted in Japan [3] -[5] . However, Winkler mentioned that SSN was not a secure identifier because it would verify personal information under certain conditions [6] . On the other hand, the hash function using Japan National Database was not successful in making links in record, which resulted only about 15% of expected charges for a linkage [4] .
An objective of record linkage process is to identify observations on each file that corresponds to the same individual [7] . In this sense, it is crucial to test and find which non-unique identifiers are more effective to link different datasets. Therefore, we have conducted a primary experiment with Japanese cohort study to link cohort datasets in different years by using selected variables and to investigate how accurate the record linkages can be achieved without any access to personal information.
2. Population
The Suita study, a prospective population-based cohort study in an urban area of Japan, started in 1989. The details of this study have been described elsewhere [8] -[11] . In brief, participants between the ages of 30 and 84 years old were randomly selected from the municipality population registry in 1989. The subjects have continued to visit National Cerebral and Cardiovascular Center (NCVC) every two years for a regular health checkup. This cohort study was approved by the Institutional Review Board of the National Cerebral and Cardiovascular Center.
3. Methods
Figure 1 shows the explanation of baseline of 1989-1991 dataset for a linkage. In this study, the first three years (1989-1991) are considered as baseline with 4,172 (1,984 men and 2,188 women) to link the dataset in 1992 with 3,063 (1,485 men and 1,578 women). The number of matched observations in two datasets is 1,491 (727 men and 764 women) for three-year baseline dataset. Similarly, baseline of ten-year (1989-1999) is considered with 8,268 (3,939 men and 4,329 women) to link the dataset in 2000-2009 with 5,047 (2,343 men and 2,704 women) for a linkage. The number of matched observations in two datasets is 4,955 (2,310 men and 2,645 women). For each dataset, the first observation in ascending order of diagnosis date was selected as a subject of this present study if participants were duplicated.
The non-unique identifiers selected to test for a linkage are height, weight, waist, age, sex, smoking habit and drinking habit. Furthermore, since this is a cohort study dataset, the measured values of those identifiers could be changed with duration. Therefore, we have applied the probabilistic record linkage [12] -[14] with an equal weight for the matched and non-matched by using Cartesian product method [15] to analyze which non-unique identifiers are more significant and influential in terms of the cohort study dataset. To explain what the Cartesian product is, if the set A and set B exists, then the final linkage dataset includes the set of all ordered pairs (a, b) where aÎA and bÎB.
![]()
Figure 1. Explanation of three-year baseline dataset for a linkage.
Table 1 shows the linkage conditions for identifiers. At first, we have set a variable of age within 2 year for three-year baseline dataset because regular health checkup was conducted every two-year cycle. For ten-year baseline dataset, the measurement time interval is different for each participant who linked two datasets i.e. some participant may have visited NCVC in 1990 and 2000 (time-interval of 10 years) or others may have visited NCVC in 1990 and 2006 (time-interval of 16 years) because they had not gone to the checkup between 2000 and 2005. Thus, we calculated the measurement time interval for linked participants by using the date of diagnosis, and then added it to baseline age.
As further linkage conditions, we have set height as a variable to be matched within ±5 cm from baseline measurement. Likewise, we have set weight and waist as variables within ±10 cm from baseline measurement since weight or waist could fluctuate with more ease than other variables. In addition, we have included the identifiers of weight/height/waist with 5 cm additional increments as an adjustment.
Furthermore, we have consider the three cases for drinking/smoking habit as marginally linked because the status of drinking/smoking habit of participants may have changed over the years: 1) From “Drink/Smoke” to “Quit” i.e. they were drinking/smoking in baseline but decided to quit; 2) From “No Drink/No Smoke” to “Drink/Smoke” i.e. they had not been drinking/smoking in baseline but started to drink/smoke; and 3) From “No Drink/No Smoke” to “Quit” i.e. they had not been drinking/smoking in baseline and started to drink/smoke but decided to quit by the time of next diagnosis.
At last, in order to verify whether paired observation is matched/linked, unified program ID is used.
4. Statistical Analysis
The present study performs descriptive data analysis (sensitivity, specificity and accuracy) [16] -[18] , and then compares the different combinations with various adjustments of identifiers. Table 2 shows a two-by-two table of linked/non-linked status by matches/no matches status. When a paired observation is linked when it was in fact a match, then it is called True Positive (TP). When a paired observation is linked when it was not in fact a match, then it is called False Positive (FP). When a paired observation is not linked when it was in fact a match, then it is called False Negative (FN). And, when a paired observation is not linked when it was not in fact a match, then it is called True Negative (TN). Then, sensitivity is defined as the proportion of being linked paired observation given that it was matched paired observations. Specificity is defined as the proportion of being no-linked paired observation given that it was no-matched paired observations. At last, accuracy is defined as the proportion of being correct paired linkage out of all paired observations. They are also described in term of TP, FP, and FN, TN as following.


As a threshold, we choose the score greater than matched score of the simplest combination (age + sex). All
![]()
Table 1. Conditions of identifiers for linkage.
![]()
Table 2. Two-by-two table of linked/non-linked status by matches/no matches status.
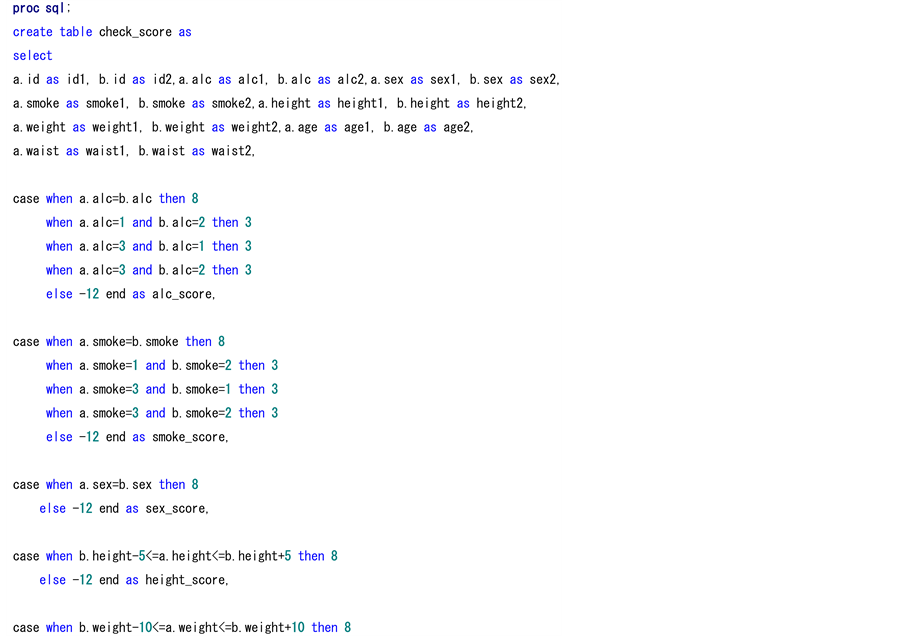
analyses are carried out using SAS 9.3 (SAS Institute, Cary, NC, USA). As described in Figure 1, we first merged datasets in different years by unified program ID to combine as one dataset. At the time, duplicated observations were deleted using first function in SAS. Then, SQL program shown in Appendix 1 was used to calculate matching score for combination with variables. Appendix 1 describes the complete program in all identifiers with possible cases. When we need to calculate the combination of age and sex, we only require those cases in Appendix 1. After calculating the matching score, we use the threshold to distinguish between the assumed linked paired observation and no linked paired observation. Then, we sorted out the matched paired observations using unified program ID before estimating sensitivity, specificity and accuracy.
5. Results
Table 3 shows the sensitivity, specificity and accuracy of all combinations with identifiers in descending order of specificity and sensitivity for three-year baseline linkage. The reason of descending order with specificity first, not sensitivity is because the present study conducted with Cartesian product method. Therefore, how much the combination with identifiers detects the numbers of TN is important for accurate linkage.
From the result, the combination of (age + sex + weight + height + waist) estimated the worst value out of all combinations. All sensitivity in the combination of (age + sex + weight + height + waist) was 87.93%, which detected more FN since it was the lowest value (95.19% in men and 91.89% in women).
The combination of (age + sex) was the simplest and sensitivity in men (99.72%) and women (99.48%) was fairly high. However, the combination detected many FP, which decreased its specificity. The combination of incremented identifiers did not estimate the specificity well because of same reason. That is, broadening the range of identifiers surely estimates more sensitivity but less specificity.
In addition, sensitivity and specificity for both (age + sex + weight) and (age + sex + height) were relatively similar. On the other hand, sensitivity and specificity for (age + sex + waist) were lower than the other two combinations in both men and women. Also, focusing on women’s sensitivity, compared to height (98.82%) and weight (99.34%), waist (81.54%) decreased more than 10% of detection. That is, waist tends to fluctuate more over the time, especially in women.
For smoking status, sensitivity in the combination with cases in men (92.57%) and women (92.67%) was higher than the one without cases in men (86.8%) and women (90.71%). However, the specificity of smoking status without cases was higher in both men (97.47% for smoke only vs. 95.49% for smoke with cases) and women (95.41% for smoke only vs. 94.59% for smoke with cases). The trend was similar with drinking status. Therefore, smoking/drinking status with cases estimated TP fairly well and dichotomous question such as “smoking/drinking” or “No smoking/No drinking” may have increased more numbers of TN.
Overall, considering the balance of sensitivity and specificity in both men and women, either the combination of (age+ sex + weight + height), the combination of (age + sex + height) or the combination of (age + sex + weight) should be nominated as the best valid combination. Since both sensitivity and specificity in all combinations are similar, we conclude the combination with highest accuracy, that is, the combination of (age + sex + weight + height) is the most suitable and valid identifiers to link two datasets for three-year baseline study.
Table 4 shows the sensitivity, specificity and accuracy of all combinations with identifiers in descending order of specificity and sensitivity for ten-year baseline linkage. Compared to Table 3, more clear results regarding to characteristic of identifiers have been conducted.
Similarly, the combination of (age + sex + weight + height + waist) was the worst value out of all combinations. But, in Table 4, instead of sensitivity, specificity was the lowest value in both men (77.37%) and women (77.99%). Even though the combination increased sensitivity, the number of FP was also increased. The combination of incremented identifiers was similar with Table 3 as well.
For smoking status, the sensitivity in the combination with cases in men (95.37%) and women (98.41%) was higher than the one without cases in men (73.38%) and women (94.18%). Compared to the men’s sensitivity
![]()
Table 3. Results of sensitivity, specificity and accuracy of all combinations with identifiers in descending order of specificity and sensitivity in three-year baseline linkage.
![]()
Table 4. Results of sensitivity, specificity and accuracy of all combinations with identifiers in descending order of specificity and sensitivity in ten-year baseline linkage.
(86.8%) in Table 3, the detection did decrease more than 10% in men. Equivalently, the sensitivity of drinking status in men decreased about 5% (from 87.21% in three-year baseline to 82.86% in ten-year baseline).
Overall, considering the balance of sensitivity and specificity in both men and women, either the combination of (age + sex + weight + height), the combination of (age + sex + height) or the combination of (age + sex + weight) should be nominated again as the best combination. Even though specificity is similar for all combinations, the sensitivity of the combination of (age + sex + height) was higher than other combinations in both men and women. Therefore, for ten-year baseline study, we conclude that the combination of (age + sex + height) is the best identifiers to link two dataset.
6. Discussion
We have conducted the probabilistic record linkage study by using Japanese cohort dataset to observe the conditions of different identifiers. The descriptive results show the combination of age, sex, weight and height is the best identifiers for three-year baseline, whereas the combination of age, sex and height is the best identifiers for ten-year baseline. To the best of our knowledge, this study is the primary experiment by using non-unique identifiers with Japanese cohort study to link two distinct longitudinal datasets.
A previous study of hospital records linkage had reported that using individual identifier (birth year, gender and initial of first name) estimated almost identical with the personal health identification number [19] . Furthermore, another research reported the linkage between the AIDS dataset in New York State Department of Health and the Statewide Planning and Research Cooperative System record for each study year in 1987 and 1988. The sensitivity of using total identifiers (hospital identification code, data of hospitalization, birth date, sex, surname, street name, county of residence and Zip code) was 81.9% in 1987 and 84.7% in 1988. However, the sensitivity of using the identifiers of only birth date and sex is 81.7% in 1987 and 84.3% in 1988, which could predict fairly similar with the one using total identifiers [20] . Other linkage research was to determine the proportion of persons receiving Public Health Nursing Services (n = 5,749) who also received income assistance from region (n = 38,800) or the province (n = 16,741) comparing with three different models. The authors claimed that birth date was one of the most important identifiers to discriminate potential matches [21] . Therefore, the variable of (age + sex) was essential identifiers for a linkage procedure.
Furthermore, we have selected the variable of (height + weight) as one of the best linkage identifiers. The interpretation of choosing two variables can be explained in terms of epidemiological view. The formula of (weight (kg) ÷ height (m)2) calculates Body Mass Index (BMI), which is well-known measurement to determine obesity. The research with dataset from the Japan Public Health Center Study, which includes a total of 65,095 Japanese aged between 40 and 69 years at baseline has shown that over 10-year follow-up, BMI increases less than 1.0 kg/m2 among 40 - 49 years old and decreases by a similar amount among those 55 and older at baseline [22] [23] . Besides, the First National Health and Nutrition Examination Survey Epidemiologic Follow-up Study has shown mean 10-year change in BMI among men and women by age [24] . They have reported that mean BMI increases less than 1.0 kg/m2 among 25 - 54 years old in men and less than 1.3 kg/m2 among 25 - 54 years old in women. After the age of 55 or older, the mean BMI decreases for both men and women. The mean BMI among 65 - 74 years old in men and women was −1.1 kg/m2 and −1.7 kg/m2, respectively. Therefore, the increases in BMI over the time are relatively small and (height + weight) is good identifiers for a linkage procedure.
However, in ten-year baseline dataset, we have chosen the combination of (age + sex + height), not the combination of (age + sex + height + weight). This may be explained by the characteristic of our cohort dataset. Mean age of dataset in 2000-2009 for paired observation was 70.14 years old with oldest age of 96 years old in men and 68.16 years old with oldest age of 97 years old in women. In Table 4, specificity of the combination of (age + sex + weight + height) and the combination of (age + sex + height) in both sexes was similar. The main difference between two combinations was the sensitivity. That is, compared with variation of height, the variation of (weight + height) was causing less number of TP and more number of FN. In order to explain the reason, we calculated the difference of height, weight and waist between the baseline and dataset in 2000-2009.
Table 5 shows a median value with the interquartile range (IQR) of height, weight and waist difference by sex. Table 5(a) shows difference between baseline (1989-1991) and dataset in 1992. Table 5(b) shows the difference between baseline (1989-1999) and dataset in 2000-2009. The IQR range here explains how different the variable is for individual paired observation between baseline and dataset we linked.
(a) ![]() (b)
(b) ![]()
Table 5. Difference of height, weight and waist in two dataset. (a) Between baseline (1989-1991) and dataset in 1992; (b) Between baseline (1989-1999) and dataset in 2000-2009.
IQR: Interquartile range = 75% quartile −25% quartile.
In Table 5(a), the IQR range of height difference in both men and women was 1.0 - 0.0 cm which explains there was only 1.0 cm individual variation of height for paired observation between baseline and dataset in 1992. The IQR range of weight difference in both men and women was 2.6 - 0.8 cm and 2.3 - 0.6 cm, respectively. The IQR range of waist difference in both men and women was 5.0 - 1.0 cm and 9.0 - 2.0 cm, respectively. The range of waist difference was bigger than other two variables. Therefore, matched paired observations would be chosen as non-linked using an identifier of weight, which increases the number of FN which decreases the sensitivity.
In Table 5(b), the IQR range of height difference in both men and women was 1.2 - 0.2 cm and 1.6 - 0.3 cm, about 1.0 - 1.3 cm individual variation for a paired observation. However, the IQR range of weight difference in both men and women was 5.1 - 1.2 cm and 4.4 - 1.0 cm, respectively, which is bigger individual variation than weight difference in Table 5(a). That is why the sensitivity of the combination of (age + sex + weight + height) was smaller than the combination of (age + sex + height).
Consequently, if the proportion in one cohort dataset includes the elderly more, then BMI in linking dataset typically decreases and individual variation of weight may not be small. Thus, the combination of age, sex and height is the best estimation to link two datasets. However, if two cohort datasets focus on similar age classification, then the combination of age, sex, weight and height would predict the best estimation to link.
In conclusion, the combination of age, sex, weight and height was the best identifiers for three-year baseline whereas the combination of age, sex and height was the best identifiers for ten-year baseline. Though this study was initial and preliminary, the results had suggested potential solid application of non-unique identifiers to make valid predictions in terms of sensitivity, specificity and accuracy of datasets. While protection of personal information have been growing increasingly important in our society, effective and sound utilization of vast amounts of information accumulated thanks to current information technology must be promoted. In this perspective, further study of non-unique identifiers is necessary.
Acknowledgements
We deeply appreciate the comments and suggestions given by two anonymous reviewers which improved this manuscript significantly.
Appendix 1: The SAS Program in Probabilistic Algorithm in Record Linkage for Three-Year Baseline