Analysis of the Impact of Different PEV Battery Chargers during Faults ()
1. Introduction
Many countries in the world rely on imports to satisfy their petroleum needs. Heavy reliance of the transportation sector on petroleum-based fuel is a matter of concern for most of the world governments. These concerns are mainly associated with:
1) Rising level of carbon dioxide in the atmosphere which is considered a contributor to global warming and climate change.
2) Threat to energy security due to dependence on a fuel source controlled by a different entity or government.
3) Rising cost of petroleum which has a tremendous negative impact on the economy.
The Energy Independence and Security Act of 2007 as well as the Energy Improvement and Extension Act of 2008 reflect the inclinations of the political faction of the USA to alter the energy consumption pattern away from petroleum [1] . Developing alternative fuel sources for vehicles is a step in that direction. Electric propulsion technology used by PEVs has gained ground in recent times. Battery Electric Vehicles (BEVs), Plug-In Hybrid Electric Vehicles (PHEVs), and Extended Range Electric Vehicles (EREVs), which all have the capability to be charged from the distribution system, come under the gamut of PEVs. The entire energy requirement for BEVs is satisfied by its large battery pack alone, while PHEVs and EREVs rely on gasoline as well as a battery pack to meet their energy needs [2] . Almost every major automobile manufacturer has a PEV on road or plans to have one in the near future [1] . One of the biggest constraining factors thwarting the large scale adoption of the PEVs is their high cost. The high cost is mainly associated with the battery pack which is an integral component of PEVs. Breakthroughs in battery technology may have positive impacts on the PEV market [3] .
Though PEVs provide solutions to the concern associated with petroleum-based fuel, a high penetration of the PEVs will pose different kinds of challenges to the electric utility industry. In terms of load, PEVs will have a very different characteristic and utilities will have to devise methodologies to adapt their system to it. On the other hand, the capability of PEVs as a source of distributed generation and energy storage can be used by the utility industry for regulation services and as an enabler for high penetration of intermittent renewable energy sources. Considerable amount of research has already been done to study the impacts of PEVs on the electric grid and concocting methodologies to alleviate them. In [4] , the aggregated load profile of PHEVs based on the data from National Household Travel Survey (NHTS), All Electric Range (AER) of PHEVs and its charging level are analyzed. Based on the analysis, different smart charging policies are suggested to shift the peak of the load profile to a desirable time of the day. Research has also focused on studying the impact of PEVs on the assets of the distribution system. Distribution transformers are considered critical assets in a distribution system. Estimating the remaining life of a transformer is useful for the reliability and planning of the system. Aging of a transformer is mainly associated with degradation of its insulation, which is very sensitive to the temperature. In [5] , the hot spot temperature in the transformer is estimated using NHTS data and the IEEE standard dynamic thermal model. It concludes that with PEVs in the system, ambient temperature plays a critical role in accelerated aging of a transformer and that some of the proposed smart charging algorithms may actually have an adverse effect on its life. Research in the domain of PEVs has also focused on developing smart charging algorithms to minimize losses and investment costs in distribution systems [6] [7] and to optimally utilize PEVs for regulation and ancillary services [8] [9] .
Faults on a distribution system are a common phenomenon and it being a Single Line to Ground (SLG) fault has the highest probability. Work done in the domain of analyzing the impacts which PEVs in a smart car park may have on the unbalanced distribution system during faults is limited. In this paper a smart car park of PEVs in the IEEE 13 Node Test Feeder is simulated. A SLG fault with auto-reclosure operation is created and the response of the smart car park, in terms of impacts on system voltages, currents and power flows is analyzed. In this study, a high-magnitude switching voltage, which would negatively impact the grid, is observed during the time when the recloser of the faulted phase is open and the fault on the system has been cleared. This highmagnitude switching voltage may cause severe damage to the insulation and the equipments installed in the distribution system. Extra control logic in the control of the battery chargers of PEVs is added to isolate the vehicles from the system during fault and fault recovery to mitigate the problem of this high-magnitude switching voltage. The rest of the paper is organized in the following manner. Detailed modeling of the battery charging system of PEVs is explained in Section 2. Section 3 gives an overview of the IEEE 13 Node Test Feeder and details regarding the fault analysis performed. Section 4 analyzes the impacts which PEVs have on the system during a fault and explains the methodology used to mitigate them. Conclusions from the studies are discussed in Section 5, and future work is described in Section 6.
2. Battery Charging System
The equipment that forms the link between PEVs and the electric grid is the Battery Charging System (BCS). A BCS is mainly comprised of the battery and power electronic converters. Power electronic converters enable the battery to be charged from the grid as per its specific requirements.
Lithium-ion (Li-ion) batteries are expected to be used for energy storage for the coming generation of PEVs [10] . Constant Current (CC) and Constant Voltage (CV) charging is the most common charging profile used for Li-ion batteries [10] . Li-ion batteries with Lithium-Iron-Phosphate (LFP) cathode composition find wider usage for automotive applications [10] . In the case of LFP, CC charging consumes 75% of the total charging time [10] . A typical CC-CV characteristic of an LFP cell is shown in Figure 1. Since the State Of Charge (SOC) of the battery remains almost constant during a short time period, only constant current charging is considered.
The different charging methods in North America are shown in Table 1 [11] . Due to its standardization and higher charging speed than AC Level 1, an AC Level 2 battery charger is expected to find a wider adoption and hence is used as the basis for modelling a bi-directional battery charger for this paper. A typical PEV battery charger consists of an AC/DC stage and a DC/DC stage. In this bidirectional battery charger, the AC/DC stage is an active converter while DC/DC stage can act as a buck converter or a boost converter. Thus with this bi-directional battery charger, the battery can be charged from the grid as well as discharged to the grid.
Power flow can be controlled using inherently efficient and compact Voltage Source Converters (VSCs) [12] . VSCs can be classified as Current Controlled Voltage Source Converters (CCVSC) and Voltage Controlled Voltage Source Converters (VCVSC). A CCVSC directly controls the current flowing into the VSC. This is achieved by generating switching signals based on the error in input current with respect to the reference value. In the case of a VCVSC, the magnitude and the angle of the converter side voltage with respect to the grid side voltage phasor is controlled to obtain the desired power flow [12] . Two types of battery charging system controllers based on CCVSC and VCVSC are developed. This helps in comparing the similarities and differences in the impacts the control methodologies of the battery chargers for PEVs have on the distribution system.
2.1. CCVSC Type Battery Charger
The topology of a CCVSC type battery charger with two different types of filters is as shown in Figure 2 and Figure 3, respectively. The topology and the parameters of the charger are adopted from [10] . The value of the

Figure 1. CC-CV charging characteristic of LFP type Li-ion battery cell [10] .
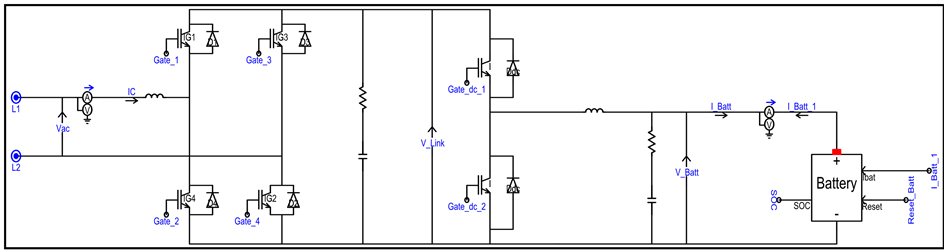
Figure 2. Topology of CCVSC type charger with L type filter.

Figure 3. Topology of CCVSC type charger with LCL type filter.
coupling inductor and DC/DC converter filter inductor are modified by observing the steady state and transient response of the charger. The negative impacts of a VSC are suppressed by connecting a filter between the converter and the grid [13] . L and LCL type of filters are used for analysis in this paper. For the L type filter, a 6 mH inductor is used and for the LCL type filter, two 3 mH inductors are used. A switching frequency of 3 kHz is selected for both the AC/DC and DC/DC converters. The cut-off frequency of 1.5 kHz is selected for LCL filter. Based on the information given in [13] and using (1), the value of the capacitor for the LCL filter obtained is 7.5 × 10⁻⁶ farads. Magnification of the frequency around the cutoff frequency is avoided by selecting the value of the damping resistor in series with capacitor to be 0.5 ohms.
 (1)
(1)
As outlined before, the operation of the charger shown in Figure 2 and Figure 3 can be divided into two stages; AC/DC Converter Stage and DC/DC Converter Stage. In unity power factor charging mode the AC/DC stage converts the AC input supply voltage to a DC voltage which appears across the DC-Link [14] . It also ensures that the input current is at unity power factor and the current harmonic distortion is low. The DC/DC converter modulates the DC-Link voltage to the required DC voltage based on the battery CC-CV charging algorithm [14] .
The control of the charger is based on the methodology given in [14] [15] and described in [16] . The control scheme for the AC/DC converter stage is shown in Figure 4. In unity power factor charging mode, the voltage error signal is generated by comparing the reference DC-Link voltage with the actual value. After normalizing, the error signal is given first to a feedback Proportional-Integral (PI) controller. Faster transient response is obtained by stopping the integrator of the PI controller whenever its output hits upper or lower limits defined by the saturation block and the error is in the same direction. A reset signal is generated when the output of the PI controller comes out of saturation, which resets the integrators of all the PI controllers in the control system of the charger. The output of the first PI controller is the magnitude of the current demanded by the charger. The magnitude of current is multiplied with the AC grid voltage to get the desired wave shape for the reference input current signal. A current error signal is generated by comparing the reference input current with the actual current flowing into the charger. This error signal is given to the second feedback PI controller to generate gating signals for the AC/DC converter based on Sine Pulse Width Modulation (SPWM). Since the gating signals for the converter are determined by comparing the actual current flowing into the battery charger with the desired current, the control methodology is called CCVSC.
The controller for the DC/DC converter in charging mode is shown in Figure 5. Only CC charging is incorporated in the control as the SOC of the battery remains almost constant during the simulation time period. The current error signal is generated by comparing the CC set point with the actual value of the battery current. This error signal is then given to the feedback PI controller to generate a reference duty cycle for the DC/DC converter. The duty cycle is implemented by generating appropriate gating signals for the switches.
2.2. VCVSC Type Battery Charger
The topology of a VCVSC type of battery charger with L and LCL type of filter is exactly same as that of a CCVSC type of battery charger. As mentioned before, the desired power flow in VCVSC is obtained by controlling the converter side voltage phasor with respect to grid side voltage phasor. There are two primary methods of controlling a VCVSC type of battery charger: Direct Control and Vector Control. These methods are described and compared in [17] . In this paper vector control methodology is used as it provides independent control of the active and reactive power flows. The basic structure of the control methodology is based on [18] [19] with all the necessary modifications incorporated to adapt it to PEV application.
The very first step in implementing the vector control is to obtain rotating space vectors for the grid side voltage and current. In the case of a three phase system, rotating space vectors are readily available, but this is not the case with a single phase system. In a single phase system, a fictitious phase orthogonal to the original phase has to be created in order to obtain the rotating space vectors. The fictitious orthogonal phase can be created using various techniques such as a 90˚ phase shift, the Hilbert transformation, and a Second Order Generalized Integrator (SOGI) [18] . In this paper, a SOGI is used to generate the fictitious phase for the grid side voltage and current. The original phase is considered to be along the “α” axis, while the fictitious phase is considered along the “β” axis. One of the major advantages of using SOGI compared to other methods is that it provides filtering of the input quantity [18] . The structure of SOGI used in the control of the battery charging system is as shown in Figure 6 [18] . Table 2 lists the input and output signals of SOGI.
The generation of the rotating space vectors is graphically shown in Figure 7. Once the rotating space vectors

Figure 4. Control of AC/DC converter stage for CCVSC type battery charger.

Figure 5. Control of DC/DC converter stage for CCVSC type battery charger.
for the grid side voltage and currents are obtained, the pseudo control algorithm to obtain the converter side voltage phasor for the desired power flow is as given below:
1) The synchronously rotating “d” axis is aligned with the grid side voltage space vector and lagging “q” axis orthogonal to it. In order to align the “d” and “q” axis as per the requirement, the value of angle “θ” needs to be known at all times. The value of angle “θ” is obtained by using a Phase Locked Loop (PLL) for the grid side voltage phasor. The transformation matrix “T” to map the grid side voltage space vector along the “d” and “q” axes is given in (2).
 (2)
(2)
2) The grid side current space vector is also mapped along “d” and “q” axes using “T”. The “d” axis current
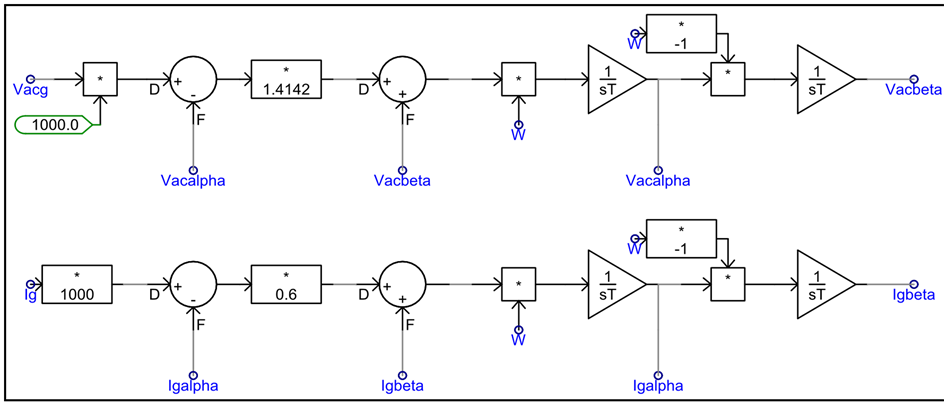
Figure 6. Structure of second order generalized integrator [18] .
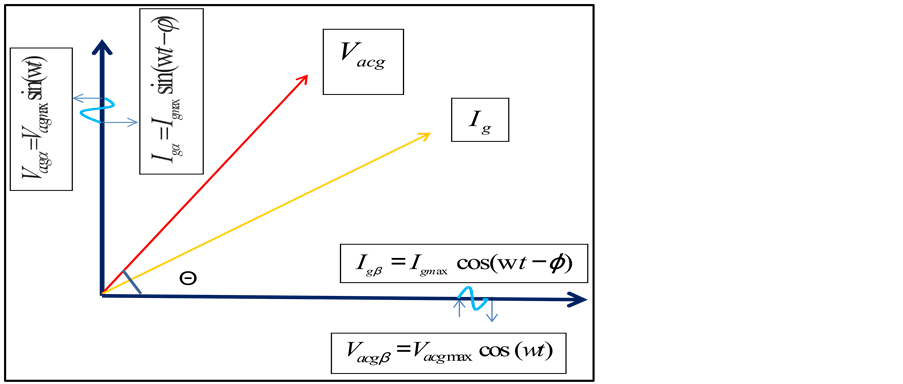
Figure 7. Rotating space vectors for grid side voltage and current.

Table 2. α-β axis values for the grid side voltage and current.
is in phase with the voltage and hence controls the active power flowing between the grid and the converter while the “q” axis is 90 degrees out of phase and hence controls the reactive power. The transformed equivalent circuit between grid and converter side voltages in the “d-q” domain with the filter capacitor neglected is shown in Figure 8 [19] . Vacd and Vacq are the grid side voltages while Vacinvd and Vacinvq are the converter side voltages in the “d-q” domain. Based on Figure 8, the converter side voltages in the “d-q” domain can be related to the grid side voltage as given in (3) and (4).
 (3)
(3)
 (4)
(4)
Equations (3) and (4) are implemented in control as described in steps 3, 4 and 5 of the algorithm and as shown in Figure 9 and Figure 10.
3) The error in the DC-Link voltage with respect to its reference value is used to generate the reference value for “d” axis current.
4) The difference in the actual reactive power flowing between the grid and converter and the commanded value is used to generate a reference value of “q” axis current.
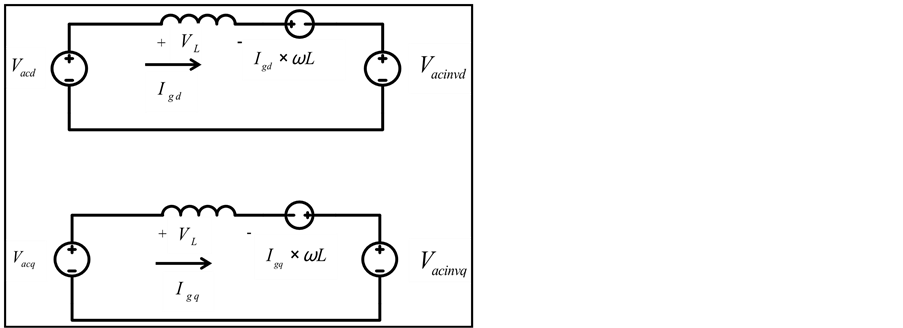
Figure 8. Transformed equivalent circuit in d-q domain.
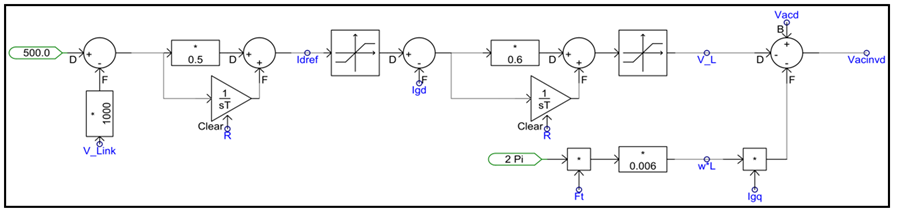
Figure 9. Control circuit to obtain converter side “d” axis voltage.

Figure 10. Control circuit to obtain converter side “q” axis voltage.
5) Errors in the “d” and “q” axis currents, based on the actual and reference values obtained from steps 2, 3, and 4, are used to generate the converter side “d” and “q” axis voltages as shown in the figures below.
6) The converter side “d” and “q” axis voltages are transformed back to the “α” and “β” axes using the inverse of the transformation “T”. “β” being a fictitious axis is discarded. The “α” axis converter side voltage is the desired voltage waveform which is implemented using SPWM.
3. System Description
The IEEE 13 Node Test Feeder, shown in Figure 11, is used for this research. This is an unbalanced, primarily 4.16 kV distribution test system [20] . Due to the small time step required for the simulation and the short lines present in the system, all distribution lines and cables are modeled using mutually coupled lines. The mutually coupled line model neglects line charging but provides a much faster simulation by allowing for a larger solution time step compared to the detailed model found in [21] .
In order to determine the effect the penetration of PEVs has on a distribution system, a 416 V bus is added to the system for the connection of PEVs. This bus is connected to the IEEE 13 Node Test Feeder through a Delta-Wye Grounded transformer attached to bus 680. This bus was chosen for the connection of PEVs because it is originally left empty in the test system. In real world systems, the connection point will be largely dependent on physical location in the system. On each phase of the secondary, sixteen PEV chargers are connected in parallel. Each vehicle draws approximately 6.2 kW of power during charging, for a total additional load of 99.2 kW per phase above the base system load. Single phase reclosing is also added to the system for fault protection. A single phase recloser with the opening and closing timings found in Table 3 is added at bus 671 on phase A of the line connecting bus 671 to bus 680. All simulations in this study are carried out using PSCAD. A temporary single phase to ground fault is applied to phase A of bus 680. The fault is applied 5 seconds into the simulation in order to allow the system to initialize and settle into steady state operation before the disturbance. The fault is then cleared 0.275 seconds after it is applied. The clearing of the fault occurs while the single phase recloser has phase A of the line connecting buses 671 and 680 disconnected from the main system. In order to isolate the impact of adding vehicles to the distribution system at bus 680 from the impact of adding a large load at the same location, a base case is first simulated with a constant power load connected to the added bus in place of vehicle chargers. The constant power load is equivalent to the power drawn by the vehicles. All results shown
compare the cases of vehicle chargers connected to bus 680 with the base case with the equivalent load connected.
4. Impacts
The differences between the two control structures as well as the different components that comprise the L and LCL type filters leads the four chargers to each have a different impact on the system.
4.1. VCVSC Type Battery Charger with L Filter
The VCVSC with L filter shows a negative impact on the system only when the fault is cleared from the system but the recloser is still open during a slow cycle. The fault clears from the system at 5.275 s and the recloser remains open until 5.33 s. During this period, a high magnitude, high frequency switching voltage is fed back into the system on phase A of bus 680 from the vehicle chargers. This distortion in the voltage on phase A of bus 680 comes from the vehicles connected to phases A and C on the secondary side of the Delta-Wye Grounded transformer. The vehicles on phase B remain largely unaffected due to the connection of the transformer. The peak magnitude of this voltage is over two times the steady state peak voltage. Once the recloser reconnects phase A of bus 680 to the rest of the distribution system, the voltages regain their steady state values. Figure 12 shows the voltage waveforms on phase A of bus 680 during the fault and recovery.
After the recloser reconnects phase A of the distribution system to bus 680, a decaying transient is seen in the current while the vehicle chargers resume steady state operation. Figure 13 shows the current waveform of phase B of bus 680 during the fault and recovery. A significant impact was not seen at other buses or on other phases in the system during fault recovery due to the recloser being in the open position.

Figure 12. Bus 680 phase A voltages-base case with equivalent load and VCVSC type battery charger with L filter.
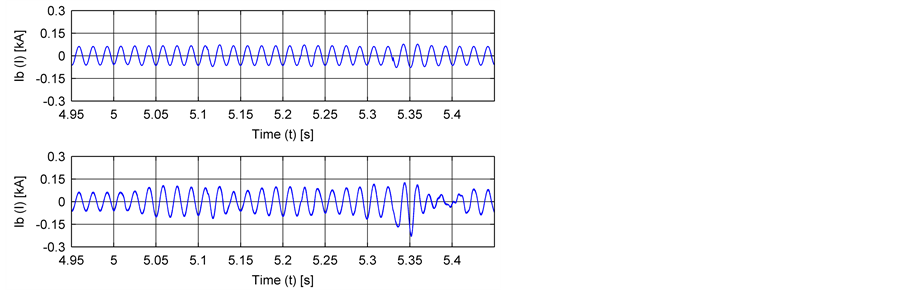
Figure 13. Bus 680 phase B currents-base case with equivalent load and VCVSC type battery charger with L filter.
4.2. VCVSC Type Battery Charger with LCL Filter
The VCVSC with LCL filter also shows a negative impact on the system during the same period as the VCVSC with L filter. With this charger model, a similar high magnitude, high frequency switching voltage as seen from the VCVSC with L filter is again fed back into the system on phase A of bus 680. In this case however, the peak magnitude is over nine times the steady state peak value compared to the much smaller magnitude seen with the L filter. Figure 14 shows the voltage waveforms on phase A of bus 680 during the fault and recovery.
A transient is again seen in the current after the recloser reconnects phase A of bus 680 to the rest of the distribution system. Figure 15 shows the current waveform of phase B of bus 680 during the fault and recovery.
4.3. CCVSC Type Battery Charger with L Filter
The CCVSC with L filter shows a negative impact on the system during the same period as both of the VCVSC models. The CCVSC with L filter feeds a high magnitude, high frequency switching voltage back onto phase A of bus 680 in a similar way to the VCVSC chargers. Figure 16 shows the voltage waveform of phase A at bus 680 during the fault and recovery. The peak magnitude of this waveform is similar to that of the VCVSC with L filter however it maintains this peak value for a longer period.
The CCVSC does not produce the same current transient problems as observed in the VCVSC. Figure 17 shows the current on phase B of bus 680 during the fault and recovery. The transient for this charger control is
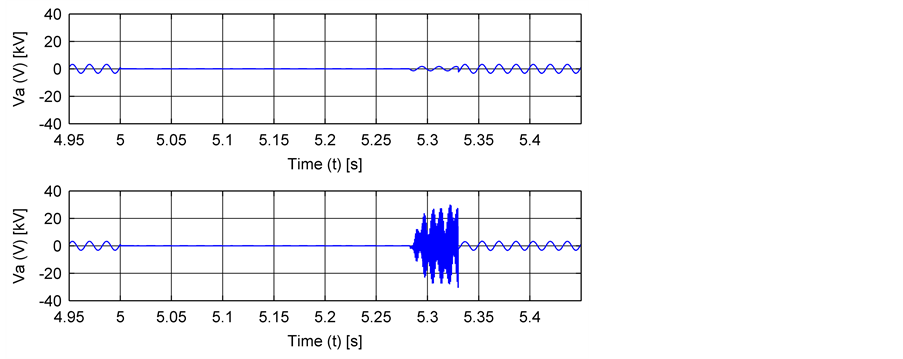
Figure 14. Bus 680 phase A voltages-base case with equivalent load and VCVSC type battery charger with LCL filter.
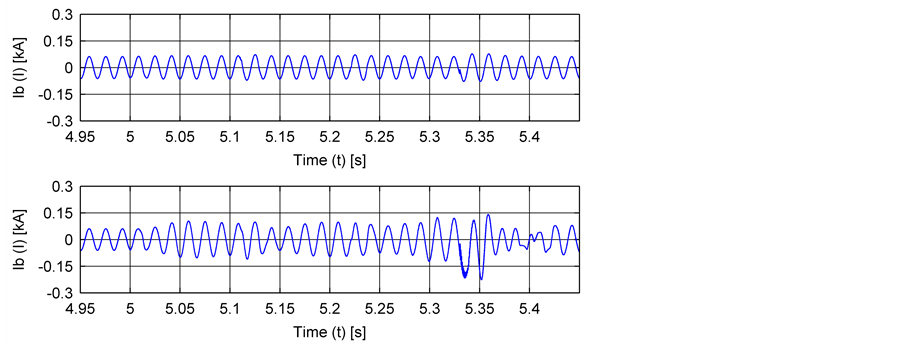
Figure 15. Bus 680 phase B currents-base case with equivalent load and VCVSC type battery charger with LCL filter.

Figure 16. Bus 680 phase A voltages-base case with equivalent load and CCVSC type battery charger with L filter.
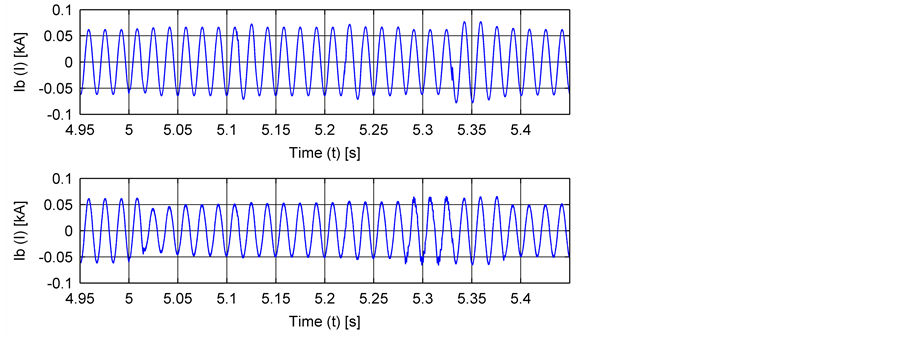
Figure 17. Bus 680 phase B currents-base case with equivalent load and CCVSC type battery charger with L filter.
much smaller and maintains a mostly sinusoidal shape.
4.4. CCVSC Type Battery Charger with LCL Filter
Since the CCVSC controls the magnitude and wave shape of the current entering the charger directly, the CCVSC with LCL filter does not show a negative impact on the distribution system during the fault recovery period. Figure 18 shows the voltage waveform on phase A at bus 680 during the fault and recovery.
Like the other CCVSC model, the current transient seen after the recloser reconnects phase A of bus 680 to the distribution system again is mostly sinusoidal and much less pronounced than the VCVSCs. Figure 19 shows the current of phase B on bus 680 during the fault and recovery.
4.5. Mitigation of Negative Impacts
Based on the negative impacts of both of the VCVSCs and the CCVSC with the L filter, it is desired to implement extra control structures to mitigate the negative impacts. To accomplish this task, control was added that stops all switching in the vehicle charger when the voltage at the terminals of the charger drops below 200 V. In per unit, this voltage is well below normal voltage drop limits in a distribution system. During this period where switching is stopped, all switches are left in the open position. After the terminal voltage returns to a normal value, the switching is allowed to resume. This prevents the vehicles from feeding back to the system while the recloser has phase A of bus 680 disconnected from the rest of the distribution system.

Figure 18. Bus 680 phase A voltages-base case with equivalent load and CCVSC type battery charger with LCL filter.
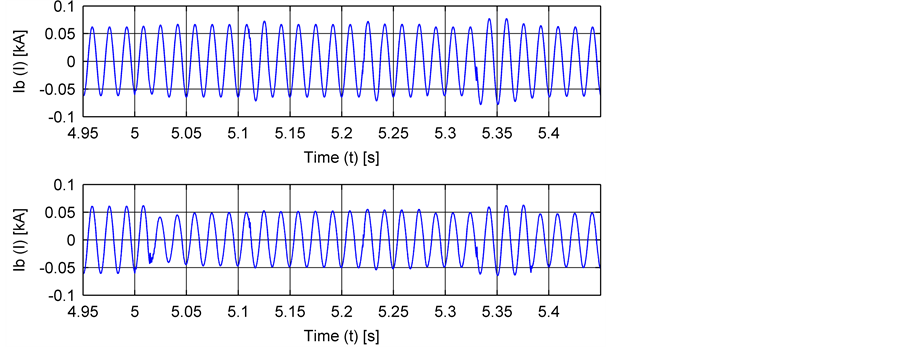
Figure 19. Bus 680 phase B currents-base case with equivalent load and CCVSC type battery charger with LCL filter.
5. Conclusions
It is found that even a relatively small penetration of PEVs has the potential to significantly impact a distribution system in a negative way. The main negative impact observed was a high-magnitude, high-frequency switching voltage on the distribution system due to recloser operation and continued vehicle charger switching during fault recovery.
• The topology of the charger control and filter type determine what this impact will be.
• The worst case occurred with the VCVSC with LCL filter.
• The CCVSC with LCL filter was the best case and did not produce a negative impact on the distribution system.
In order to prevent the potential negative impacts, extra control such as the under voltage control logic described in the previous section needs to be included in PEV chargers.
6. Future Work
In this case, the negative impacts of PEVs ceased shortly after the connection to the infinite source used to model the transmission system was restored. A high penetration of distributed generation will be added to the IEEE 13 Node Test Feeder in order to determine the impact PEVs have when the majority of the system load is served by sources other than the high-voltage transmission system.
Acknowledgements
The authors wish to thank the Clemson University Electric Power Research Association (CUEPRA) for their financial support and their valuable discussion.