Effect of Heterogeneity of Porous Media on Gas Permeation and Entrapment ()
1. Introduction
Recently, global warming becomes one of the worldwide issues. Its solution may include the carbon dioxide capture and storage (CCS) technology that is one of the possible options to mitigate the global warming of the earth. In the CCS technology, the residual gas trapping [1] -[10] is one of the cardinal trapping-mechanisms to mitigate the migration of CO2 due to buoyancy as well as the physical trapping by the cap rock, dissolution in water [10] -[17] , and mineralization [18] [19] .
The residual gas saturation, which is defined as the volume ratio of trapped CO2 to the pore space, is affected by various factors, such as the property of rock, the viscosities and densities of fluids, the velocity of water injection, and so on [20] . It is also influenced by the gas saturation after the gas injection, hereafter we refer it as the initial gas saturation. Several researchers have carried out the core flooding experiments with sandstone for a supercritical CO2 and water system and found that the residual gas saturation increases with an increasing initial gas saturation [21] -[23] . When the initial gas saturation is low, the residual gas saturation is low. Therefore the trapped gas volume per unit volume of porous rock is also low. However, the moved CO2 saturation, which is the difference between the initial and the residual gas saturations, is also low. The most of the CO2 injected into the porous rock is trapped at the same place by capillarity for low initial gas saturations. On the other hand, for the high initial gas saturations, the residual gas saturation is also high. However, the moved CO2 saturation is also high.
The initial gas saturation at the start of the water inflow is also affected by various factors including the characteristics of porous medium, the viscosity ratio, buoyancy, and capillary forces of the flowing fluids [24] -[27] . At the natural sandstone cores, the initial gas saturation depends on pore size distribution and the heterogeneity caused by the sedimentary layers [23] . The initial gas saturation influences not only the residual gas saturation but also an extent of CO2 plume in the reservoir.
In this research, we investigated the influence of the homogeneity of porous media on the initial gas saturation and the residual gas saturation. When gas permeates into the porous media filled with water, the gas pressure should exceed the capillary entrance pressure. Natural sedimentary formations have stratified structure of porous media. The interface of stratified structure hinders gas migration across it. The effect of the interface on gas vertical and parallel migration was discussed.
2. Experimental Method
The glass beads with the particle diameters of 200 μm, 400 μm, and 600 μm were packed in the acrylic cylinder with the inner diameter of 32 mm, as shown in Figure 1, to model the stratified structure of natural sedimentary formations. We made two types of packed beds which have the stratified parallel and vertical structure to the fluid flows, respectively, as shown in Figure 1(a) and Figure 1(b). The packed beds were aligned with respect to the gravitational acceleration. The fluids were injected into these beds vertically upward or downward. The experiments were carried out at atmospheric temperature and pressure conditions. Nitrogen and water doped with 7.5 wt% sodium iodide were used for fluids, because of the visualization in an X-ray computed tomography (CT) scanner inside of the packed beds.
The characteristics of homogeneous porous media are summarized in Table1 The porosity of the packed beds was estimated as 0.38 by the measurement of the mass change before and after water saturation. The permeability is evaluated by Carman-Kozney formulas,
 (1)
(1)
and the Bond number [27] is defined as,
 (2)
(2)
where ϕ is the porosity, d is the glass beads diameter, Δρ is the density difference, g is the gravitational acceleration, σ is the interfacial tension. The Bond number in Table 1 was evaluated for nitrogen and water system used in the experiments. For the typical reservoir conditions of CCS, NDB is approximately 10−7 for a supercritical CO2 and water system. Therefore, the buoyancy is relatively higher with respect to the capillary forces in the experimental conditions.
The experiments were carried out as following procedures. First, the packed beds were saturated with water by using a vacuum chamber. Second, the gas injection side of the packed bed was connected to the tank filled with nitrogen and another drainage side was connected to a syringe filled with water. Next, the gas was injected into the packed bed at a constant flow rate by withdrawing water by a syringe pump at a constant flow rate. Finally, water was injected into the packed bed at a constant rate. For gas injection, experiments were carried out
 (a)
(a) (b)
(b)
Figure 1. Experimental setup. (a) Parallel layers; (b) Serial layers.

Table 1. Properties of porous media.
at three capillary numbers (Ca = μw u/σ) of 1.0 × 10⁻⁷, 1.0 × 10⁻⁶, and 1.0 × 10⁻⁵, where μw denotes the viscosity of water, u is the Darcy velocity that is defined as the volumetric flow rate per unit cross-section area. The gas injection direction was vertically downward and upward. On the one hand, the direction of the water injection was always upward at Ca = 1.0 × 10⁻⁶. The volumes of injected gas and water were 1 pore volume (=21.38 ml), respectively. An X-ray CT scanner (Comscantechno Co. Ltd., ScanXmate-G100S110), that was used in our previous work [28] , was used to visualize the inside of the packed beds. The pictures were taken at each step of experimental procedures. The size of pictures is 496 × 496 × 496 pixel at the resolution of 70 μm/pixel. CT images were adjusted in order that the brightness of the pipe of the packed bed remains same from scan to scan. Because the threshold value of the brightness to distinguish nitrogen gas from water and porous matrix imparts significant impacts on the accuracy of saturation measurements [28] , it is decided so that the porosity estimated from the CT images is as close as that evaluated by the change in mass. The maximum difference between the porosity estimated from the CT images and that from the change in mass was 0.03 which is included also in the measurement of saturation.
3. Results and Discussion
3.1. Parallel Layer
Figure 2 and Figure 3 show the distributions of gas in porous media at initial gas conditions after the downward gas injection into the parallel layer, and at the residual gas trapping conditions after water injection, respectively. Commercial software (VG Studio Max 2.1) was used to draw 3-D images from the CT images. At each capillary number, gas penetrated only through the layer of 400 μm. Gas can hardly enter layer of 200 μm, because the entrance pressure was twice higher than that of 400 μm. Because the gas flowed only
 (a)
(a) (b)
(b) (c)
(c)
Figure 2. Downward gas injection into parallel structures. Surfaces of gas bubbles are colored in green. The porous media consist of four parallel layers of 200 μm, 400 μm, 200 μm, and 400 μm from left to right. The visualized cylindrical region is 35.6 mm in height and 32.0 mm in diameter. (a) Ca = 1.0 × 10⁻⁷; (b) Ca = 1.0 × 10⁻⁶; (c) Ca = 1.0 × 10⁻⁵.
 (a)
(a) (b)
(b) (c)
(c)
Figure 3. Trapped gas bubbles after upward imbibition of water into the initial gas condition shown in Figure 2. (a) Ca = 1.0 × 10⁻⁷; (b) Ca = 1.0 × 10⁻⁶; (c) Ca = 1.0 × 10⁻⁵.
through the layer of 400 μm, the effective cross-sectional area substantially reduced by half. Additionally, the amount of gas penetration into two layers of 400 μm was different from each other. The amount of gas percolation in right layer in Figure 2 was higher than the other because the gas migration stopped in the left layer after the breakthrough in the right layer.
Figure 3 shows the gas was trapped at the position where gas percolated during the gas injection. Throughout the processes of drainage and imbibition, the layers of 200 μm were always saturated with water, and did not contribute as a gas reservoir. As shown in homogeneous packed bed of glass beads [25] , the various sizes of the trapped gas bubbles were observed in Figure 3 from small bubbles at a pore scale to large bubbles at a pore network scale.
Figure 4 shows the initial gas condition after the upward gas injection into the parallel layer. In this case, viscous fingering and/or capillary fingering [29] -[33] caused at the interface between gas and water enhanced by buoyancy. Therefore, the gas fingers penetrated one layer of 400 μm creating slight route. The initial gas saturation after gas injection was low compared with the downward cases shown in Figure 2, where the fingerings are suppressed by the buoyancy. In the case of upward injection, the initial gas saturation tends to increase with the capillary number because of the pressure gradient established along the flow direction [24] [25] . In the case of downward injection, the gas saturation tends to decrease with the capillary number because
 (a)
(a)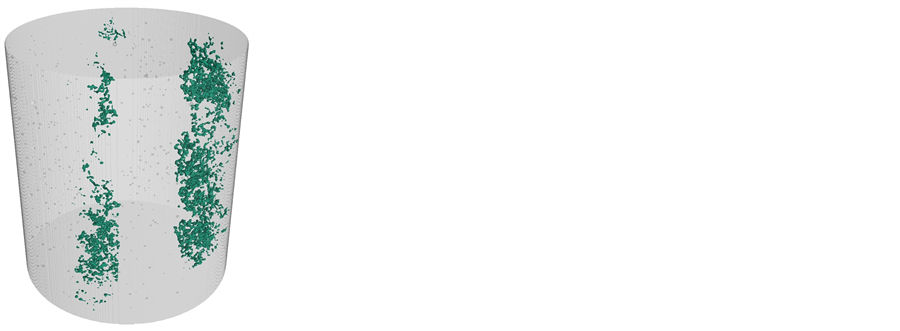 (b)
(b) (c)
(c)
Figure 4. Upward gas injection into parallel structures. (a) Ca = 1.0 × 10⁻⁷; (b) Ca = 1.0 × 10⁻⁶; (c) Ca = 1.0 × 10⁻⁵.
of the instability on the interface [27] .
3.2. Serial Layer
Figure 5 and Figure 6 show the images of the initial gas state and the residual gas trapping state at the capillary number of 1.0 × 10⁻⁷ for gas injection into the serial layers in a downward and upward direction, respectively. In the case of a downward gas injection, the interface between gas and water was stabilized by buoyancy, but the displacement efficiency was different from each other between the layers of 200 μm and 600 μm. The initial gas saturation for 200 μm was lower than that of 600 μm. At the early state of gas percolation in the layer of 600 μm, it would be expected that the percolation pattern was same with that of 200 μm. During this stage, the pressure gradient was kept low through the packed bed. When the tip of the finger reached the interface bottom of the 600 μm layer, the capillary entrance pressure of the 200 μm layer hindered the percolation into the 200 μm layer. Therefore, fingers grew in radial directions in 600 μm layer after the pressure built up to overcome the entrance pressure. On the other hand, when the finger grew in the layer of 200 μm, there was no entrance pressure for 600 μm. Therefore, when a finger reached the interface, it spontaneously percolated into the 600 μm layer. As a result, much gas penetrated into the layer of 600 μm even for the upward gas injection as shown in Figure 6. For the layer of 200 μm, because the percolation process was same with homogeneous packed bed, the initial gas saturation of this layer was lower for upward injection because of enhanced fingering.
In the residual gas trapping condition, a large amount of gas was trapped in the high gas saturation layers of 600 μm. For the layers of 600 μm, all the downstream layers were 200 μm for upward injection of water. For the gas in 600 μm, the interface acted as a trapping structure due to the capillary entrance pressure. Therefore, the gas saturation was high at the layer of 600 μm.
3.3. Local Initial Gas Saturation
For inhomogeneous packed beds, the gas saturation changed from layers to layers. Therefore, we evaluated the local initial gas saturation for each layer. In the parallel layer, the average gas saturation was evaluated in the region from the entrance to the position of 15 mm. In the serial layer, the gas saturation was evaluated for three layers of 600 μm and only the middle 200 μm layer. Figure 7 and Figure 8 show the initial gas saturation for each layer as a function of capillary number with the data for homogeneous packed beds for downward and upward gas injection, respectively.
In the case of downward gas injected into the parallel layer, the gas flowed only through the layer of 400 μm, because of the capillary entrance pressure as mentioned above. The initial gas saturation at the layer of 400 μm for the parallel layers agrees well with that at the homogeneous packed bed of 400 μm. In the case of upward gas injection, the viscous and/or capillary fingering was enhanced by buoyancy. Therefore the initial gas saturation
 (a)
(a) (b)
(b)
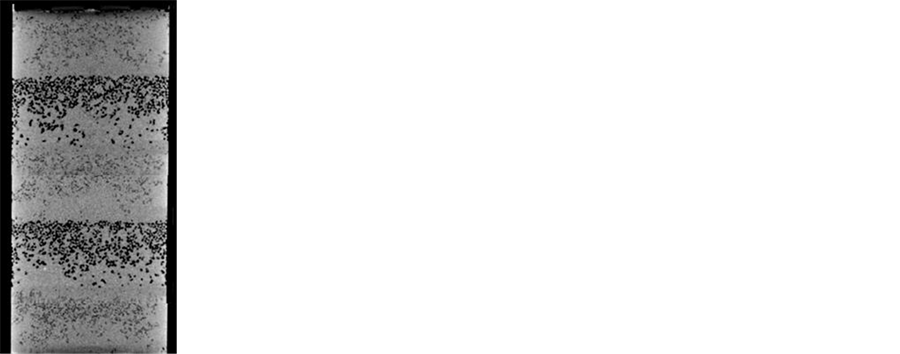
Figure 5. Effect of serial heterogeneity of porous media on gas saturations for downward gas injection at the capillary number of 1.0 × 10⁻⁷. Porous media consist of five layers of 200 μm, 600 μm, 200 μm, 600 μm, and 200 μm from the top to the bottom. Dark region denotes gas gray region denotes glass beads filled with water. (a) Initial gas state; (b) Residual gas state.
 (a)
(a) (b)
(b)
Figure 6. Effect of serial heterogeneity of porous media on gas saturations for upward gas injection at the capillary number of 1.0 × 10⁻⁷. (a) Initial gas state; (b) Residual gas state.

Figure 7. Effect of heterogeneity and capillary number on the gas saturation after downward gas injection.

Figure 8. Effect of heterogeneity and capillary number on the gas saturation after upward gas injection.
for the layer of 400 μm was very low for all capillary numbers. The initial gas saturation at the layer of 400 μm agrees well with that at the homogeneous packed bed. It should be noted that the parallel packed bed consisted of the layers of 400 μm and 200 μm, and the gas saturation was always zero for the layer of 200 μm. The heterogeneity parallel to the flow direction reduces the pore space capacity for gas migration.
In the gas injected to a downward direction into the serial layer, the gas saturation was determined by the downstream capillary entrance pressure rather than the property of local porous media as mentioned above. Therefore, gas saturation for the 600 μm layer was high because of the capillary entrance pressure behind this layer. The initial gas saturation at the 600 μm layer was as high as that for the homogeneous packed bed. For the 200 μm layer, when the finger reaches the 600 μm, it spontaneously percolated into the 600 μm layer as mentioned above. As a result, the saturation at the 200 μm layer is much lower than that for the homogeneous packed bed.
On the other hand, in the case of upward gas injection as shown in Figure 8, the gas saturations of homogeneous layer were lower than 0.2, because the viscous and/or capillary fingering was enhanced by the buoyancy. With the increase in the capillary number, the pressure gradient established across the beds was high. The gas saturation, however, remained low in the range of the capillary number between 10−7 and 10−5. In the case of serial layer, the initial gas saturations at the layer of 600 μm were more than 0.7 for all capillary numbers. This fact suggests that high gas saturation is expected when injected CO2 migrates across the sedimentary layers due to buoyancy force. For the layer of 200 μm, the initial gas saturations were as high as those for the homogeneous packed bed, because of no entrance pressure.
3.4. Residual Gas Saturation
To evaluate storage capacity of CO2 in inhomogeneous porous media, the saturation should be evaluated averaged over the inhomogeneous structures. In the parallel layers, the average saturation was evaluated in the region from the inlet to the position of 15 mm including four layers. In the serial layers, the average gas saturation of 600 μm and 200 μm was evaluated. These results are shown in Figure 9 for all capillary numbers.
In the parallel layer, when the gas was injected in an upward direction, both the initial gas saturation and residual gas saturation were low. When the gas was injected in a downward direction, the initial gas saturation increased up to 30%; but the residual gas saturation remained still low, because the gas entered only in high penetration layers. This fact suggests that CO2 has a potential to migrate through the vertical faults selectively at low saturation.
On the other hand, in the serial layer, the initial gas saturation was approximately 60% for the downward injection, and approximately 50% for the upward injection. The residual gas saturations both upward and downward injections were approximately 30%. But, the residual gas saturation was a little different between upward and downward. When CO2 was injected into the geological formations, the stratified structure reduced the development of the viscous and/or capillary fingering.
4. Conclusions
We have investigated the effect of stratified structure of heterogeneous porous media on gas permeation and
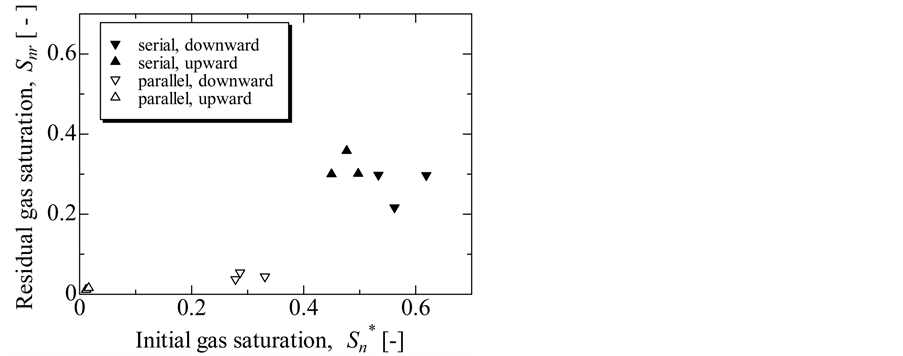
Figure 9. Relationship between the initial gas saturation and the residual gas saturation.
entrapment. Experiments were carried out at a laboratory condition for a nitrogen and water system with the packed beds of glass beads with various diameters which modeled stratified porous media.
In the case of parallel structure, the injected gas selectively percolated into permeable layers. The gas permeation can hardly occur for the less permeable layers because of the capillary entrance pressure. For the permeable layers, the initial gas saturation was higher for the downward gas injection compared with the upward injection, because buoyancy suppresses the development of fingering. The interface of porous structure does not contribute to the residual gas trapping. Therefore the residual gas saturations were low for both cases.
In the case of serial structure, the interface of porous structure hindered the migration of gas across it, because of the capillary entrance pressure. When the gas percolated in the permeable layers, capillary fingering was developed in the layers. However, when the tip of finger reached the interface, fingers grew in tangential directions until the pressure built up to overcome the capillary entrance pressure. As a result, high gas saturation was achieved in the permeable layers of both upward and downward gas injections. In imbibition process, the interface acted as the trapping structure by capillarity. Therefore, high residual gas saturation was achieved in the permeable layers.
Acknowledgements
We used the X-ray CT scanner at the JST Tokushima Plaza in the University of Tokushima. This work was supported by JSPS KAKENHI Grant Number 21310053.
NOTES
*Short paper.