1. Introduction
Cyprinines of the genus Capoeta (Valenciennes, 1842 [1] ) are widely distributed ray fish found throughout western Asia, from Anatolia to the Levant, Transcaucasia, the Tigris and Euphrates basins, most of Iran, Turkmenistan, northern Afghanistan, and the upper reaches of the Amu-Darya and Syr-Darya drainages [2] . Capoeta damascina is a species found in the Middle Eastern Jordan River drainage basin, the entire Levant, Mesopotamia and parts of southern Turkey. The phylogenetic relationships of the genus Capoeta remain poorly studied until now. Out of the approximately 20 species currently recognized within Capoeta [1] , only a few have been included in previous phylogenetic analyses [3] .
Levin et al. (2012) [1] studied the genus Capoeta and found based on the complete mitochondrial gene for cytochrome b, sequences obtained from 20 species sampled from the majority of the range and 44 species of closely related barbs of the genera Barbus s. str. and Luciobarbus [1] . C. damascina is one of the most common freshwater fish species found throughout the Levant, Mesopotamia, Turkey and Iran. According to the state of knowledge prior to this study, C. damascina, which is distributed over a wide range of isolated water bodies, is not a well-defined species. C. damascina is found in the Jordan River Valley, which is located in Lake Kinneret [1] .
Three different rivers flow into the Jordan River—the Dan, Hasbani and Hermon Rivers—and C. damascina is found in all of them [21] . The Dan River has predictable limnological, ecological and biological conditions as derived before [4] -[6] compared to the Hasbani and Hermon Rivers.
In the present study, the hypothesis examined whether the variation in habitats (the different rivers) affects genetic variation. The ecological conditions and water flows differ between the rivers flowing into the Jordan River [7] . The goal of this study was to identify molecular markers linked to different C. damascina in the Dan, Hasbani and Hermon Rivers.
2. Materials and Methods
2.1. Fish Samples
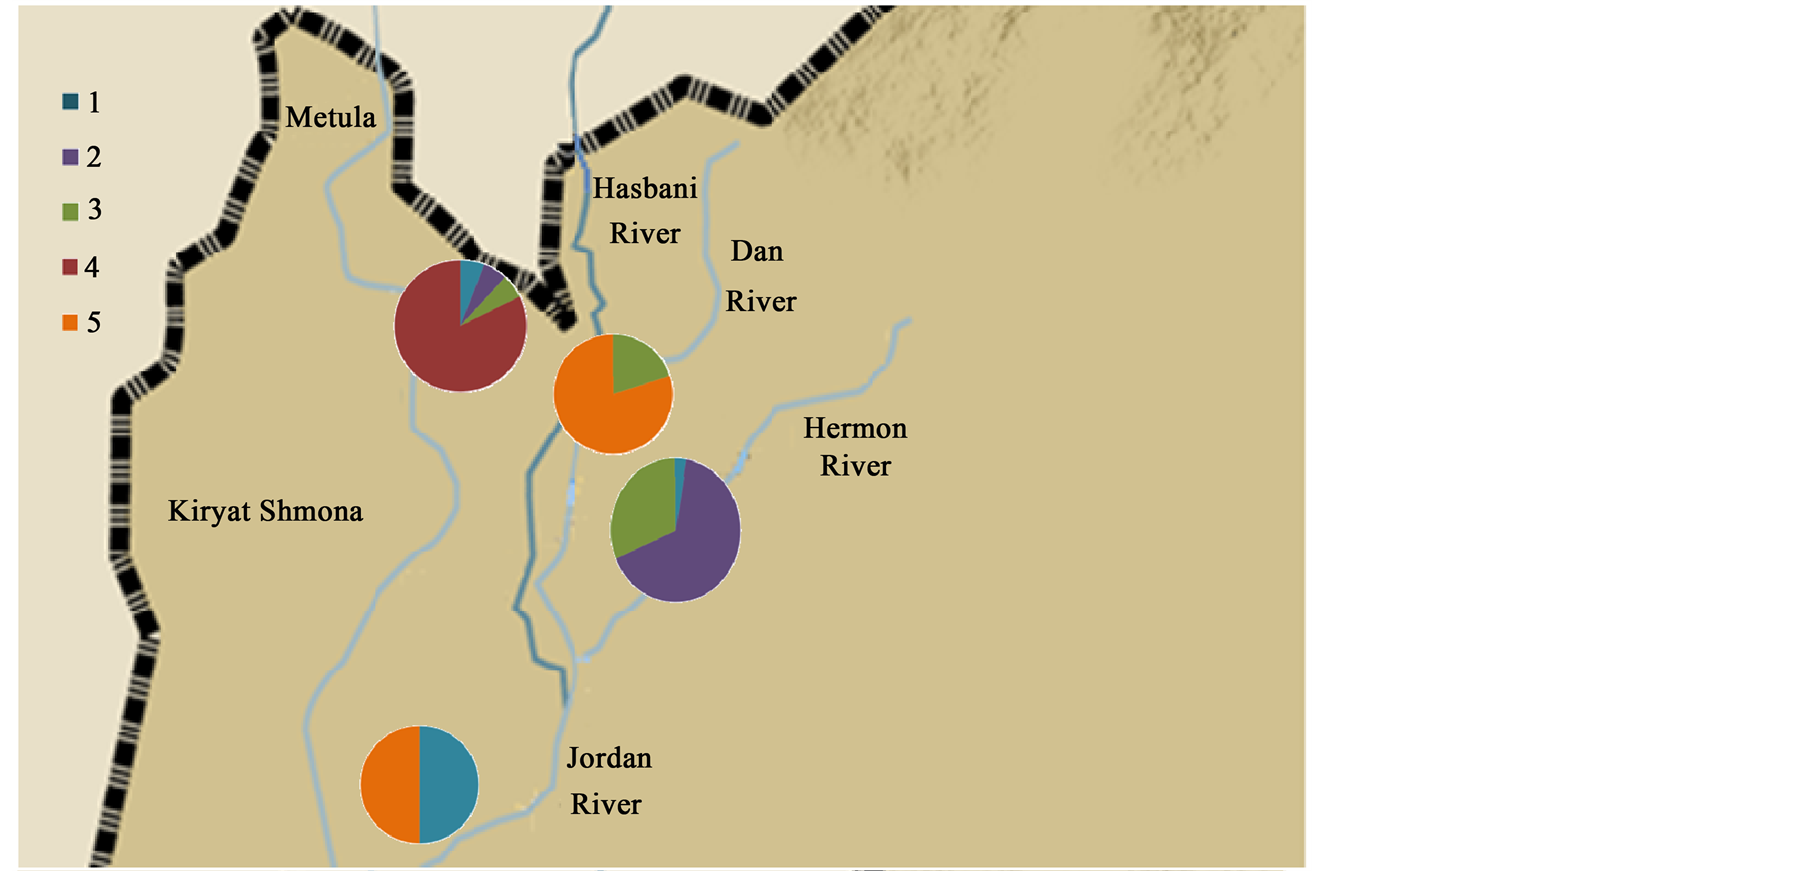
Thirteen stations were selected as sites for sampling C. damascina in the Dan, Hasbani, Hermon and Jordan Rivers (Figure 1 and Table 1). Fish samples were taken by electroshocking (Mofix 5000, Dobler, Germany; 7.0 kw, 350 - 600 V, with Honda 4-stroke gasoline generator) in March and April 2012 as described previously by Degani et al. [4] [5] . The effective range of the electroshocker was 1 m2 at each discharge, and an area of 2 × 10 m2 was sampled at each station. Ten fish (C. damascina) were sampled of from each station. Ten tissues (muscle) were taken from 10 individuals (Figure 1 and Table 1).

Table 1. Geographic localization of habitats in which Capoeta damascina were sampled.

Figure 1. Map of various breeding sites in Israel colonized by Capoetadamascina and examined in this study. H: Hermon River; H1-X: 33.24, Y: 35.69; H2-X: 33.24, Y: 35.68; H3-X: 33.22, Y: 35.65. D: dan river; D2-X: 33.23, Y: 35.63; D3-X: 33.23, Y: 35.62; D4-X: 33.22, Y: 35.61. S: Hasbani River; S1-X: 33.24, Y: 35.62; S2-X: 33.23, Y: 35.62; S3-X: 33.21, Y: 35.61; S4-X: 33.18, Y: 35.61. J: Jordan River: X: 33.18, Y: 35.61.
2.2. Samples Collected and DNA Extraction
The DNA samples were cut in 1.5 ml (Markova et al., 2010) Eppendorf tubes preserved in 95% ethanol at −20˚C [8] . Negative extraction and PCR controls with no tissue and no template DNA, respectively, were used in each experiment. The total samples used in this study were Cyt b, 16S and Random Amplified Polymorphic DNA (RAPD) analyses, respectively. Extraction was carried out using the QIAamp DNA Mini Kit (Qiagen, Germany) after proteinase K digestion. One mitochondrial gene and one nuclear gene were analyzed by polymerase chain reaction (PCR) amplification from genomic DNA and direct sequencing. The mitochondrial cytochrome b gene (Cytb), RAPD and 16S were amplified with primers located according to the PCR conditions described by [9] . Primers used in the current study are presented in Table2
2.3. Variance and Population Structure Analysis
Variance analysis was performed on three levels: within populations, among populations and among regions (rivers) based on the following division of the 13 Israeli sites. DNA sequences were analyzed using methods published by Wilbur and Lipman [10] adapted to the software, a computational program. Variances within populations, among populations and among regions were obtained by comparing the Israeli sites with four outgroups (various rivers—Dan River, Hermon River, Hasbani River and Jordan River). To calculate the DNA sequences, we employed the DNASTAR software package.
In order to examine the distribution of variation and differential connectivity in populations (PhiPT), regions (PhiRT) and populations within regions (PhiPR), we performed AMOVA analysis with populations nested within regions using GenAlEX (software).
Population and regional pairwise (PhiPT), PhiPR and PhiRT values were also calculated in order to examine the distribution of differences within populations, between populations and geographical areas, respectively, and to describe the expected deviation of heterozigoty [11] . The value of Nm, referring to the movement of individuals among subpopulations of each generation [12] , was calculated using GenAlEx. The genetic distance by Nei and Li’s distance matrix [13] [14] and its statistical significance (by the exact test) were estimated using Tools for Population Genetic Analyses (TFPGA) software. The evolutionary history was inferred using the neighborjoining method [15] . We employed MEGA5 software [16] to perform phylogenetic analyses.
Haplotype analysis was described by [11] ). To analyze the correlation between Nei’s genetic distance [14] and aerial distances [17] , we used the Mantel test [18] . Bayesian Analysis of Population Structure (BAPS) was calculated accordingly [19] . We calculated the aerial distance (km) among breeding sites according to the latitude and longitude between each locality using the calculator on the website [17] .
3. Results
DNA sequences were analyzed from a 276 bp of the Cyt b and a 500 bp of the 16S and 369 of the opsin (Table 2). The cluster frequencies (BAPS) (Corander et al., 2006) [6] of Cytb C. damascina across three rivers in northern Israel are presented in Figure 2. Four different clusters were found in the Hermon River and three in the Hasbani River, however only two in the Dan River. Moreover, some of the clusters in the Hasbani River differ from those found in the Hermon River. The composition of the clusters differ in the in the north and the south of the Hermon and Hasbani Rivers. A similar result was found when an analysis was made of the different sequences using the MegAlign program from the five different haplotype frequencies, showing that the lowest frequency was found in the Dan River (only two haplotypes) and the highest in the Hasbani River (four haplotypes) (Figure 3). The analysis of molecular variance of Cytb (AMOVA) [20] for individuals of C. damascina from eight populations in northern Israel shows significant differences (P < 0.05) among rivers and populations (Figure 4).
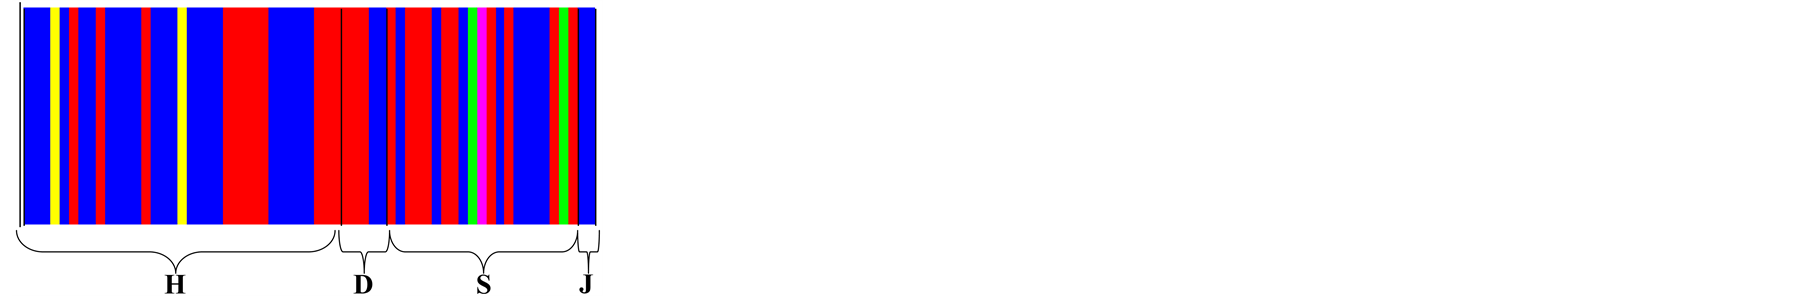
The Ctb analysis according to rivers using BAPS [19] is presented in Figure 5. The number of clusters in fish
Table 2 . The primer sets to sequence.
 (a)
(a) (b)
(b)
Figure 2. Cluster frequencies of Cytb Capoeta damascina across northern Israel rivers. (a) rivers and (b) stations according to Cytb data analysis (BAPS) (Corander et al., 2006) [6] .
found in the Hasbani and Hermon Rivers was larger than in the Dan River. The analysis by mitochondrial 16S of haplotype frequencies of C. damascina populations in the rivers in northern Israel showed a very low variation compared to Ctb (Figure 6). Three different haplotypes were found in the Hasbani River and only one in the Hermon and Dan Rivers.
Haplotype frequencies of C. damascina populations throughout Israel according to RAPD analysis are presented in Figure 7. Sixteen different haplotypes were found in the different rivers: eight in the Hasbani River, seven in the Dan River and only five in the Hermon River (Figure 7).
A very low correlation was found in Nei’s genetic distances based on differences in nucleotide sequences of the Ctb, and no correlation was found in 16S and RAPD (Figure 8).
4. Discussion
The present study supports the hypothesis that the different ecological conditions in three different rivers in northern Israel affect the genetic variations of the species C. damascina. These results are in agreement with most previous studies carried out on this species that examined the phylogeny and biogeography [3] of the genus Capoeta. Levin et al. (2012) [1] described three main groups of Capoeta: the Mesopotamian group; the Anatolian-Iranian group, which has the most diversified structure and encompasses many species distributed through-
 (a)
(a) (b)
(b)
Figure 3. Cytb analysis. Haplotype frequencies of Capoeta damascina populations. (a) rivers and (b) stations according to Cytb analysis (MegAlign program).
out Anatolian and Iranian inland waters; and the Aralo-Caspian group, which consists of species distributed in basins of the Caspian and Aral Seas, including many dead-end rivers in Central Asia and Northern Iran. The most probable origination pathway of the genus Capoeta is hypothesized to occur as a result of allopolyploidization. The origin of Capoeta was found around the Langhian-Serravallian boundary according to our molecular markers [1] . The diversification within the genus occurred during Middle Miocene-Late Pliocene periods. All variations in genetic markers, as was found in the present study, support the hypothesis that the gene flow between the three rivers is relatively low. All three rivers (Hasbani, Hermon and Dan) flow into the Jordan River [21] . The results of the present study show different clusters and haplotypes between the rivers using various mtDNA markers, and nDNA genetic (RAPD) variation was found in the rivers. Using RAPD as an exclusive method is not acceptable due to the difficultly in duplicating the results exactly. A comparison between various populations using RAPD together with another mtDNA marker is acceptable, as was done in the present study. RAPD is a very sensitive method, and in the different populations in various habitats, low vertebrates (fish and
df: degrees of freedom; SS: sum of squared observations; MS: mean of squared observations; Est. var.: estimated variance; % Var.: percentage of total variance; P-value estimates are based on 999 permutations; PhiPT: proportion of the total genetic variance among individuals within populations.
Figure 4. Analysis of molecular variance (AMOVA) (Excoffier, et al., 1992) [20] for individuals of Capoeta damascina from eight populations in northern Israel.
 (a)
(a) (b)
(b)
Figure 5. Ctb analysis according to rivers. (a) Assignment of individuals to genetic clusters (BAPS) (Corander et al., 2006) [6] displayed by color. Each vertical line represents the fractional membership of an individual to each genetic cluster. Horizontal axis represents sampled populations; (b) Dendrogram from hierarchical cluster analysis showing grouping of Capoeta damascina.


Figure 6. Haplotype frequencies of Capoeta damascina populations across Israel according to 16S analysis.

Figure 7. Haplotype frequencies of Capoeta damascina populations across Israel according to RAPD analysis.
 (a)
(a) (b)
(b)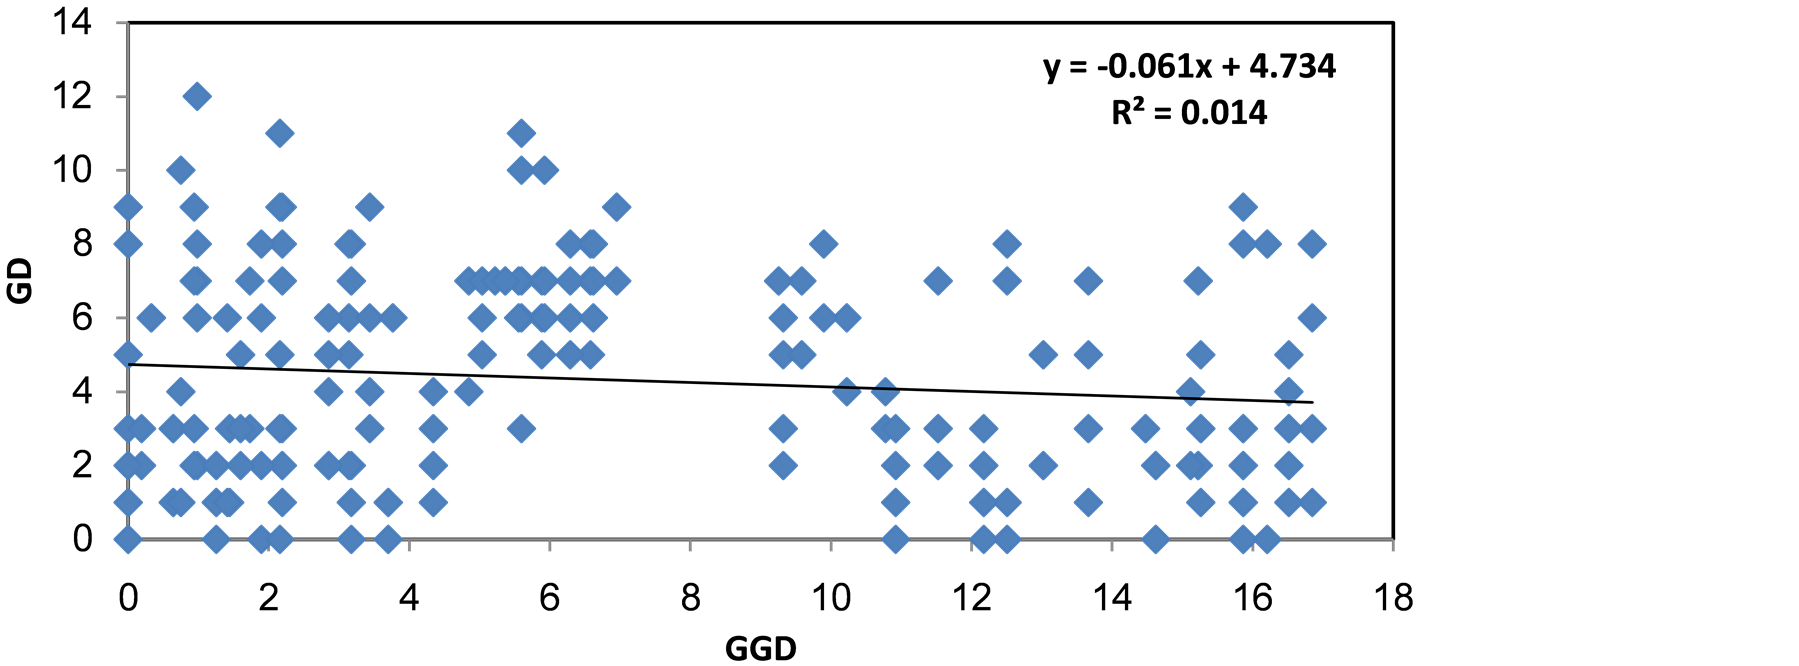 (c)
(c)
Figure 8. Nei’s genetic distances based on differences in nucleotide sequences of the (a) CytB; (b) 16S; (c) RAPD fragment of Capoeta damascina, examined for correlation to geographic distance (km).
amphibians) were found in both methods, as was done in the present study, e.g., Pseudepidalea viridis (Syn. Bufo viridis) [22] , Hyla felixarabica [23] [24] , Triturus vittatus vittatus [25] -[29] , Anabantoidei fish [30] and Salamnadra infraimaculata [31] -[34] .
Four different clusters were found in the Hasbani and Hermon Rivers and only two in the Dan River. Moreover, the clusters in the Hasbani River differed from those found in the Hermon River. A similar result was found when an analysis of the different sequences was made using the MegAlign program from the five different haplotype frequencies, the lowest being in the Dan River (only two haplotypes) and the highest in the Hasbani River (four haplotypes).
The reproduction of C. damascina has been studied intensively [35] . Some evidence shows that the C. damascina swims upstream to find breeding places [21] . According to the present study, we found mtDNA variation in the Dan, Hasbani and Hermon Rivers, and suggested a low gene flow among the rivers. The Dan River has very constant and predictable limnology conditions [4] -[6] compared to the Hasbani and Hermon Rivers. In the present study, a high genetic variation was found in both the Hasbani and Hermon Rivers compared to the Dan River, where limnological conditions are relatively constant [4] [5] .
C. damascina, one of the most common freshwater fish species found throughout the Levant, Mesopotamia, Turkey and Iran, is not a well-defined species [8] . In the present study, the ecological conditions [4] -[6] differing among the river might be factors that affect molecular variations among the populations of the different habitats.
5. Conclusion
In conclusion, the present study supports the hypothesis that a variation in ecological conditions affects genetic variations of the species Capoeta damascina.