1. Introduction
Nowadays, despite many risk assessment methodologies being applied in enterprises’ projects in order to mitigate risk, in many cases, during operation, the layers of protection fail down and many plants in Brazil work on untolerable risk level for a period of time.
Mostly, the decision not to shut down plants is based on employee’s background. In other cases as in Brazilian Oil and Gas industry, a risk analysis tool as PRA (Preliminary Risk Analysis) is applied in order to check qualitatively if risk level is catastrophic and if some implemented recommendations are enough to control and maintain risk on acceptable levels.
The motivation for this research was to develop the best risk analysis approach in order to provide support to plants’ shutdown decision whenever a layer of protection takes place due to maintenance action or even failure. Consequently risk analysis must be carried out to check if risk is under intolerable level in such circumstances. In fact, we got a conclusion that PRA is not enough to assess risk level whenever one layer of protection takes place. Therefore, the best approach is a combination of risk analysis methods like PRA, LOPA and FTA as will be demonstrated.
In Nuclear industries all unsafe conditions which bring unacceptable risk to systems are known, and so is the time of not allowing running the nuclear plant if unsafe conditions take place. Actually, depending on situation, the plant stops by itself in safe condition due to BPCS (Basic Process Control System).
Unfortunately, that’s not the same in Brazilian Oil and Gas industry which depends on specialists’ analysis and this study proposes one methodology to assess risk in the case of failures of layers of protection or required maintenance. Indeed, the main objective is to support the decision to shut down plants to avoid operateing on unacceptable risk level. Basically the main steps of methodologies are:
1) To carry out PRA of system with layer of protection to define risk qualitatively;
2) To carry out LOPA analysis to find out probability of accident without layer of protection;
3) In contingency system, to carry out FTA analysis to find out availability without layer of protection;
4) To check if risk without layer of protection or contingency system is acceptable;
5) If risk is unacceptable, to propose some preventive actions, new layer protection or new contingency system to maintain risks on acceptable level;
6) If not possible, to maintain risk on acceptable level, shutdown plant.
The next sections will provide clear explanations about risk analysis methodologies (PRA, LOPA and FTA) and risk assessment methodology to support shutdown plant decision.
2. Preliminary Risk Analysis
The PRA analysis come from military industry application as a reveal technique applied to check missile system launch. In that case, 4 of 72 missiles intercontinental atlas were destroyed with high cost.
Nowadays, the PRA is applied in many industries in project conceptions [1] but it can be applied in operational activities along enterprise lifecycle.
So, no matter this application phase, that main objective is support decision in order to avoid accident eliminating unsafe conditions.
In most of cases in Brazil, that kind of analysis has a specific focus on environment or safety issues. It’s good in terms of faster problems solutions in operational areas but in case of project that unique focus applications may increase project cost associate with so many recommendations or in some cases less preventive actions than necessary would permit unsafe conditions and environment impacts.
In order to save money, time and integrate problems solutions the integrated PRA was implemented in Brazilian Oil industry. In onset application is used to focus on safety or environment issues separately but nowadays is used to assess hazard integrating social, safety and environment issues [2]. The Figure 1 below shows PRA matrix as instance.
Based in risk matrix it’s possible to assess hazard in PRA file which comprise cause, consequence, risk, detection and recommendation column.
The preliminary analysis is one of the most spread out risk analysis tool in Brazilian Oil and Gas industry because some advantages that are:
Þ Simple application and understanding;
Þ Supply direct information about hazards involved in process along enterprises lifecycle to other studies;
Þ Support other qualitative and quantitative analysis with qualitative information.
Despite advantages, such risk analysis methodology requires some cares to avoid a superficial risk understanding and sub estimate risks involved in process. Therefore the PRA drawbacks are:
Þ Simplify risk understanding and sub estimate it;
Þ To forget to take into account some hazard involved;
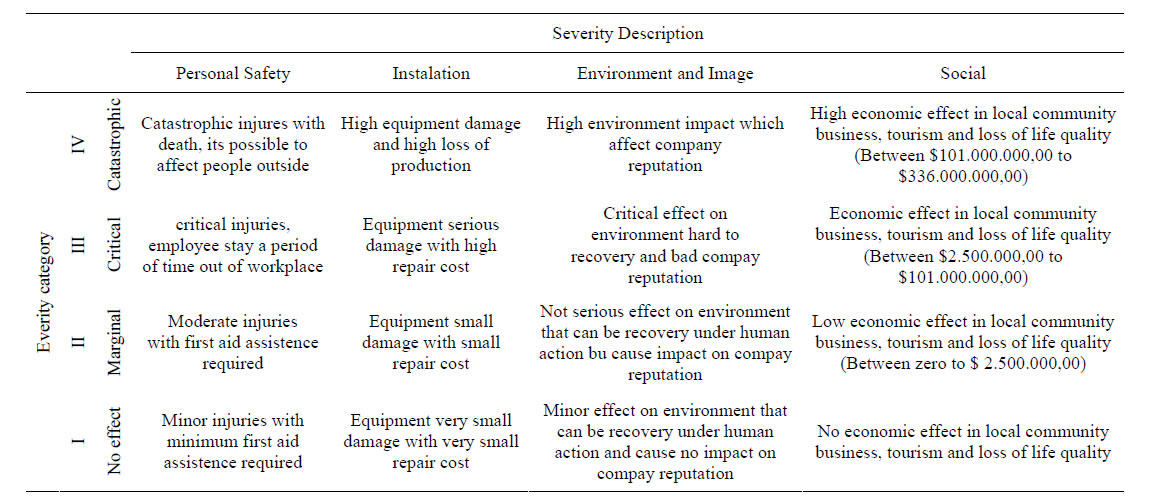
Figure 1. PRA Matrix Author—Calixto, 2007.
Þ Implement preventive actions only in process and activities with critical risk.
Even though such drawbacks, that is a very good methodology to assess risk involved in process and quantify risk qualitatively but in most of cases, due risk criticality, is required to implement other risk analysis methodology as effect and consequence analysis do investigate the hazard consequences.
3. Layer of Protection Analysis
The risk analysis tool called LOPA (Layers of Protection Analysis) is a special form of event tree analysis that is optimized for the purpose of determining the frequency of an unwanted event regarding such layer of protection [3]. As doing so, is used to define the accident probability regarding initiate event and failure in all layers of protection.
In the late 90s international standards for control systems on computer controlled facilities emerged [4]. The task of compliance with these standards in a consistent manner led to the introduction of Layer of Protection Analysis (LOPA) for determination of Safety Integrity Levels (SILs) for computer operated production facilities. This was conceived and promoted by the Center for Chemical Process Safety (CCPS).
The layer of protection is any equipment which avoids accident by itself, it means without human intervention [5]. Some author consider human action as layer of protection and in so many cases it avoid many accident but in most serious case, when a catastrophic event would be triggered, more than one layer of protection further human intervention is projected to guarantee an acceptable risk level.
The remarkable point when a safety system is projected is how far reliable is required to each layer protection and how many of them are necessary. In fact, engineers project system based in their background about safety system. Therefore, specific analysis like LOPA is required to check if risk is acceptable or not. In this case, LOPA will provide the frequency or probability of accident and further combining it with consequences in terms of death result in risk value. Thus it’s possible to check if risk is tolerable or not based in risk criteria.
In negative case, is necessary to improve project and propose more layers of protection or increase layer protection’s reliability. In order to make up safety system, the SIL (Safety Integrity Level) analysis is carried out based in specific international procedures (IEC-61508). That methodology consist in define how much reliable is required to SIF (Safety Instrumented Function) to reduce risk to acceptable region.
Indeed, no matter the methodology applied, the main idea is to certify that system is reliable enough to be acceptable in terms of risk [6].
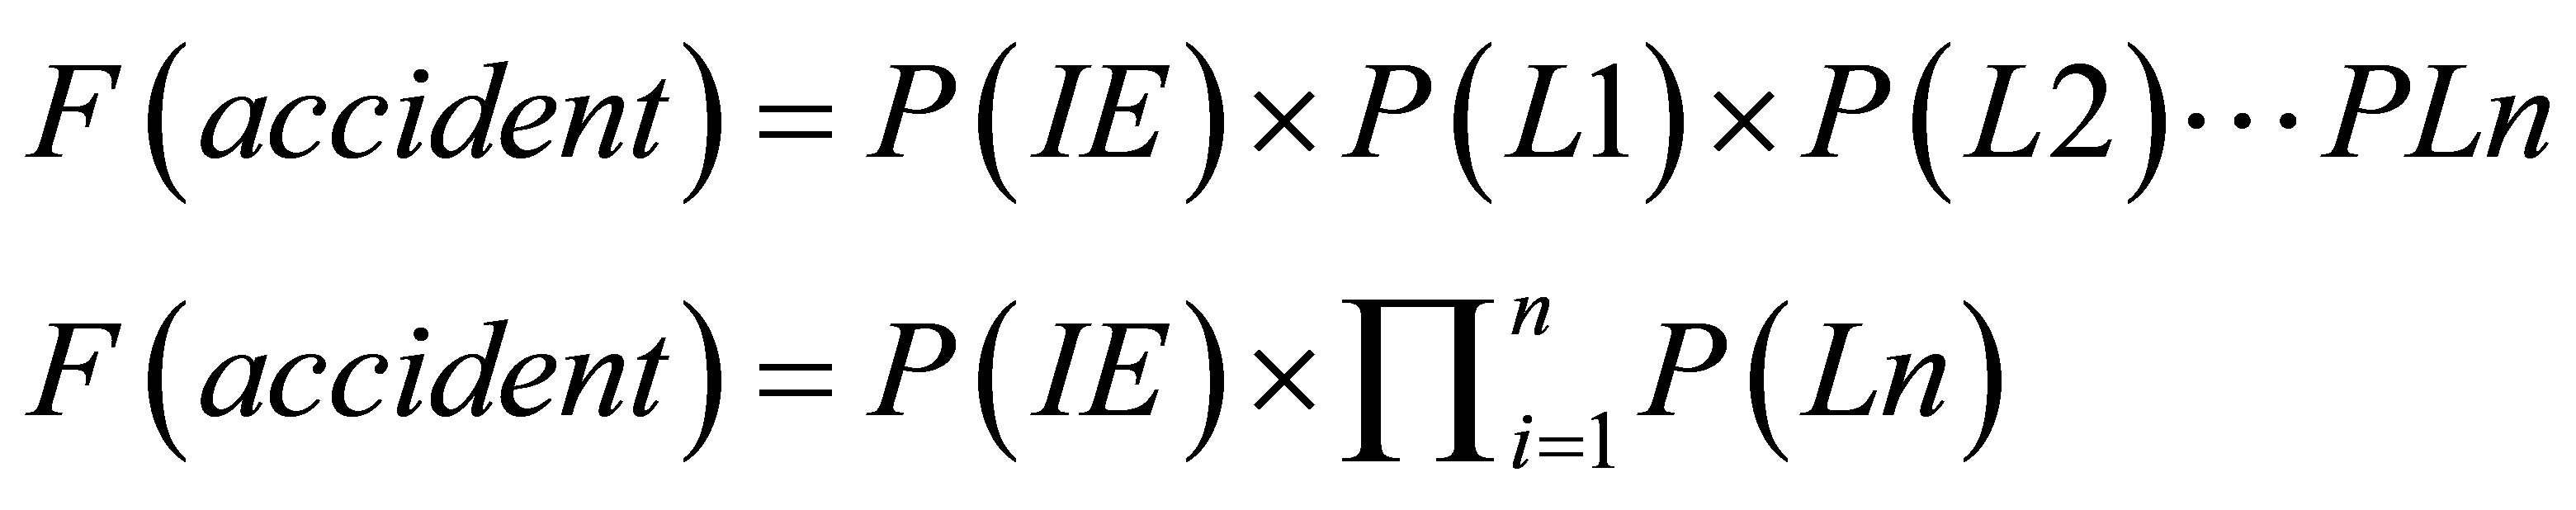
Accordingly to LOPA methodology is required to know the layer protection probabilities and frequency (or probability) of initiate event. In fact, to accident occur is necessary that initiate event set up and all layer of protection fail down. In order to find out its probability is necessary to multiply initiated event frequency with all layers probabilities as shown is equations below (IE = initiate event, Ln = layer of protection n, F = frequency, P = probability).

It is also possible to define the probability of accident occur when is defined triggered event probability as shown in equation below.
Afterwards, the frequency or probability of accident is combined with consequences resulting in risk that is compared with risk acceptable values.
In order to be clearest there will be made some additional comments about layer of protection. In fact, there are some types of layers of protection like:
Þ Operator intervention;
Þ Basic process control system (BPCS);
Þ Mechanical equipment integrity;
Þ Physical relief device;
Þ External risk reduction facilities.
The operator intervention is one of the most doubtful layers of protection and is not considered for all analysts as an effective layer of protection.
Notwithstanding that fact, an employee if prepared to act preventively may avoid an accident if interventions succeed correctly on time. In so many cases, is necessary to operator see visual alarms or hear it sound or even read some measure in operational equipment control. Such alarms are not considered a layer of protection because it not avoids accident but they are projected to support employee’s decision and alert then to unwanted unsafe process condition.
Even though existence of alarms and layers protections is necessary to have a low human error probability and to achieve that is necessary to trainee employees to emergency situation.
4. Fault Tree Analysis
After the text edit has been completed, the paper is ready for the template. Duplicate the template file by using the Save As command, and use the naming convention prescribed by your journal for the name of your paper. In this newly created file, highlight all of the contents and import your prepared text file. You are now ready to style your paper.
In 1960s US air force applied FTA (Fault Tree Analysis) studies of Launch Control system on it first application, then Boeing Company recognized the value of this tool and lead a team to apply such methodology in commercial aircraft design project. In 1966 Boeing developed a simulation program called BACSIM for the evolution of multiphase Fault Tree Analysis [7].
The FTA (Fault Tree Analysis) Methodology is an appropriated approach like LOPA and ETA (Event Tree Analysis) to assess combined event which triggered unwanted top event and may cause an accident. Despite similar characteristics in Fault Tree Analysis is enabling to assess many combinations of events which triggered top event causes. In some cases, Fault Tree is input for some event probability calculation in LOPA or ETA diagram. This approach is known as Hybrid Risk analysis and required a high level of information about hazard assessed.
The main objective of FTA is define the probability of top event occur and show it vulnerabilities relating minimum cut sets. In other words, is to assess event combination which triggers Top Event. The mathematics statics concept application is Boolean methods which consider possibility for two or more events occur simultaneously or not and trigger top event. In first case, if one top event depends on many events occurrence to be triggered such event probability is result from multiplication of events probability. In second case, if only one event is enough to top event be triggered the top event probability result from sums of events probabilities based on Bayesian method. Those two cases are represented in equations below.
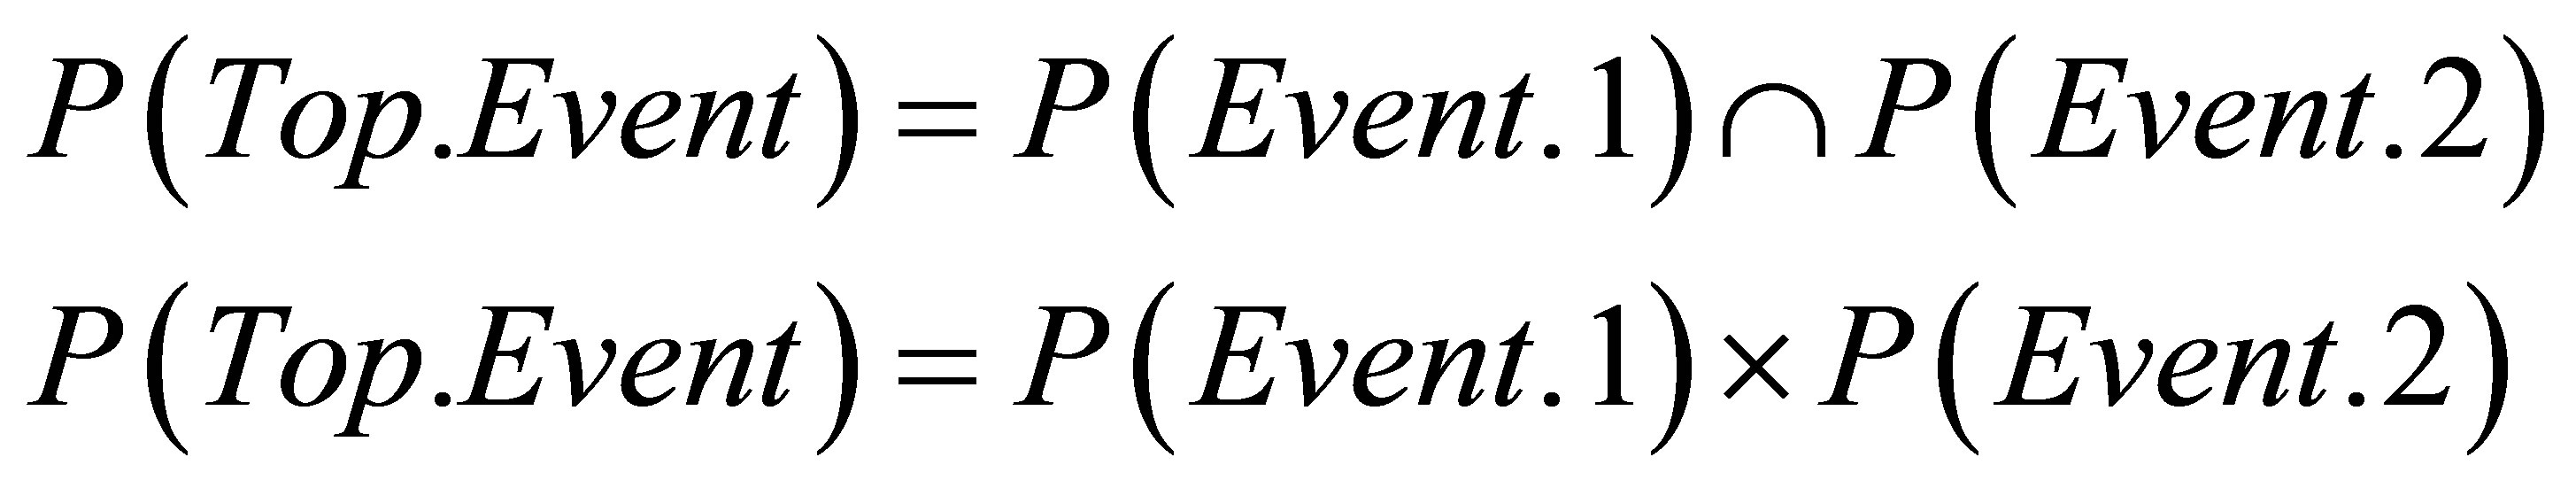
Or
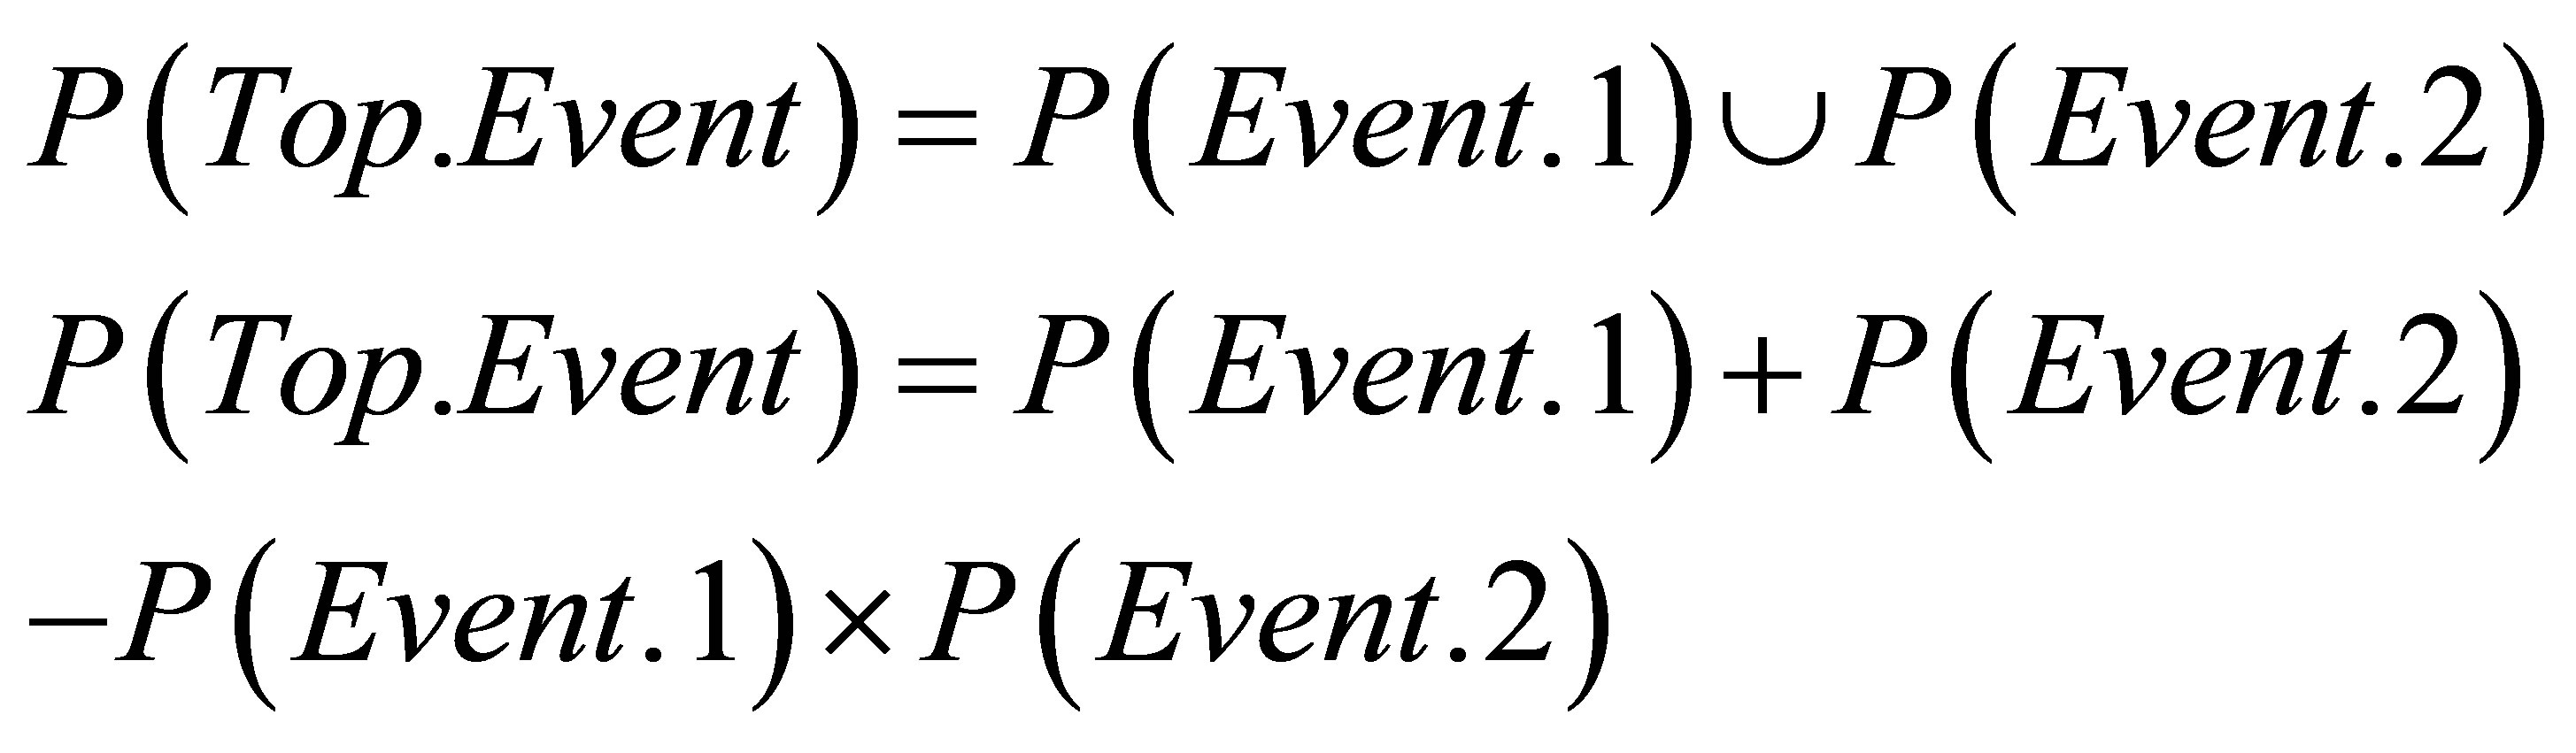
Is this two cases, there are basically two gates which represent each situation, “and “on first case and “or” in second case as show in Figure 2, furthermore there are top event and basic event.
Those symbol are the simplest representation, there are other types which is more appropriated to other types of combination among different events as instance at least two of five events (K/N). In fact FTA is inverse of Diagram Block methodology which regards blocks in series or in parallels configuration depends on impact caused in system assessed.
The FTA is build up from the TOP to the base regarding events combinations depends on in formations available. In some cases, specialist opinions about events probabilities are regarded to succeed FTA or calculate based on historical data. An example of FTA is a tank explosion comprised by six basic events and gates as represented in Figure 3.
The FTA basic events are:
E0 = BPCS failure;
E1 = Manual Valve failure;
E2 = Increase of flow to tank;
E3 = Retention valve inlet tank;
E4 = Bypass valve failure;
E5 = Relief valve failure.
The top event occurs if occur event 0 and 1 and occur event 2 and 3 and also occur event 4 or 5. In other words, is necessary occur failure in BPCS and operator do not close manual valve, in addition is required that increase flow of product to tank and retention valve failure. Moreover, bypass valve or relief valve have to fail down.
As mentioned before is necessary to have event probabilities values and it possible to have discrete values or continues probabilities. In case of continuous values of probabilities to each event is regarded PFD to each event as shows in equation below.
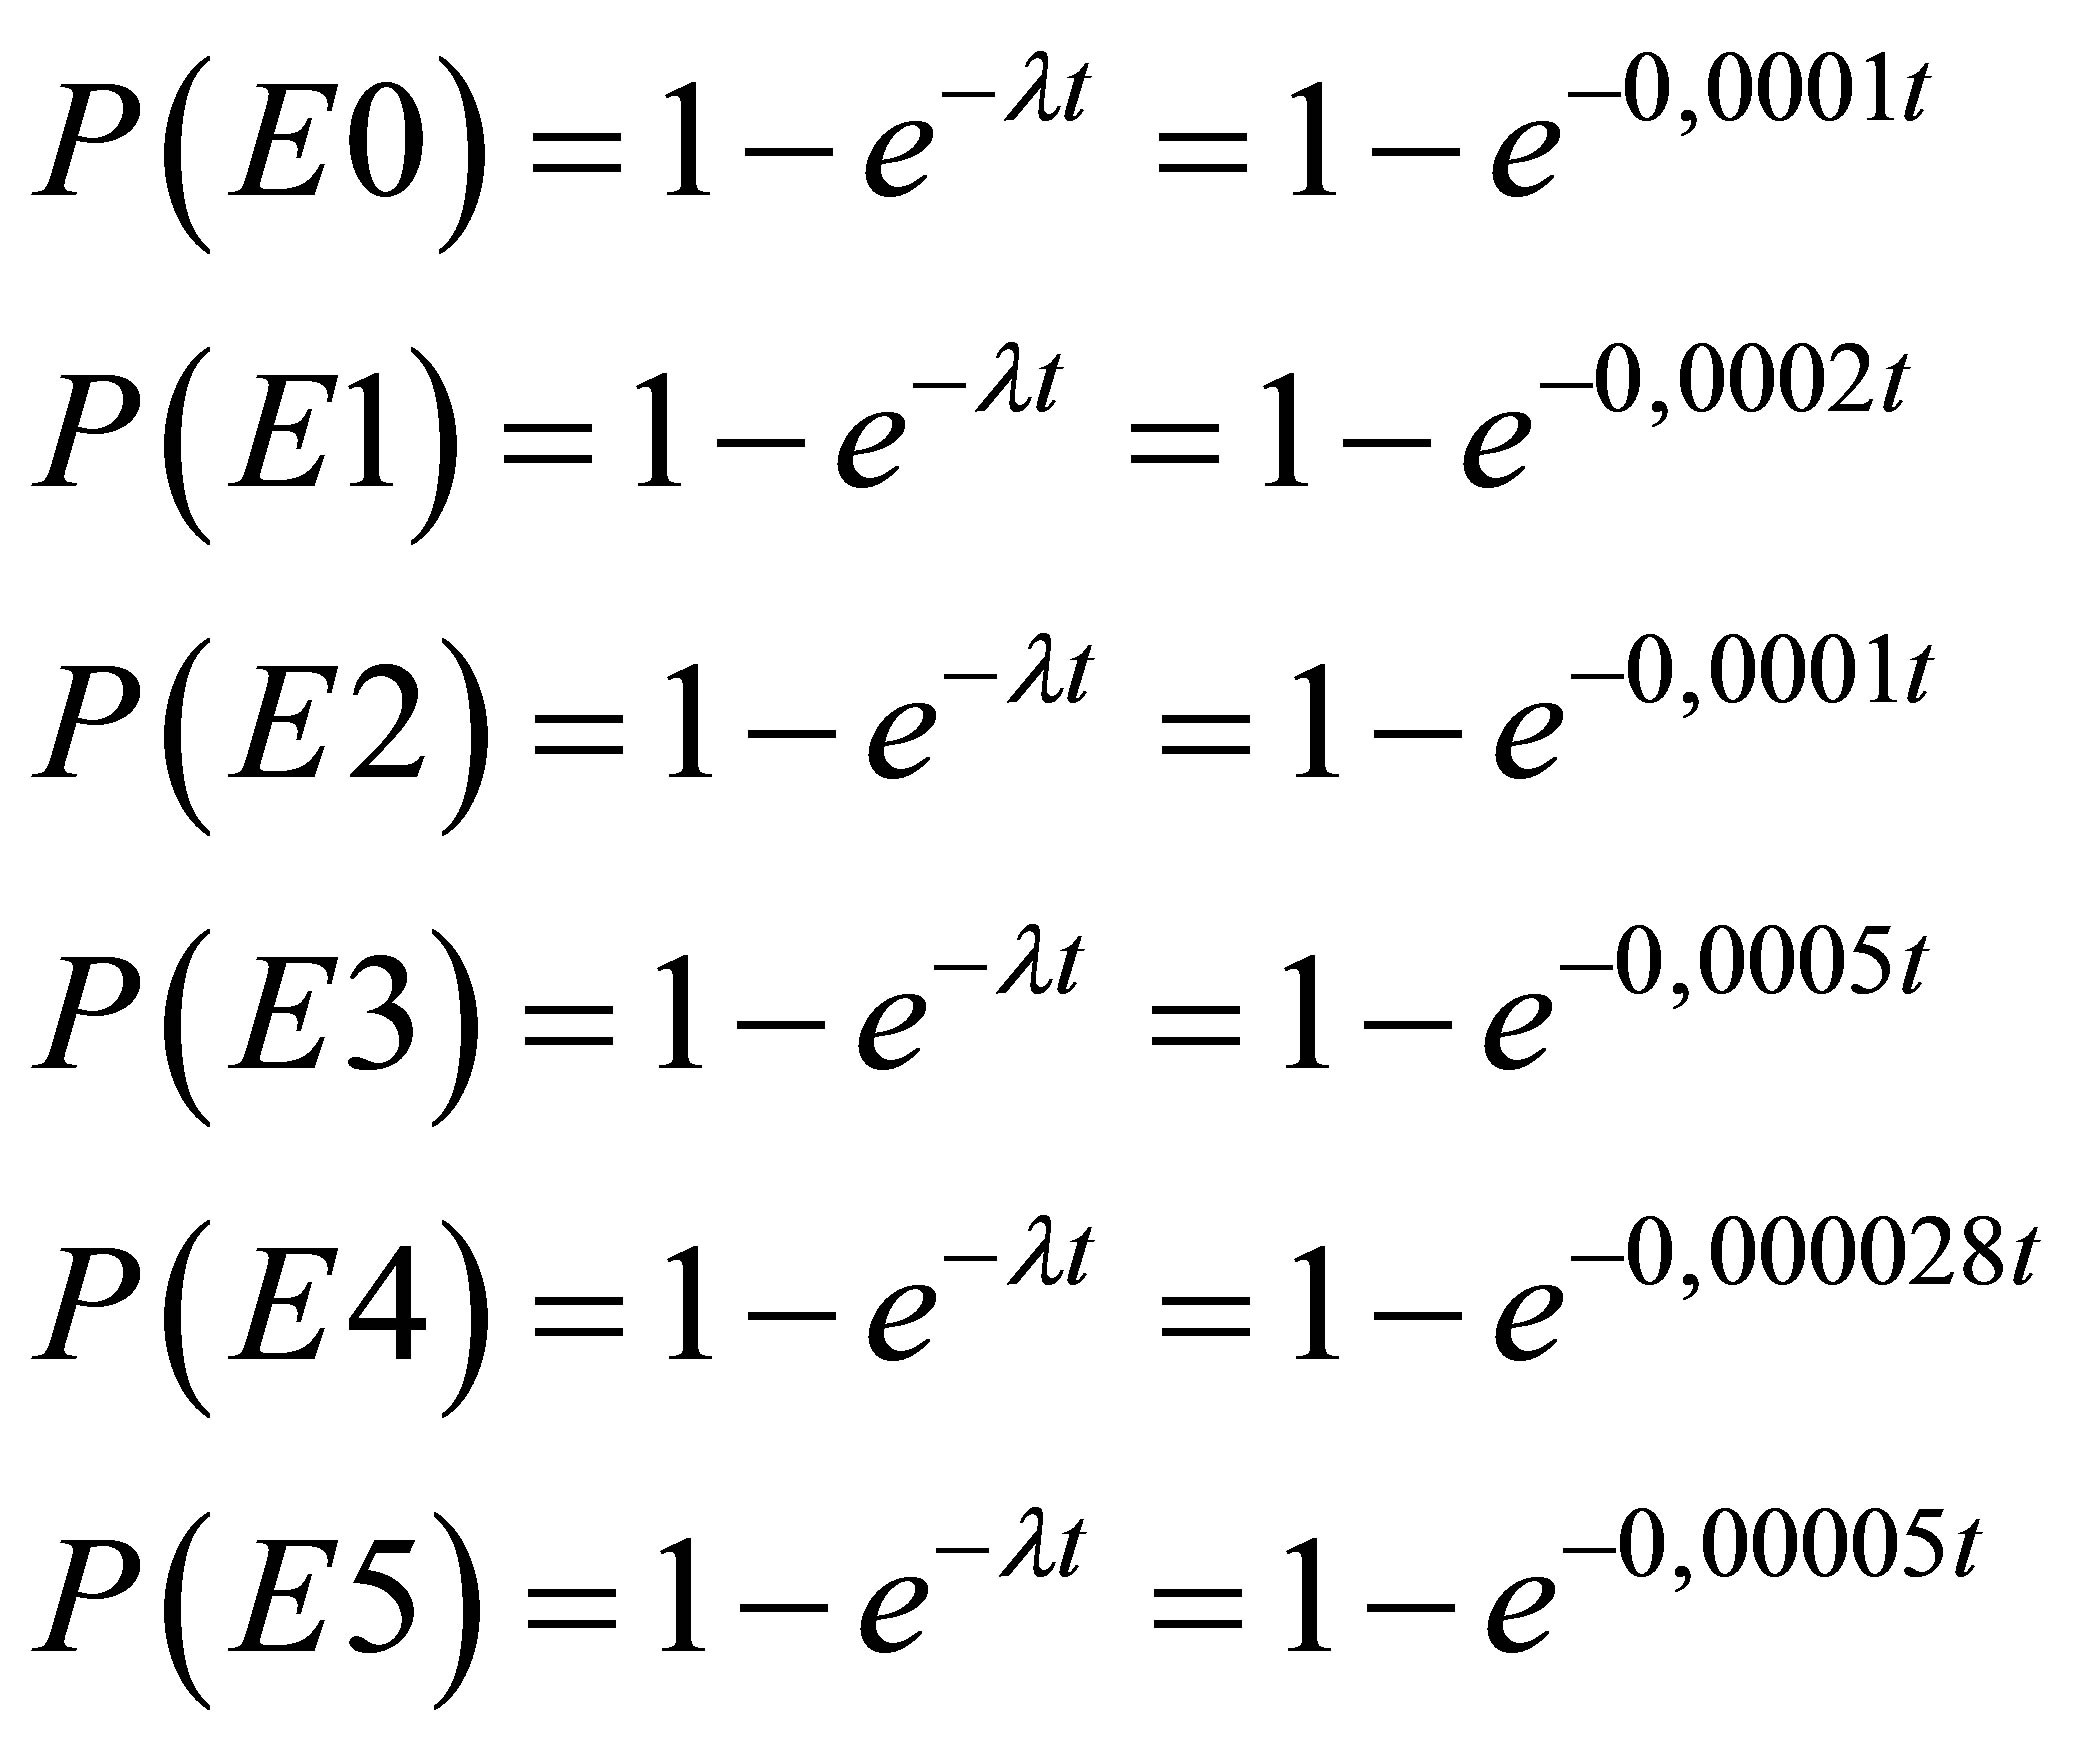
As doing so, simulating FTA, after one year there is 3.1% that Tank explode. Its permit manages risk, it means base event in order to avoid top event. The remarkable point is to stand that there’s not allowed to repeat any event in FTA. In some case, makes Fault Tree diagram configuration might be complicate. Unfortunately, on Brazilian Oil and Gas industry, on most of cases, the FTA is not included in Preventive Analysis like other risk analysis tools but by the other way round, it may be utilized to support information about event probabilities as will be show in item 6.
5. Preventive Risk Analysis Method
Nowadays the usual methodology applied to assess risk in case of layer protection shutdown in Brazilian Oil and Gas industry is PRA. As mentioned before is a good risk analysis tool because employees are familiar with that and it is easy to be implemented. By the other way round, it’s not possible to know quantitatively if risk is under control or not after preventive actions implementation.
The second remarkable point is that in some cases consequences are clear and others are not but even not clear it’s possible to check some information in historical accident data or risk analysis reports. The real problem is estimate the probability of unwanted event happens that depends on initiate event combined with layer protection failures. Because of that, most of cases the analyst are conservative in their decisions and super estimate risk. In this case, the plant is shut down to avoid catastrophic accident but in fact it would be not necessary. The opposite also happen and system operates under not acceptable risk level when layer of protection is unavailable.
In order to reckon the probability of unwanted event occur with and without layer of protection is propose to use layer of protection methodology.
With probability of unwanted event is possible to find the risk level and check if it is acceptable or not. The proposed preventive methodology to support decision in case of layer protection is unavailable due to maintenance or failure is based in following steps:
1) To carry out PRA of system with layer of protection to define risk qualitatively;
2) To carry out LOPA analysis to find out probability of accident without layer of protection;
3) To check if risk without layer of protection is acceptable;
4) If risk is unacceptable, propose some preventive action or new layer protection to reduce risks to acceptable region;
5) If not possible to reduce risk to acceptable condition, shutdown plant.
Based on those five steps, it’s possible to take better decision when layer of protection fail or is necessary to make preventive maintenance in layer of protection. Figure 4 shows risk analysis methodology to support decision to shut down plant or not.
Actually there are two approaches to compare risk without layer protections with tolerable risk. The first one is reckon the frequency of accident without layers of protection and combine with consequence based in risk matrix. The second way is compare the final risk with Individual Risk (ALARP) is cases where consequences of deaths is estimated by consequences and effect analysis.
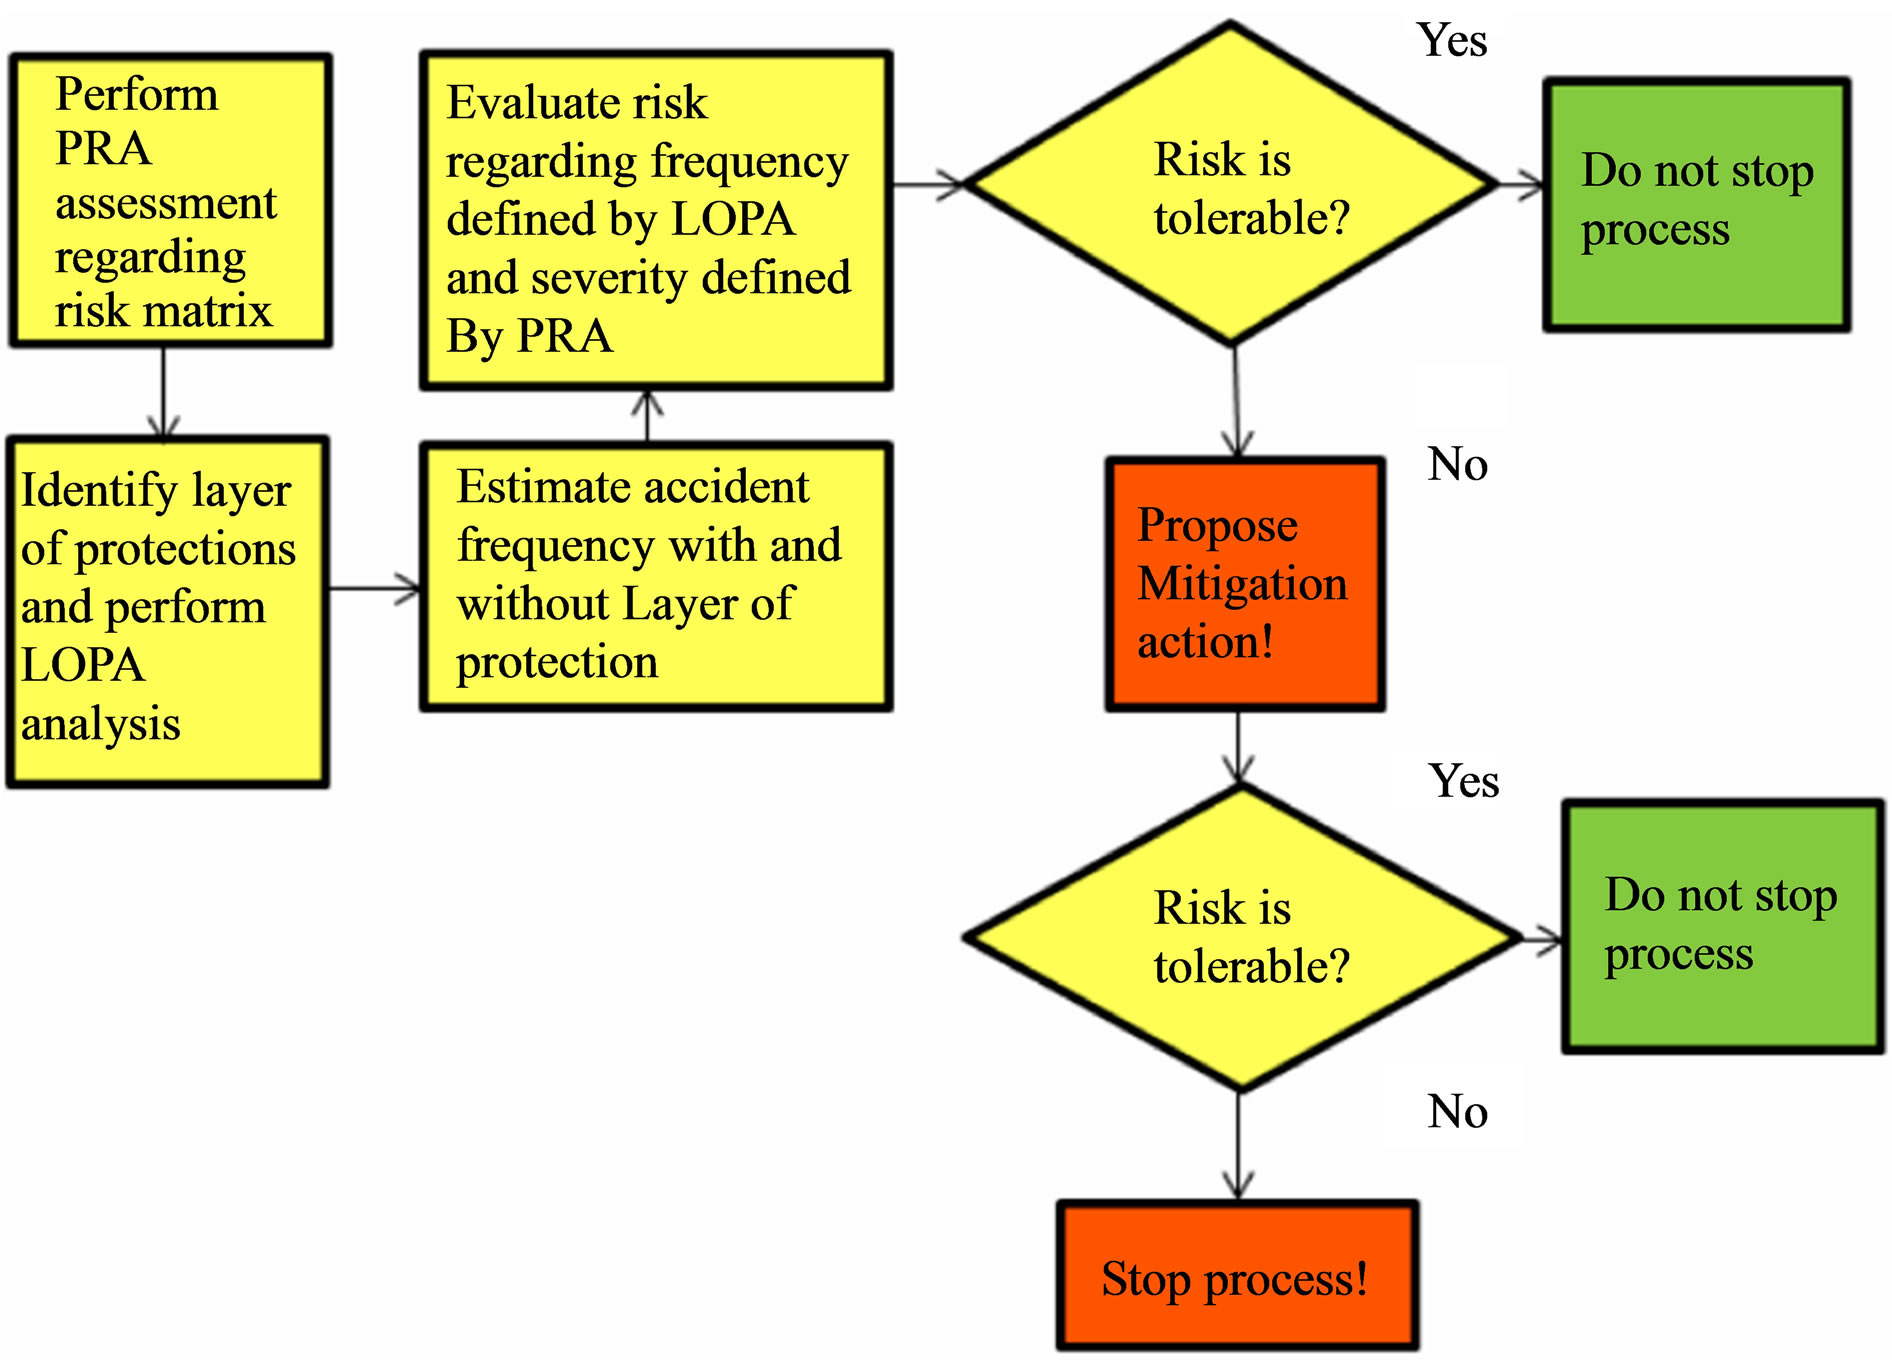
Figure 4. Layer protection risk analysis methodology.
On first case, the first step is carry out PRA based in qualitative risk matrix and define risk. Further, the probability of unwanted event without layer of protection will be defined using LOPA methodology and the new risk will be assessed on risk matrix.
On second cases the frequency defined in LOPA is multiplied by expected number of deaths estimated on Consequence and effects analysis and compare such risk with individual risk tolerable values.
A simple example is, when occur excess of gas on furnace, there is unsafe condition and to avoid furnace explosion layer of protection like human action (P(f1) = 0.1), Manual Valve (P(f2) = 0.01) and BPCS(P(f3) =  are triggered. Such incident (excess of gas on furnace) has a frequency of
  per year. Thus, the frequency of explosion is:
f (Furnace explosion) = f(excess of gas) × P(f1) × P(f2) × P(f3)
f(Furnace explosion) = 1 × 10−4 × 0.1 × 0.01 × 1 × 10−4 = 1 × 10⁻⁸
If such accident happen is expected at least ten deaths into plant so based on risk matrix on Figure 5 the risk is moderate (severity category III and frequency category A).
Whenever risk is evaluated and achieve acceptable level based on risk matrix (Figure 5) or individual risk (Figure 6) the activity can be carry out and is not necessary to input additional layer of protection or shut down plant and stop production. Such methodology has the main objective to avoid Plant or operational activities take place in unacceptable risk level.
Based on individual Risk criterion risk is 1 × 10⁻⁷ (acceptable) as shown Figure 6.
Risk = 10 (deaths) × 1 × 10⁻⁸ (frequency)) = 1 × 10⁻⁷
In case of maintenance or shutdown in BPCS for example, the furnace has to be stopped because the risk is not acceptable by individual risk criterion. Without BPCS the frequency of accident is:
f(Furnace explosion) = f(excess of gas) × P(f1) × P(f2) = 1 × 10−1 × 0.1 × 0.01 = 1 × 10⁻⁴
Individual Risk = 10 × 1 × 10−4 = 1 × 10⁻³.
That is on unacceptable region as shown Figure 6. By the other way round, if regards values on risk matrix on Figure 5 the risk can be considered moderate (severity Category—III and frequency category A). That’s shows that more than one risk criterion must be took into account whenever it’s possible in order to take more reliable decision.
The remarkable point to consider is that whenever decision are take based on risk matrix is possible to consider tolerable risk in order to not shut down Plants. When LOPA is carried out the frequency is calculate and not estimate qualitatively, so risk has more realistic value.
In addition to layer of protection, the contingency system also takes some influence is risk level because if those systems are on preventive maintenance or fail, the consequence would get worse as expected if accident happen. It means that, consequence without contingency system would get worse the risk level. Therefore, when there will be maintenance or shut down in contingency system (splinkers, fire system pumps, and chemical showers) it necessary assess consequence which if get worse without contingency maybe would take influence in risk level. Figure 7 summarizes steps used to assess risk in case of maintenance or failure in contingency

Figure 7. Contingency system risk analysis methodology.
system.
Similar to layer of protection case, whenever risk is evaluated and achieve acceptable level based on risk matrix (Figure 5) or individual risk (Figure 6) the activity can be carry out and is not necessary to input additional layer of protection(contingency) or shut down plant and stop production. Such methodology has the main objective to avoid Plant or operational activities take place in unacceptable risk level.
6. Fire Protection Pumps System Case Study
An example of application of such methodology was on preventive maintenance in fire pump system in refinery. That contingency system provides water to combat fire and if it’s failure or in maintenance when fire occur the consequence will be worse, in other words, based in matrix in Figure 1 the consequence goes from critical to catastrophic. Aware this fact, the maintenance team will keep system available during maintenance service and take out only one pump for maintenance. The fire protection pump system is comprised for five pumps if electric system failure tree pumps stop. At least one pump is required to keep fire system pump available. In order to define fire pump system availability the Dynamic Fault Tree Analyses were applied to find out if fire pumps system availability and probability of failure without one pump. In order to model fire pump system availability a dynamic Fault Tree Analysis was made up as show Figure 8" target="_self"> Figure 8.
The Dynamic Fault Tree Analysis is a quantitative risk methodology applied in combination of event which cause unwanted event that in this case is fire pump system unavailable. on top event, to fire pump system be unavailable is necessary failure in Electric energy supply and failure two others pumps (D and E). Pump E is active redundancy of Pump D. The failure pumps rates is 0.5 per year and electric system failure rate is 1 per year. The Dynamic Fault Tree probability of failure is described by equation.

P(Fire Pump System Out) = Top event failure probability;
P(FES) = Failure Electric System probability;
P(PD) = Pump D failure probability;
P(PE) = Pump E failure probability.
Regarding 2 hours to reestablish Electric Energy System if it shut down and 8 h for each pump the Simulations on Figure 9 shows system has 100% of availability until 5 years despite pumps failures.
If one of pump is under maintenance service (Pump D) and it is out for 1 h (maintenance service time duration) on 4th year on 11th month is necessary to check System fire pump availability and the probability of failure. The Figure 10 below represents the fire pumps system with pump D in maintenance.
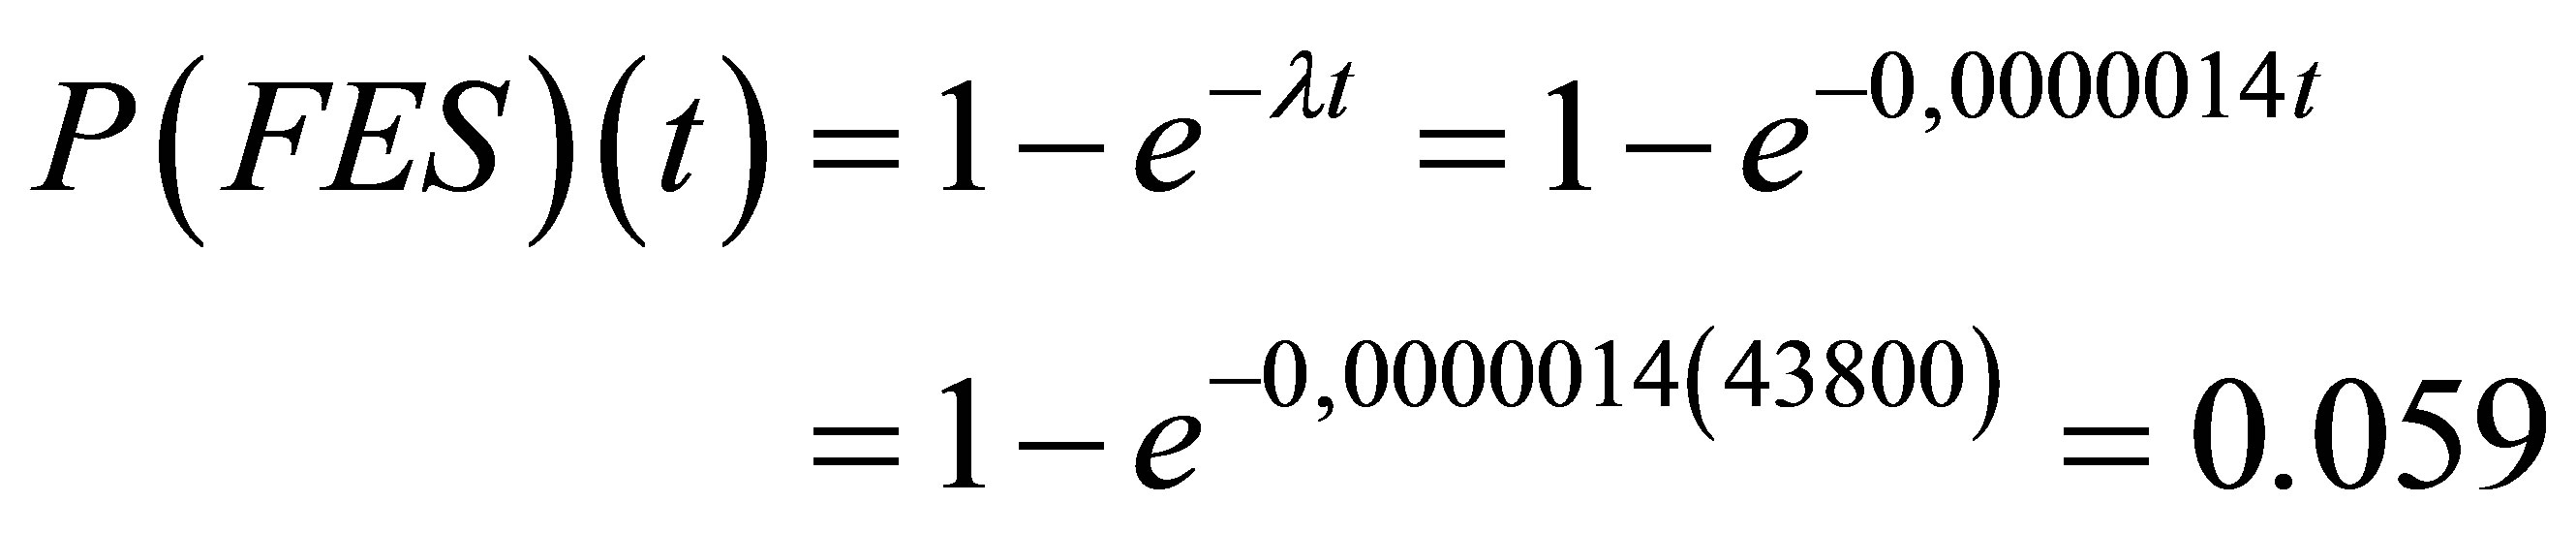
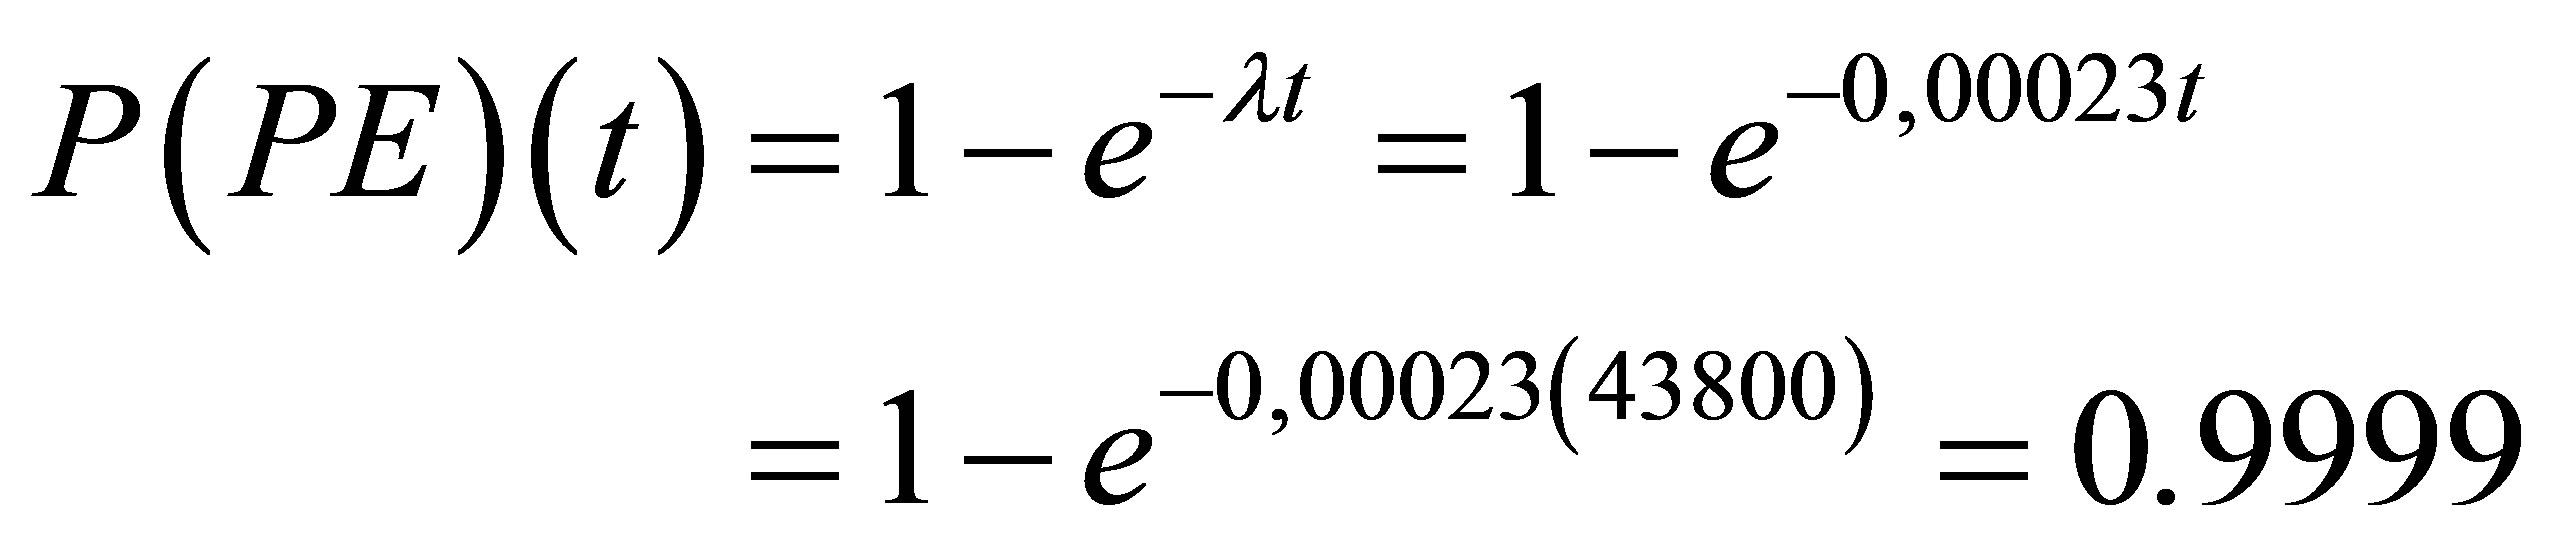
In this case were regarded exponential functions to represent PDF failure along time to both pumps as previous simulation and also to electric system. Thus, the Dynamic Fault Tree probability of failure is described by equation.
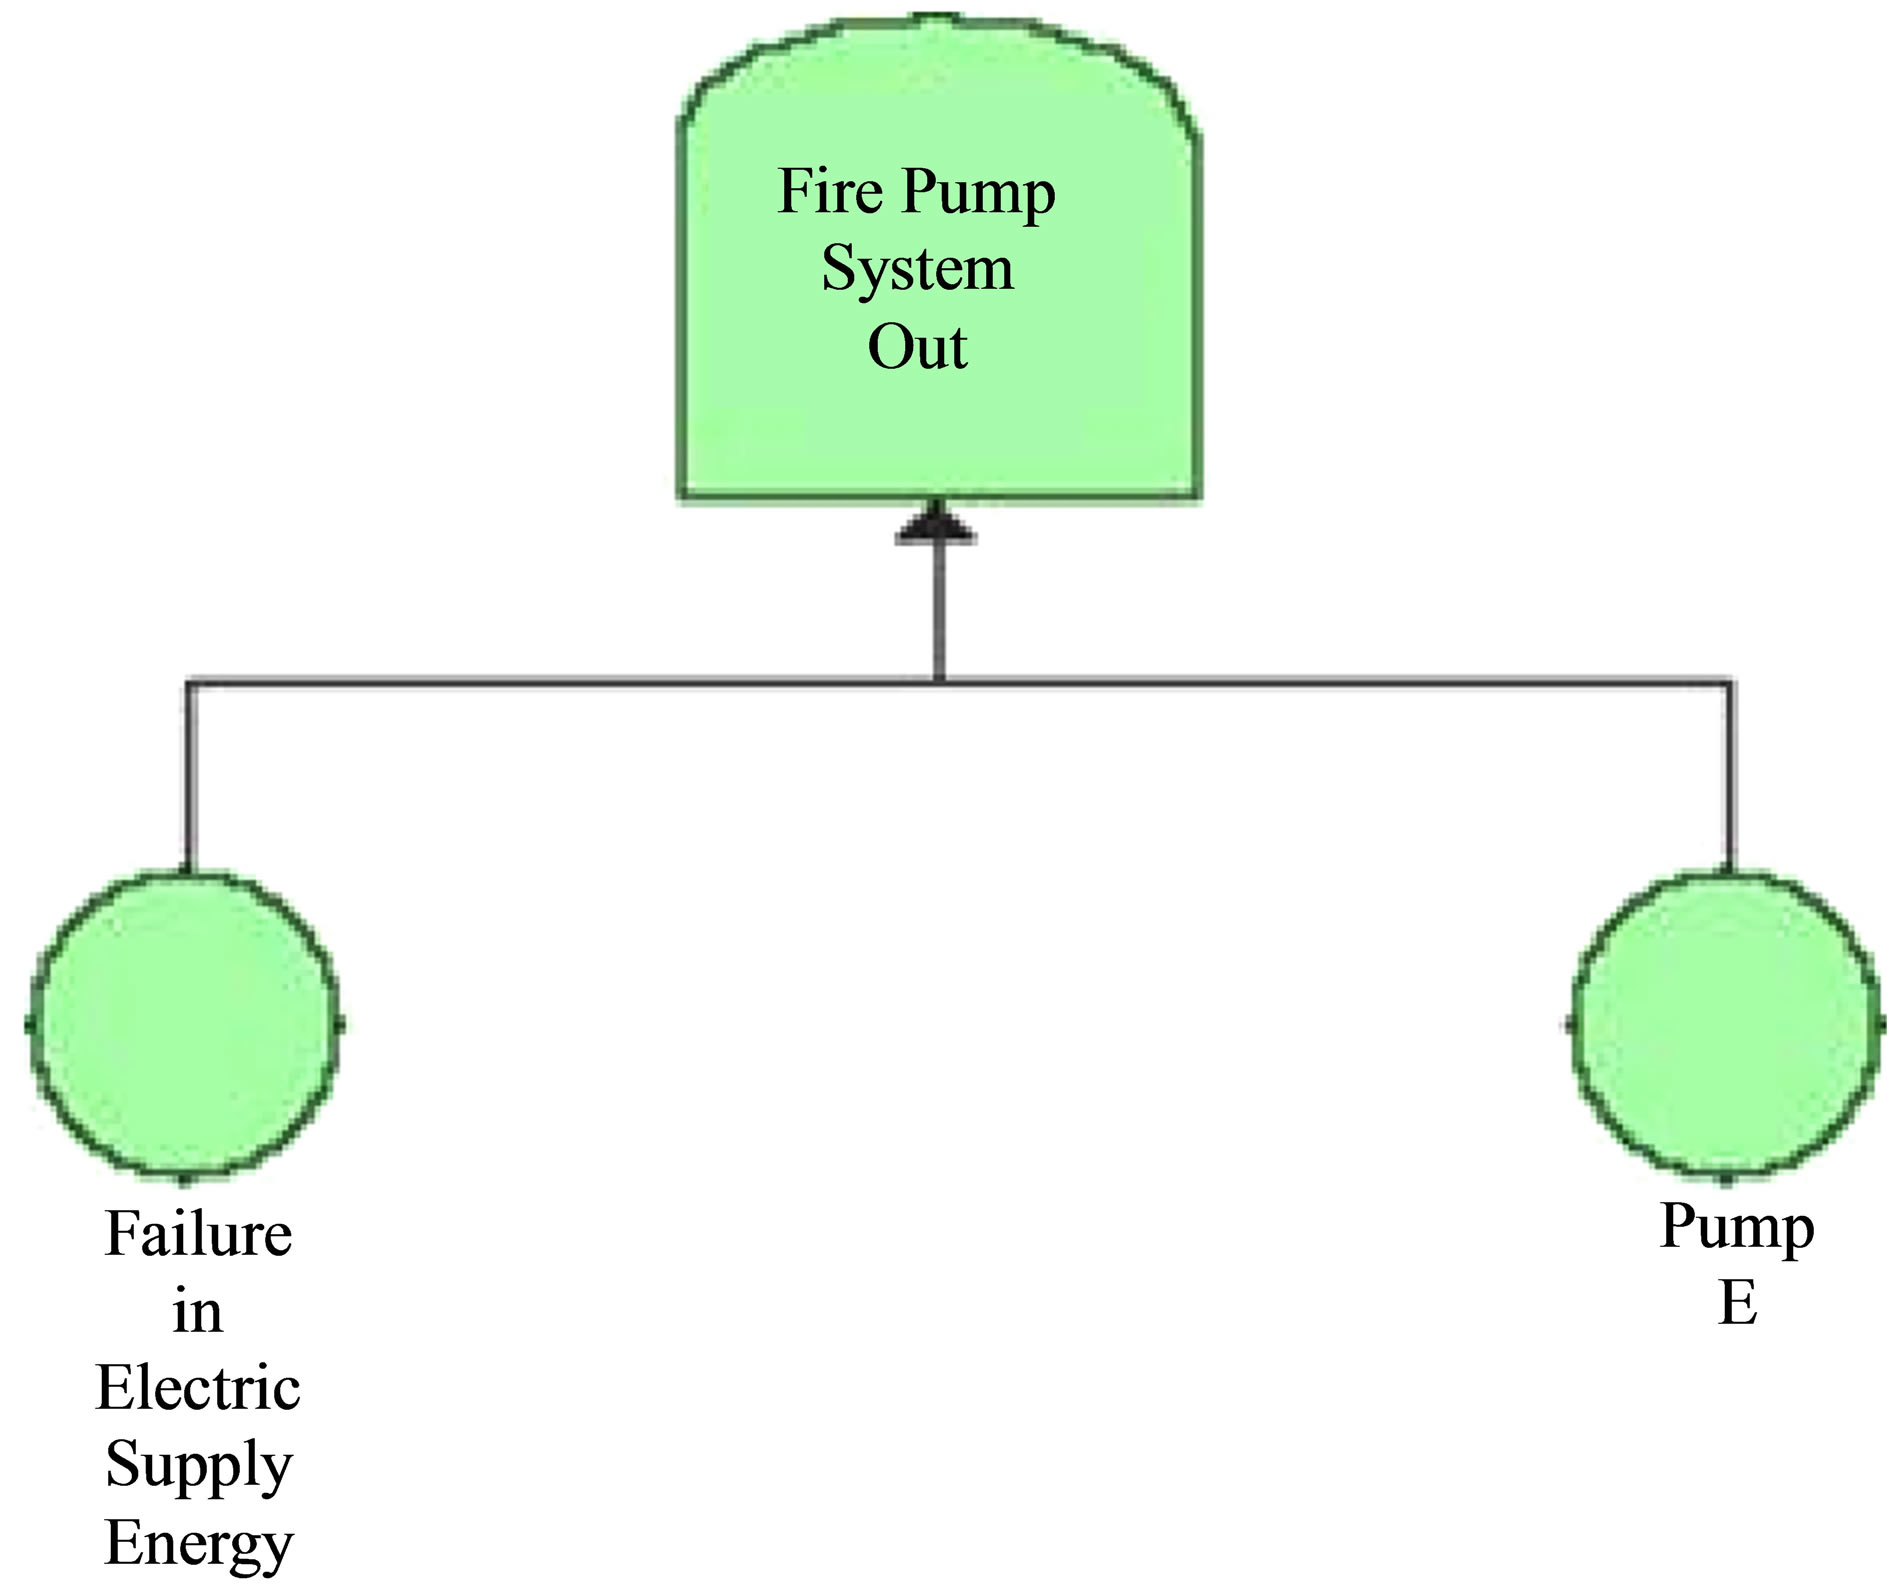
Figure 10. The fire pump system without pump D.
P(Fire Pump System Out) = Top event failure probability;
P(FES) = Failure Electric System probability;
P(PE) = Pump E failure probability.
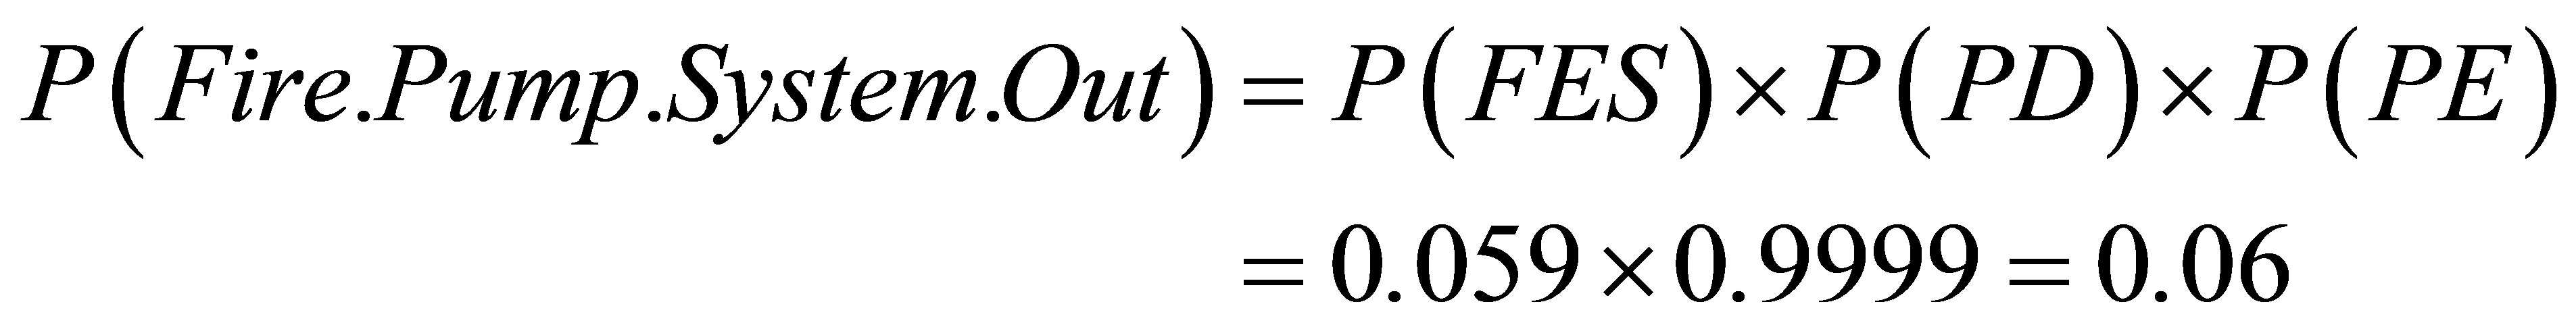
In terms of failure probability of System, the situation is the same with or without pump D. Regarding maintenance action on pump D performed on 11th month of 4th year and takes only one hour, it’s also make no difference because system will have 100% of availability as well as with pump D as shows Figure 11 and if some accident occur, the consequence will not get worse than expected.
The final conclusion is that maintenance in pump D is allowed because the whole fire pump system has 100% availability in 1 h (maintenance service duration) and probability of failure is similar with or without pump D (0.06).
7. Conclusions
The preventive Risk Analysis Methodology propose will provide information to employees to make better decisions in respect to unsafe conditions when layer of protection or contingency system fails or is out of operation due to maintenance service. The huge challenge nowadays in Brazilian Oil and Gas industry is to achieve safe behavior and that employees internalize preventive safety
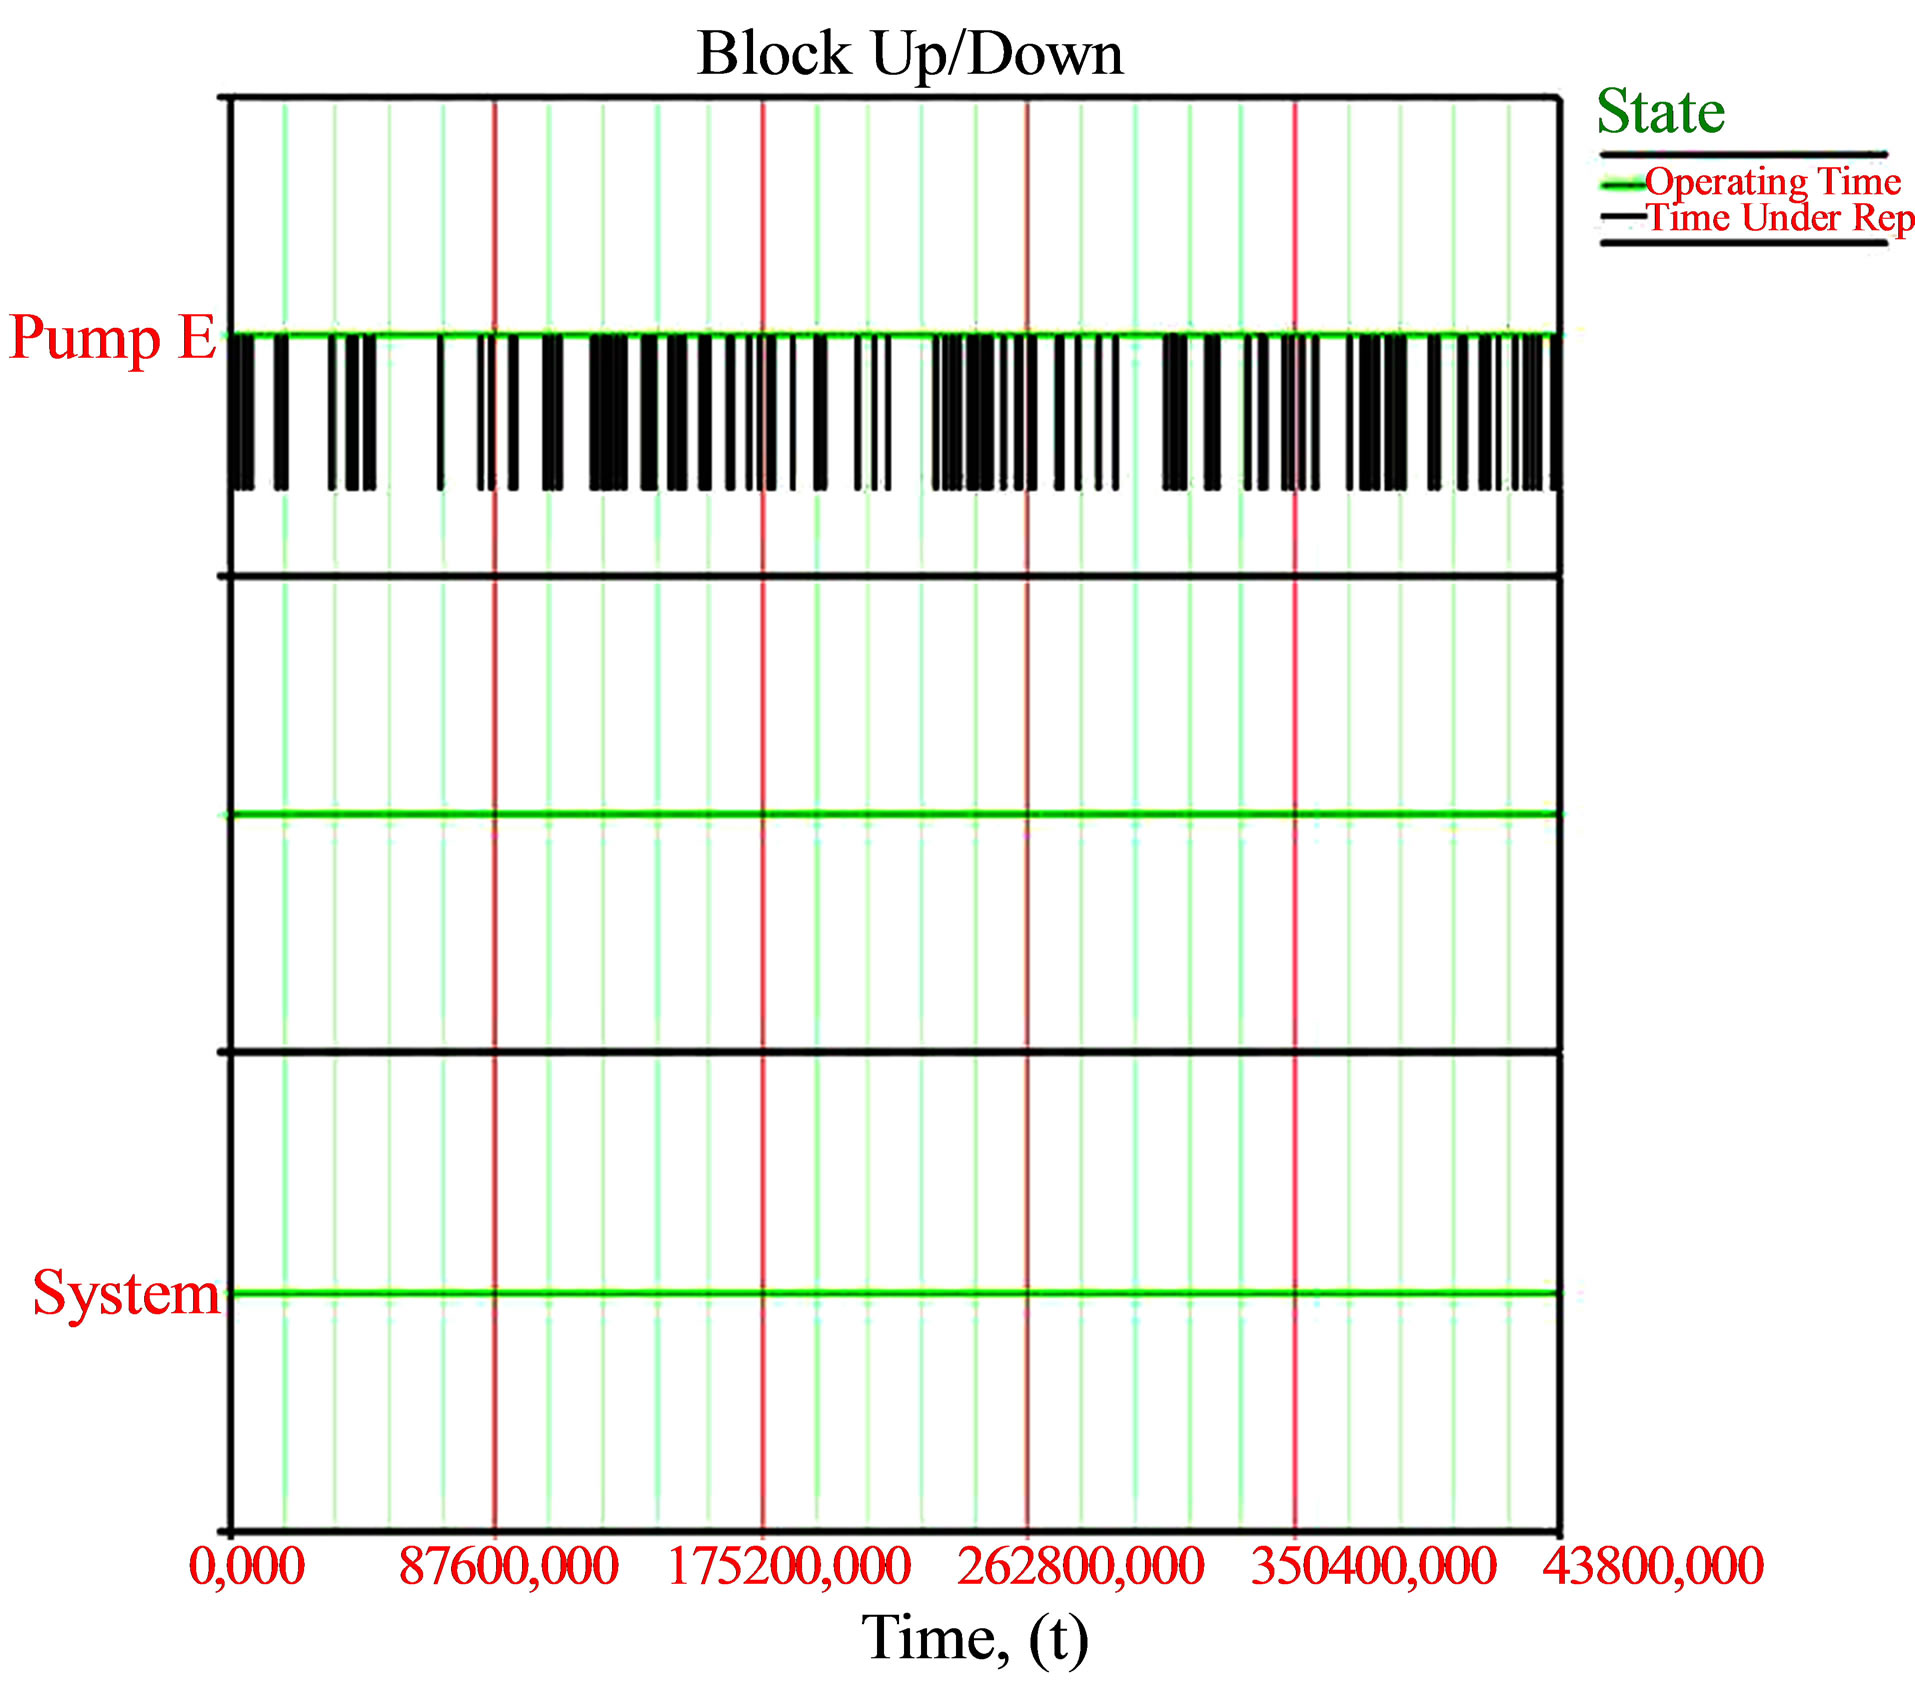
Figure 11. Fire pump system simulation (without pump D).
value to apply such methodology.
Despite some difficulties in the beginning application cases, regarding that such methodology and risk analysis tools like PRA and LOPA do not spread out in all workforce, most of employees recognize that it is a feasible methodology and it’s good to keep process under control. Whenever such applied methodology is required to formalize the analysis using forms and reports in order to supply future analysis for employees who work on shift they have not so many conditions in many cases to carry out a complete risk analysis. The first methodology version is being applied and improvement will be carried out in a long time. It is mostly linked to quantitative methods and using more individual risk criterion than risk matrix.
It is expected that such analysis be carried on following years providing historical data in which situations are allowed operating without layer of protection.
The exponential PDF applied on fire pumps was just to demonstrate the application of preventive Risk Assessment Methodology case study. In real case, life cycle analysis is carried out and the most common PDF to represent pump failures’ modes is normal (bearing, shaft and seal) or Gumbel (axel and impellers).