Geoelectrical Investigation of a Proposed Dam Site in a Sedimentary Terrain: Case Study of Aba River at Amapu-Ideobia, Akanu Ngwa Southeastern Nigeria ()
1. Introduction
There are various approaches available to source for information about the subsurface, and the best is undoubtedly the direct observation of earth materials. However, this approach is of course rarely possible to the extent that people would like [1]. A much more common scenario is the need to acquire physical measurements on the surface and complement these measurements with whatever direct geological observations are available to deduce the subsurface geology. Surface electrical resistivity surveying is based on the principle that the distribution of electrical potential in the ground around a current-carrying electrode depends on the electrical resistivities and distribution of the surrounding soils and rocks. The usual practice in the field is to apply an electrical direct current (DC) between two electrodes implanted in the ground and to measure the difference of potential between two additional electrodes that do not carry current [2]. The electrical resistivity of rock is a property which depends on lithology and fluid content. The resistivity of identical porous rock samples vary considerably according to the salinity of the saturating water [3]. The vertical electrical resistivity sounding method (VES) is depth sounding galvanic methods and used for determining resistivity of the rocks. Electrical resistivity technique surveys have been employed for many years in routine hydrogeological investigation. This technique is particularly useful in the area of complex geology [4], in archeology, and in other shallow subsurface investigations [5]. A geoelectric survey has been carried out along the proposed axis of an earth dam across the Aba river at Amapu-Ideobia. The survey is aimed at determining the downward and lateral trends of any rock layers or units along and near the proposed dam axis and deducing the possible structures that may enhance workable design of the dam.
2. Study Area
Amapu-Ideobia is located at about 20 km southeast of Aba while the proposed dam axis is located at about 7 km east of Ugwunagbo Local Government Headquarters (Figure 1).
The southwest end of the dam axis is located on latitude 5˚1.127'N and on longitude 7˚24.090'E, the north eastern end of dam is located on latitude 5˚1.393'N and on longitude 7˚25.145'E. Although the project area is located in two communities in two different Local Governments, accessibility is only through Amapu-Ideobia in Akanu Ngwa. The same topographic set-up that exists around Ogbor Hill area in Aba metropolis seems to exist at Amapu-Ideobia in Akanu Ngwa, where the general
level terrain in Aba area is truncated by the Aba river valley. The only low land area is at the river course. However the southwest end of the proposed axis is lower in heights above sea level than the northeast end as shown in Figure 2. The project area displays a trough like structure with the south west end ranging in heights from 78 feet (23.78 m) to below 65 feet (19.8 m) at the southwest high water point. At the northeast end, the heights range from below 67 feet (20.42 m) at the north east high water point to 115 feet (35 m). Thus there is an enhanced topography at the northeast end of 35 m over the 23.78 m at the southwest end (Figure 2). With nearly 5 m depth of the river at the central portion, the hyperbolic structure is hereby displayed. It is also observed that the river course is nearly 200 m across (Figure 2).
While there seems to be steep fall from the south west crest to the lower high water point near the course, the river seems to stretch out toward the northeast end (A and B points on Figure 2). Aba area, in general, and Amapu-Ideobia area in particular, are underlain by rock units of the Benin Formation which is a Quartenary event in Nigeria. While in other areas the Formation is made up of shales, sandstones and mudstones, in Aba area, the units are mostly gravely sand and silty alluvial matter. This is common in the Aba water side area where gravel had been quarried in the early 1950s up to the recent. From the trial pits made, the area is ultimately underlain by loose gravely sand with high organic matter at the river course.
3. Materials and Methods
The study involved the use of Electrical method. The Vertical Electrical Sounding (VES) array of Schlumberger was employed. The ABEM Terrameter model SAS

Figure 2. Topography along the Dam axis in relation to VES points.
4000 (Figure 3) was used in the field reading operation. It has three operating modes (Resistivity, IP, SP) in one complete unit. It is expandable to 2D/3D imaging and borehole tomography for a broad range of near surface geophysical applications. Scope of applications, data acquisition speed, and accuracy have defined the architecture of the ABEM Terrameter SAS 4000 model. Core electronics, such as the Signal Averaging System (a.k.a Signal Stacking) from which the ABEM Terrameter SAS derives its name, deliver accurate and dependable results at maximized speed thereby reducing field time. It has inbuilt productivity software, incorporates a sophisticated signal-averaging (or signal stacking) algorithm where consecutive readings are taken automatically and the results are averaged continuously to improve the accuracy of the measurements. In addition, the ABEM Terrameter SAS 4000 includes filters to remove noise from the incoming signal allowing natural and induced signals to be measured at extremely low levels with excellent penetration and low power consumption.
3.1. Theory
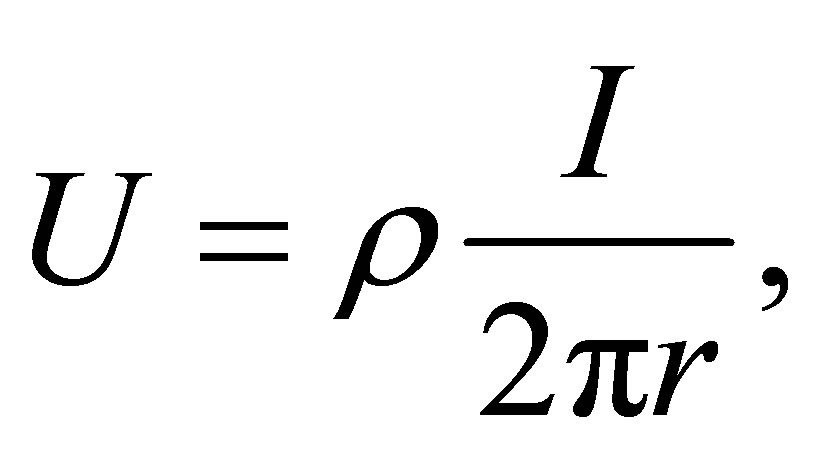
Data from resistivity surveys are customarily presented and interpreted in the form of values of apparent resistivity ρa. Apparent resistivity is defined as the resistivity of an electrically homogeneous and isotropic half-space that would yield the measured relationship between the applied current and the potential difference for a particular arrangement and spacing of electrodes. An equation giving the apparent resistivity in terms of applied current, distribution of potential, and arrangement of electrodes can be arrived at through an examination of the potential distribution due to a single current electrode. The effect of an electrode pair (or any other combination) can be found by superposition. Consider a single point electrode, located on the boundary of a semi-infinite, electrically homogeneous medium, which represents a fictitious homogeneous earth. If the electrode carries a current I, measured in amperes (a), the potential at any point in the medium or on the boundary is given by:
 (1)
(1)
where

Figure 3. ABEM Terrameter SAS 4000 Model.
U = potential, in Vρ = resistivity of the mediumr = distance from the electrode.
The mathematical demonstration for the derivation of the equation may be found in textbooks on geophysics, such as [6]. For an electrode pair with current I at electrode A, and -I at electrode B (Figure 4), the potential at a point is given by the algebraic sum of the individual contributions:
 (2)
(2)
where rA and rB = distances from the point to electrodes A and B
Figure 4 illustrates the electric field around the two electrodes in terms of equipotentials and current lines. The equipotentials represent imagery shells, or bowls, surrounding the current electrodes, and on any one of which the electrical potential is everywhere equal. The current lines represent a sampling of the infinitely many paths followed by the current, paths that are defined by the condition that they must be everywhere normal to the equipotential surfaces.
In addition to current electrodes A and B, Figure 4 shows a pair of electrodes M and N, which carry no current, but between which the potential difference V may be measured. Following the previous equation, the potential difference V may be written
 (3)
(3)
where UM and UN = potentials at M and N respectively.
AM = distance between electrodes A and M, etc.
These distances are always the actual distances between the respective electrodes, whether or not they lie on a line. The quantity inside the brackets is a function only of the various electrode spacings. The quantity is denoted 1/K, which allows rewriting the equation as:
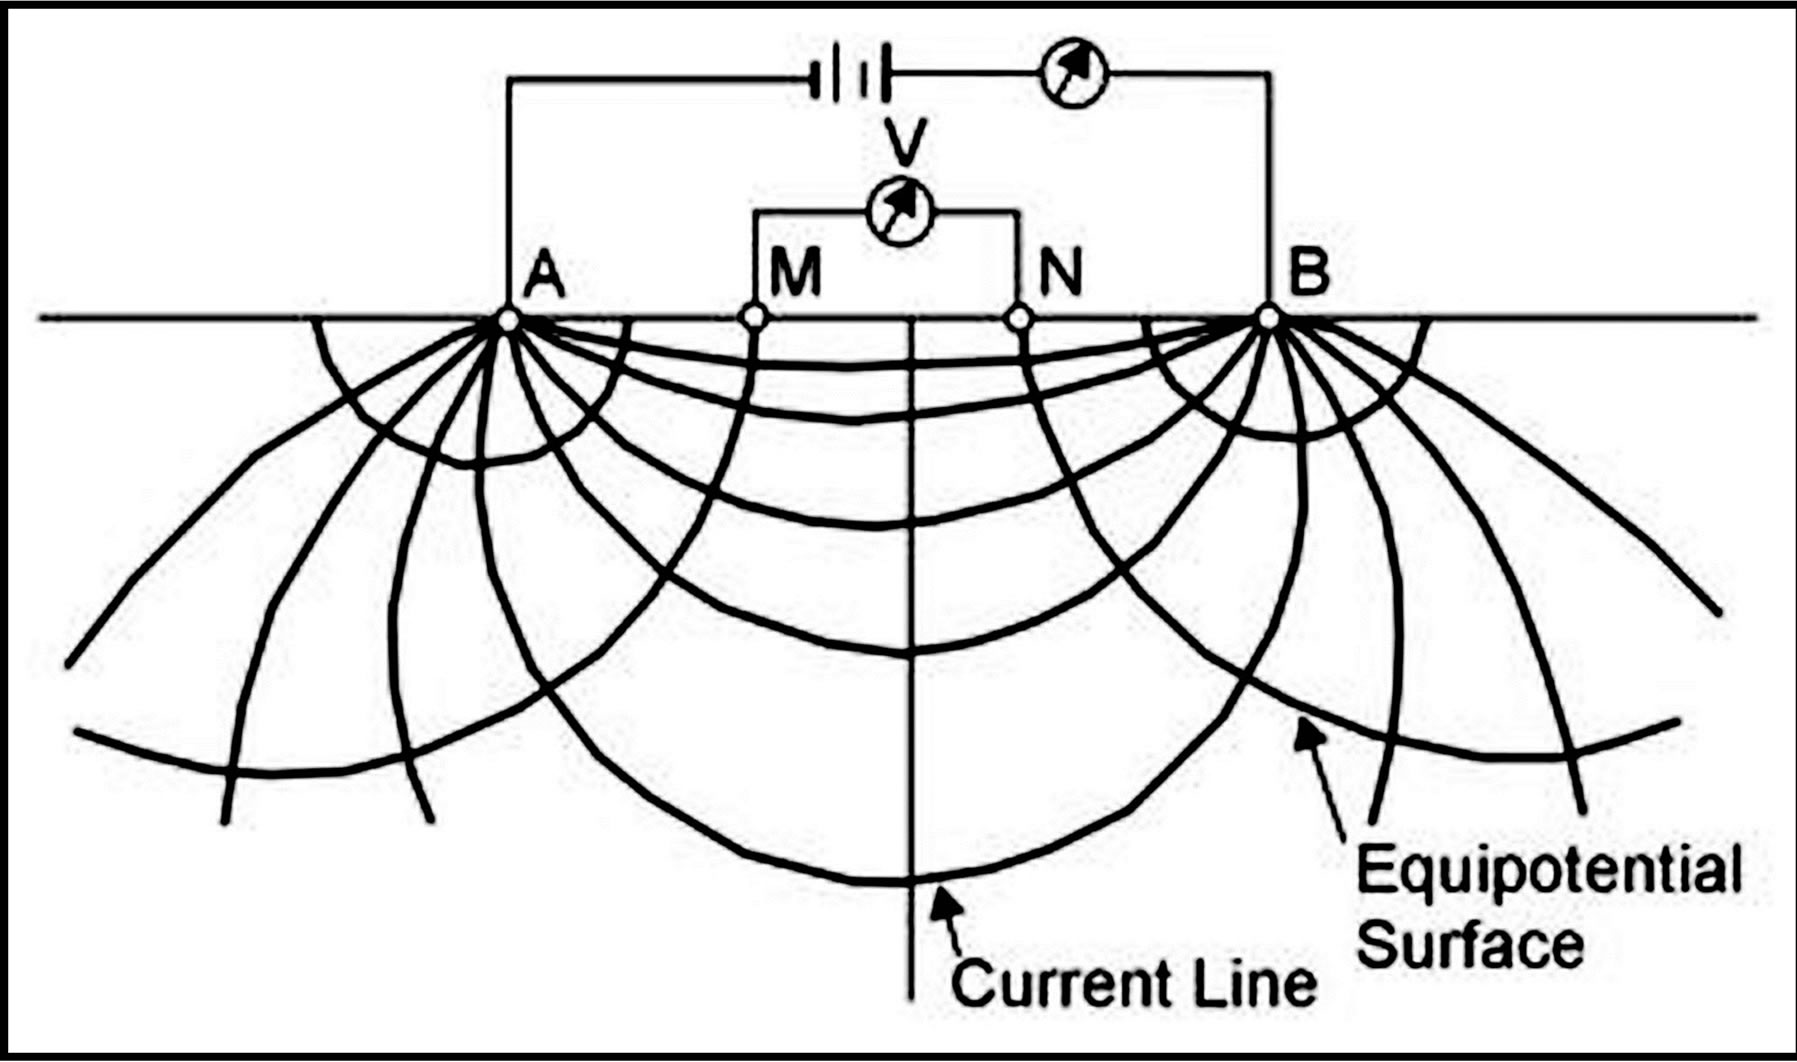
Figure 4. Equipotentials and current lines for a pair of current electrodes A and B on a homogeneous half-space.
 (4)
(4)
where K = array geometric factor.
Equation (4) can be solved for ρ to obtain:
 (5)
(5)
The resistivity of the medium can be found from measured values of V, I, and K, the geometric factor. K is a function only of the geometry of the electrode arrangement.
3.2. Apparent Resistivity
Wherever these measurements are made over a real heterogeneous earth, as distinguished from the fictitious homogeneous half-space, the symbol ρ is replaced by ρa for apparent resistivity. The resistivity surveying problem is, reduced to its essence, the use of apparent resistivity values from field observations at various locations and with various electrode configurations to estimate the true resistivities of the several earth materials present at a site and to locate their boundaries spatially below the surface of the site.
An electrode array with constant spacing is used to investigate lateral changes in apparent resistivity reflecting lateral geologic variability or localized anomalous features. To investigate changes in resistivity with depth, the size of the electrode array is varied. The apparent resistivity is affected by material at increasingly greater depths (hence larger volume) as the electrode spacing is increased. Because of this effect, a plot of apparent resistivity against electrode spacing can be used to indicate vertical variations in resistivity. The types of electrode arrays that are most commonly used (Schlumberger, Wenner, and dipole-dipole) are illustrated in Figure 5. There are other electrode configurations that are used experimentally or for non-geotechnical problems or are not in wide popularity today. Some of these include the Lee, half-Schlumberger, polar dipole, bipole dipole, and gradient arrays. For this research, the Schlumberger electrode configuration was utilized.
3.3. Schlumberger Array
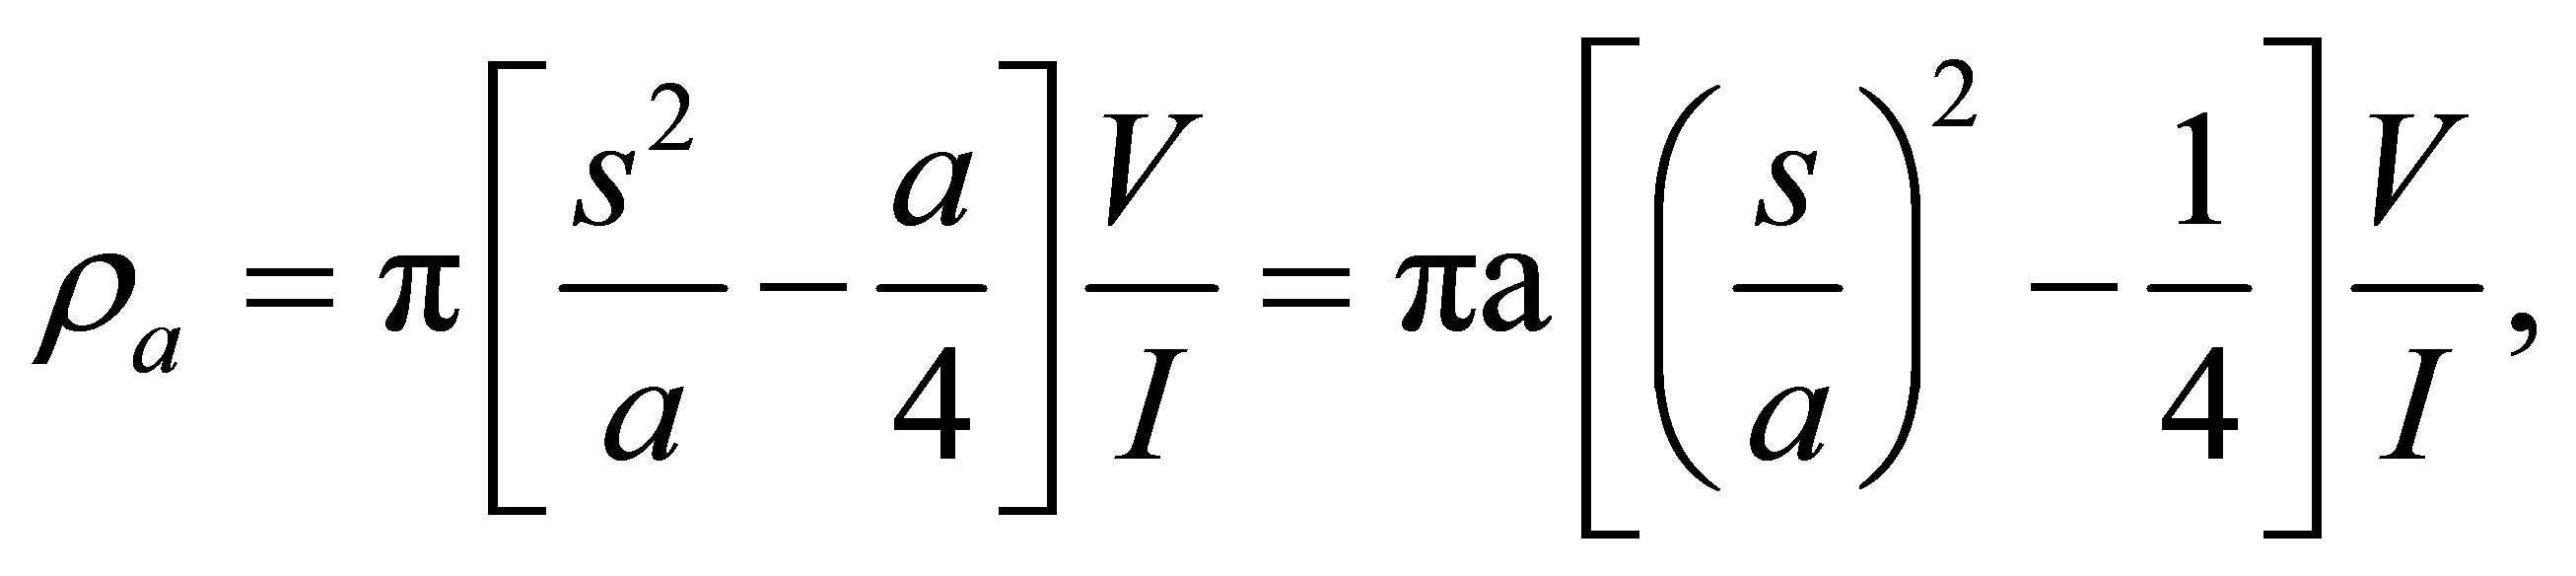
For this array (Figure 5(a)), in the limit as a approaches zero, the quantity V/a approaches the value of the potential gradient at the midpoint of the array. In practice, the sensitivity of the instruments limits the ratio of s to a and usually keeps it within the limits of about 3 to 30. Therefore, it is typical practice to use a finite electrode spacing and Equation (2) to compute the geometric factor [6]. The apparent resistivity is:

Figure 5. Electrode array configurations for resistivity measurements.
 (6)
(6)
In usual field operations, the inner (potential) electrodes remain fixed, while the outer (current) electrodes are adjusted to vary the distance s. The spacing a is adjusted when it is needed because of decreasing sensitivity of measurement. The spacing a must never be larger than 0.4s or the potential gradient assumption is no longer valid. Also, the a spacing may sometimes be adjusted with s held constant in order to detect the presence of local inhomogeneities or lateral changes in the neighbourhood of the potential electrodes.
AB/2 values ranged from 1.5 m to 55 m, ensuring down to 37 m of depth probe. It is envisaged that at this depth structures and bed rock that characterize the dam site would have been probed. Equation (6) was used in data reduction. Plots of ρa values against various AB/2 values on log-log graph gave the characteristic curves from which preliminary input models were made.
4. Results and Interpretation
4.1. Qualitative Treatment
Since curve shapes, and not necessarily the ρa values, are employed in resistivity sounding data interpretation, the log-log plots were employed for the determination of number of geoelectric layers prior to modeling. In all, the A-type curve was shown where there is an increasing resistivity trend with depth. Between 4 and 5 geoelectric layers were proposed in the study area.
4.2. Quantitative Treatment
Preliminary input data from the field were fed into Zohdy software [7] to generate real resistivities and depths to geoelectric layers. Typical results of the modeling are shown in Figures 6 and 7.
Based on these model interpretations, the geoelectric section along the proposed dam axis is shown in Figure 8 and described below:
LAYER I
This is the top loamy soil encountered in VES 1, 2, 3, 4, 5, 9, 10, 11 and 12 locations with maximum thickness of 1.5 m in VES 3 and 4. Resistivity values range from 216 to 519 Ohm-m.
LAYER II
This is modeled as the lateritic matter with maximum lower depth at 5 m in VES 3 and 4 points. This was not encountered in VES 6 point being replaced by alluvium. Resistivity values range from 101 to 6190 Ohm-m).
LAYER III
This is modeled as a restricted pebble bed only at VES 6, 7 and 8 locations flanking the river course. Thickness is about 3.5 m in these locations (6, 7, 8). Resistivity values ranged from 182 - 415 Ohm-m).

Figure 6. Modeled Interpretation of VES 1.

Figure 7. Modeled Interpretation of VES 5.

Figure 8. Geoelectrical section along Dam axis.
LAYER IV
This is modeled as the alluvial matter again restricted to the river course 6, 7, 8 locations with base at between 12.5 m in VES 8 and 8 m in VES 6.
LAYER V
This is the last modeled layer composed of gravely sandstone that underlines the whole study area apart from a restricted pebble bed at the NE crestal portion (VES 12). This model is shown in Figure 8.
5. Discussion
The top sandy agricultural soil and lateritic layers are restricted to the south west and northeast flanks (Figure 8). Pebble beds are only found at the flanks of the river course apart from a restricted lot in VES 12 point. The alluvial matter underlies both the immediate banks and below the water course (Figure 8) at VES 6, 7 and 8. The axial length has overriding sandy matter that may be taken into consideration. This is the only major river course in Ngwa land apart from the structurally-controlled Imo River by the south Atlantic Laclanche fault system. The NW-SE trend indicates possible structural setup for the River course. This possibly is part of the secondary fault or structural event in the Niger Delta area. Already Otamiri River in Owerri and Imo River are confirmed to be structurally-controlled.
6. Conclusion
We thus conclude that the Dam axis is underlain by predominant sandy mater with gravel bed flanking it. Lateritic matter of 3.9 m thickness exists on both axial ends. The southwest end has a more subdued topography than the northeast end. Gullying is a common feature in the area possibly due to the overriding unconsolidated sediment underlying the Dam axis. This must be taken into account as it would introduce arenaceous and detrital matter from the uplands into the reservoir end of the dam thereby causing pronounced siltation of the impounded water. The differential topographic highs may deserve attention. Lastly, the river is very vibrant and must be taken into consideration during construction.
NOTES