Experimental Examination of Fluid Flow in Fractured Carbon Storage Sealing Formations ()
1. Introduction
Since the industrial revolution, the amount of carbon dioxide (CO2) in the atmosphere has risen at an unprecedented rate, resulting in global warming and climate change [1]. In an attempt to reduce the anthropogenic CO2 released to the atmosphere, geologic CO2 sequestration is being actively examined. Carbon capture, utilization, and storage (CCUS) involves pumping CO2 far below the surface of the earth into high permeability (k) and high porosity (f) reservoirs, which have a low k and low f seal formation above the reservoir to stop the vertical migration of the CO2 back to the surface [2,3]. Numerical simulations, cost benefit analysis, and field tests are all underway to determine the feasibility of CCUS as a greenhouse gas mitigation activity. For CCUS to have a meaningful effect on the percent of CO2 in the atmosphere, the CO2 must remain in the subsurface for 100s to 1000s of years [1]. One concern of the long term viability of storage locations is the presence of fractures in the low k/f seal rock above the CO2 reservoirs and the potential for these fractures to allow CO2 leakage to the surface.
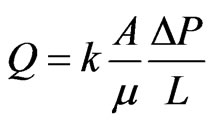
A typical vertical fracture geometry is shown in Figure 1 where the aperture, b, is much less than the fracture width, W, height, H, and length, L. Flow through rock fractures has been a research topic of interest for decades [4,5]. Analytical models were developed for laminar, single phase fluid flow in a narrow fracture, bounded by impermeable walls, by simplifying the Navier-Stokes equations of fluid continuity
 (1)
(1)
where Q is the mass flow rate, m, is the dynamic viscosity of the fluid in the fracture, and P is the pressure along the fracture. Equation (1) is commonly referred to as the “cubic law” of flow in fractures.
Experimentally the cubic law has been shown to be accurate when b W, b
W, b L, fracture wall roughness is small, the flow is laminar, and the fluid acts in a Newtonian fashion. There is a similarity of the cubic law to Darcy’s law for flow through porous media [6],
 (2)
(2)
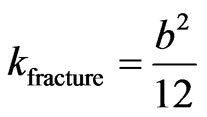
where k is the permeability of the porous medium and A is the cross-sectional area of the porous medium perpendicular to flow. Assuming that the A of a fracture is equal to W*b, the definition of a fracture permeability, kfracture, as [7]
 (3)
(3)
seems reasonable. Often it is more convenient to measure a combined transmissivity (T), where T
 (4)
(4)
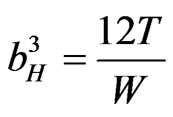
where A is the mean of the fracture area perpendicular to the flow direction. Because the b of a fracture varies, the measurement of a combined T avoids having to calculate an average b for the A calculation, and permits an equivalent hydraulic aperture, bH, to be calculated for use in discrete fracture flow models
 (5)
(5)
As shown in Figure 1, the mechanical b can be defined in several ways, as the vertical difference between two surfaces, bv, or as the largest distance that can be inscribed within the fracture walls, an effective (or perpendicular) aperture, beff. In the remainder of this report b is used to designate a physical measurement of the spacing between fracture walls and bH is used to designate the flow relationship shown in Equation (8). Previous studies [8-10] have shown that for a rough walled fracture bH < bv and bH < beff, but the difference between the bv and beff is not as great as the difference with the bH.
Numerous studies have shown that applying an external force to a fractured core can reduce the b and bH [11,12]. This has been shown to be due primarily to the increase in zero-aperture locations, or contact zones, within the fractures [13,14]. An increase in the contact locations increases the tortuosity of fluids moving through the fracture, which increases the length individual fluid particles, must travel to traverse the macroscopic fracture length. Increasing the contact between fracture walls also creates more restrictive flow paths through the fracture. Both of these effects reduce the T of the fracture.
In a similar fashion, changes due to chemical interactions between the fluid in a fracture and the fracture surface can have an effect on the b and bH. Numerical studies of reactive rocks and low pH fluid flow have shown significant increases in T. Experimental studies have shown that low pH solutions can dissolve carbonates from rock fracture walls and increase T [15-17]. Conversely, experiments have shown that dissolution of fracture surfaces can decrease the b and bH [18]. The complex interactions between these geochemical reactions and the T of a fracture are of importance when considering CO2 leakage from CCUS reservoirs. Site specific fracture and fluid reactions can have different effects on the geometry and flow properties of fractures.
When CO2 is injected into a CCUS reservoir, it will mix with the in-place or native fluid, often brine. The resultant plume of CO2-saturated brine will have a lower pH than the non-saturated brine and has the potential to react with rocks within the seal, reservoir, and in the well-bore. Huerta et al. [19] have shown a complex relationship with sealing occurring in long fractures of wellbore cement when a low-pH fluid migrates through the void. Deng et al. [20] and Ellis et al. [21] have shown that when the rock fracture has a varied composition, the more reactive zones of minerals on the fracture walls will tend to dissolve in low pH environments and increase the b, but this has been shown to minimally effect the bH.. A complex interaction between the site specific fractured rock mass and the fluids migrating through the fracture can result in different interactions that will affect the potential rate of flux through fractures.
The current study is an examination of CO2-saturatedbrine flow through fractured seal rocks from three sites within the continental United States that are being considered or are actively being used for CCUS pilot studies. The experiments were performed over multiple weeks by injecting CO2 saturated brine through fractured samples, and were scanned with a Computed Tomography (CT) scanner at regular intervals over the course of the experiment while kept at representative reservoir pressures. The goal was to evaluate the change in T that would result from a CO2 leakage event so that accurate relationships can be implemented in numerical risk assessment models.
2. Seal Formations
Three cores from sealing formations at active or proposed CO2 injection sites in the continental United States were acquired, fractured, and used for multiple week long CO2-saturated-brine flow through experiments. A short description of the formation rock studied, and how the location of these cores is related to CO2 injection follows.
2.1. Kirtland Shale—San Juan Basin
The Kirtland Shale used for this study was acquired as a preserved core from injection well EPNG com A at the Pump Canyon Site in the north central portion of the San Juan Basin, New Mexico [22]. In October 2000 a multiple year project with the United States Department of Energy (USDOE) and industry partners was launched to evaluate the feasibility of CO2 sequestration in unminable coal seams using enhanced coal bed methane recovery technology [23]. Since 2000 there have been several CO2 sequestration injection pilot projects within the San Juan Basin, primarily focused on injection into the Fruitland Coal formation [24]. Studies of fault locations, tracer movement, and understanding the complex geology of the sealing formations above the Fruitland Coal [25] indicate that detailed studies of how these seals will react to CO2-staurated-brine flow could be of importance when evaluating the long term risk associated with storage here.
The sample used in this study was from a depth of 2049 ft (624.5 m) which is in the Upper Kirtland Shale formation [22]. These samples were preserved by TerraTek by retrieving the core from the aluminum core sleeve with drilling mud, then wrapping layers of plastic, aluminum foil, and dipping in a core seal wax.
The temperature and pressure conditions used for the Kirtland Shale flow through tests at were calculated based on the USDOE report by Heath et al. [22] and heat flow records of the Fruitland coals [26]. A pore pressure of 1620 psi (11.17 MPa) and a core temperature of 27˚C (80.6˚F) were calculated from the depth and reported pressure/temperature geologic gradient. A simple brine recipe based upon USGS measurements of in-situ brines at the depth from which this sample was obtained in the San Juan Basin and is shown in Table 1.
Coring of these samples was not straightforward due to the highly friable nature of the Kirtland Shale. After attempts to sub-core the preserved sample using traditional core drills was shown to be non-effective, a 1.5 in (3.81 cm) diameter sub-core was obtained with an OMAX Jet Machining Center, OMAX 2626 (OMAX Corp., Kent, WA). After the sample was sub-cored a thin layer of 5 Minute Epoxy (Devcon, Danvers, MA) was spread on the exposed surface, to protect against atmospheric degradation. This epoxy layer was allowed to cure the subcore was turned on a lathe to produce uniform and smooth sub-cores for the flow through study. The final prepared sub-core of the Upper Kirtland Shale is shown in Figure 2. The friable nature of the Kirtland Shale and the unique sub-coring process resulted in a competent fractured core.
2.2. Eau Claire Mudstone—Illinois Basin
The Eau Claire mudstone sample used for this study was acquired as part of the ongoing FutureGen 2.0 characterization from well FGA#1 in Morgan County Illinois

Figure 2. Prepared sub-core of upper Kirtland shale.
[27]. The Eau Claire overlies the Mount Simon Sandstone, a large formation with an estimated CO2 storage potential between 16,900 and 67,600 million metric tons of CO2 [2]. The Mount Simon Sandstone has a high f, high k, large areal extent, is thick, and is located in a region with many high volume point source CO2 emitters [2,27,28].
The portion of the Eau Claire caprock studied here is from a depth of 3854 feet (1174.7 m) and was saved for analysis at NETL during a detailed well characterization performed at PNNL [27] with the assistance of Core Laboratories (Houston, TX). This sample is from the bottom of the Lombard member, a primary seal for the Mount Simon Sandstone.
The in-situ pressure was calculated to be approximately 1850 psi based on published literature and the depth of the retrieved core. A confining pressure of 1850 psi was maintained during the Eau Claire fracture flow experiments with fluid pressures that varied between 1600 and 1700 psi (constant fluid injection rate). The brine recipe was determined with Deng et al. [20], based on the work of [29], and is listed in Table 1.
The six inch long sample of the Eau Claire caprock was sub-cored using standard core drills to make 1 in (2.54 cm) diameter samples. Because the sub-cores remained intact each sub-core needed to have a fracture mechanically induced to provide a flow path. This was done perpendicular to the bedding planes using a modified Brazilian technique at NETL. Two samples were selected to perform the experimental flow through tests, as shown in Figure 3.
2.3. Tuscaloosa Claystone—Gulf Coast
The Lower Tuscaloosa claystone used for this study was acquired from the Mississippi Test site of the Southeast Regional Carbon Sequestration Partnership (SECARB) [30]. The sample was preserved from a depth of 8569.75 ft (2612 m) from well HH-38927 at the Jackson County Mississippi Power’s Plant Daniel near Escatawpa Mississippi. The purpose of this SECARB test was to identify and validate the CO2 storage potential of deep saline reservoirs in the Gulf Coast region. Approximately 3020 tons of CO2 were successfully injected at the Plant Daniel site in 2008 [31].
Due to time constraints in the lab at the start of this experiment we were unable to photograph the core prior to the flow through test. A similar sample (3 - 50) from the same well is shown in Figure 4. The depth of the core and a standard geological pressure gradient was used to determine an appropriate confining pressure of 4000 psi. The as-received sample was fractured separate prior to our use of the core in the laboratory. The sample appeared to have desiccated slightly and broke along several bedding planes. The 1.5 in (3.81 cm) diameter and 2.5 in (6.35 cm) long sample was coated with epoxy to ensure it remained intact over the experiment, but no additional mechanical fracturing was needed. A brine recipe based on supplemental data on brine composition presented by Lu et al. [32] that was used for the experiment is shown in Table 1.
3. Methods
NETL’s Universal Systems HD350-E 4th generation refurbished medical CT scanner with 4800 detectors and one rotating X-Ray source was used to non-destructively image the internal structure of the fractured cores. This scanner has capability to operate at 140 kV and 400 mA, has a maximum resolution in the x-y plane (perpendicular to the core length) of 0.25 mm (9.84(10−3) in) and 1 mm (3.94(10−2) in) along the axial direction. NETL’s medical scanner is shown in Figure 5 with four Isco pumps (Teledyne Isco, Lincoln Nebraska) in foreground and a Hassler style core holder (Core Laboratories, Tulsa Oklahoma) that was used to contain the fractured core, while applying both axial and radial pressure to the core during flow tests.
Dual-energy scanning was used to improve the computed tomography number (CTN) to density conversions that were used in these experiments. Dual-energy scanning is the processes of scanning at two energy levels to maximize the Compton scattering effects at high energy and maximize the photoelectric adsorption effect at low scanning energies [33]. This has been used for several

Figure 3. Eau Claire fractured sub-cores B and D.
other studies at NETL where small changes within a geologic sample are being examined [34,35]. In order to calibrate the relationship between the CTN and density several different materials with known density were scanned with the same CT scanning parameters as the fractured samples. These calibration samples included acrylic, nylon, Teflon, and other materials that are of similar density to geologic samples.
A Hassler style pressure vessel was used to constrain the fractured core during the flow through tests. As is shown in Figure 5 the cylindrical core holder is placed in the center of the CT scanner orifice and moved through the X-Ray field. This scanning was performed twice daily during standard working days (Monday through Friday) and once on the weekend days (Saturday and Sunday). The design of the core holder enables a confining pressure to be applied to the fractured sub-core while fluids are injected into the sample. A simplified diagram in Figure 6 shows how this system works. An Isco pump was used to increase the pressure in the annulus between the rubber sleeve containing the fractured core and the outside of the core holder with nitrogen. Another Isco pump was used to inject a mixture of CO2 and brine (labeled H2O in Figure 6). A pressurized mixing vessel

Figure 5. Medical CT scanner with Hassler style core holder and ancillary flow apparatus.

Figure 6. Schematic of flow through system with pumps and core holder.
was used to keep the brine saturated with CO2 prior to being injected into the core holder. At the outlet of the core holder another Isco pump was used in receiving mode to capture the fluids after they moved through the core. By using Isco pumps on both sides of the system a constant injection rate could be set, with settings to ensure that the pressure inside of the core and rubber sleeve did not increase above the confining pressure.
The injection flow rates and temperature of the system varied for each experiment. For the first test, the Kirtland shale flow, elevated temperature (80.6˚F) and constant pressure at the injection side of the core was tested. The temperature controllers were unwieldy and not used for the following tests. The constant injection pressure resulted in unstable flow patterns and collection of effluent from the exit side of the system was not possible at times. For the following tests a constant injection rate was set with the Isco pumps with additional software controls to ensure the pore pressure did not exceed the confining pressure. In this fashion, as long as the injection pressure was less than the confining pressure the flow rate was constant. When the injection pressure increased to a value close to the pore pressure the flow rate was decreased to ensure safe operations.
A combination of LabView (National Instruments, Austin TX), manual recording, and direct recordings from the Icso pumps was used to capture the pressure and flow rate information during the experiments. Initial LabView virtual instruments did a poor job of recording the data, frequently crashing with the out-dated system that was installed in the laboratory. Flow results from the final tests are of higher quality due to solutions being found to these data collection issues.
4. Results
Individual results from the four experiments performed on the three different fractured seal formations are described in this section. The dates of the tests performed, the pressure conditions, and the injection rates are shown in Table 2. Slices of a medical CT scan of the fractured Kirtland Shale sample are shown in Figure 7. These “slices”, and all other medical CT scanner slices in this document, were obtained from the raw 16-bit data files that were generated by the medical CT scanner reconstruction software. The reconstruction algorithm that converted the X-Ray attenuation data to the 3D grayscale images occurred inside the HD-350E software prior to researcher manipulation. Several features can be noted from Figure 7.
1) The core is heterogeneous, with both high density zones (lighter regions) and fracture zones (darker regions) throughout the core.
2) The fractures are small compared to the 0.25 mm × 0.25 mm × 1.0 mm voxel resolution of the medical CT images.
3) The fracturing along the core is non-uniform. There is no discernible primary fluid pathway through the middle of the core as one would typically find in a standard mechanically fractured core. The geologic structure of the core and unique coring technique both contributed to this fracturing pattern.
With the above features noted, small changes in the structure of the fractures during the flow experiment would not be expected to be readily apparent from a thresholding procedure to isolate the fracture of the medical CT data.
As mentioned previously a constant pressure at the injection side of the core was held during this experiment. The LabView module intended to capture the pressure and flow information failed after several days. Written measurements of the volume of effluent in the downstream Isco pump were recorded over the remainder of the experiment. As is shown Figure 8 the bulk flow through the core remained fairly constant over the test duration. The flow rate of approximately 1 ml/day was maintained with a constant differential pressure across the core of −25 psi. No noticeable change in the relationship between differential pressure across the fractured

Table 2. Experimental parameters of flow-through tests.

Figure 7. False color medical CT slices of fractured Kirtland shale sample, XY planes.

Figure 8. Volume of effluent in the receiving pump for the fractured Kirtland Shale test.
core and the flow rate of brine was observed. This indicates that the permeability of the sample did not change appreciably over the course of the experiment. Examinations of the CT scans of this core over the course of the experiment appear to agree with this conclusion; i.e. there is no noticeable change in the fracture or core as determined by the CT images.
The medical CT images of these scans were analyzed and converted to bulk density measurements by the use of dual-energy scanning conversion techniques (for details of this technique see Jikich et al. (2010)). The results of this bulk analysis reveal little systematic change in the density of the core during the 23 day experiment. As shown in Figure 9 the overall change in the bulk density of the core varied from 1.4 to 1.5 g/cm3 (or roughly 7%), but not in a systematic fashion that would indicate dissolution or precipitation within the sample. The average density of the Kirtland core as a function of date of scan is shown in Figure 9, and again no systematic change in the density can be noted that would conclusively indicate either precipitation or dissolution of the rock matrix around the fracture.
An entire montage of medical CT scanner XY slices for the Eau Claire sub-core #1 is shown in Figure 10. The fracture is more apparent within this scan as opposed to the Kirtland fractured sub-core, due to the mechanical fracturing of the sub-core along the length of the sample. Distinct variation in the density of the rock matrix due to the different bedding planes can be noted in Figure 10 by the changes from lighter to darker regions. This matches the variation in the full core seen in the previous CT scans and visual observations of the core. The purple slice in the upper left corner of Figure 10 is the end of the core brine-saturated-CO2 was injected into. Several features of this fracture can be noted from Figure 10. There are regions where the fracture wall touch; zero aperture zones. This type of contact between surfaces has been shown to dramatically affect the transmissivity of a fracture [8]. Also, there is a secondary fracture perpendicular to the primary fracture roughly 3/4 of the distance from the injection side of the core. Neither of these features hindered flow through the fracture in a meaningful way and a constant injection rate of 0.013 ml/min was maintained for the entire experiment, with the pore pressure remaining around 1650 psi.
Initial analysis of the CT scans show little change in the fracture structure over the 22 day long experiment. The bulk density of the sample as derived from the CTN of the full XY slices from the medical CT scans showed no significant difference in the average density of the core over the duration of the test. The values plotted in Figure 11 have error bars showing ± one standard deviation of the bulk density. There was a nominal increase in the density during the last week of the experiment, but the density decreased again by the end of the experiment. The scans during this period were examined to determine if there was some observable phenomenon that occurred

Figure 9. Calculated bulk density of the fractured Kirtland shale core.

Figure 10. Slices of the medical CT scanner reconstruction of Eau Claire mudstone sub-core #1.
in this time period. Though no direct causation was found, it is suspected that this change in the bulk density was due to environmental factors within the CT scanner building during this time. A smaller region of interest that encompassed the primary fracture and less of the surrounding rock matrix was used to calculate the bulkdensity of a more focused zone around the fracture. The results, were similar to those shown in Figure 11 and revealed that the density of this smaller region follows the same trends as the full core bulk density; no conclusive information about changes to the fracture can be derived solely from the CT data.
With multiple sub-cores of the same section of the Eau Claire and the disappointing pressure measurements in the first Eau Claire fractured flow test, an additional test was performed with a similar fractured sample (Figure 3). Initially this flow rate was set to 0.013 ml/min, the fractured core was so permeable the low injection rate had a difficult time in maintaining the pore pressure of 1650 psi, so after two days of operation the flow rate was increased to 0.026 ml/min.
The XY slice montage of the medical CT scan slices for the Eau Claire fractured core #2 is shown in Figure 12. In this representation the primary fracture along the length of the core is shown vertical and in the center of the core. The XZ slice montage is shown in Figure 12 and has a similar bedding plane structure to Eau Claire

Figure 11. Averaged bulk dual-energy derived density of the entire of the Eau Claire sub-core #1.

Figure 12. Slices of the medical CT scanner reconstruction of Eau Claire mudstone sub-core #2.
fractured core #1.
The medical CT scan derived dual-energy bulk density is shown in Figure 13. Very little variation in the density was observed over the course of this experiment. The outlying data point from the scan on 10/20 was scanned on a weekend day, though the reason for the higher than average density from this scan is unclear. A linear fit to the data shows a very slight increase in the density with a slope of 4(10−4); removing the data from 10/20 does not alter the slope of this fit. Similar to the Eau Claire test #1, no conclusive changes in the fracture structure can be determined from the medical CT images alone.
The pressure across the core was measured with a Setra 0 - 250 differential pressure transducer and recorded with a LabView virtual instrument every 30 seconds. This recorded data was averaged over 20 minute intervals and is shown in Figure 14 over the course of the

Figure 13. Averaged bulk dual-energy derived density of the entire of the Eau Claire sub-core #2.

Figure 14. Pressure across Eau Claire sub-core #2, measured from 0 - 250 psi differential pressure gauge.
experiment. There is a spread in the data between 1.3 and 2.1 (with one outlier at 1.07 psi), but the general trend is unchanging; a linear fit to the data has a slope of −10-4. This lack of change in the pressure indicates that no measurable change in the differential pressure was recorded. The increase in the flow rate from 0.013 to 0.026 on day two of the experiment had no measurable effect on the recorded pressure either.
The final test performed in this series of experiments was a Tuscaloosa claystone. The sample is a sidewall plug that was fractured upon arrival at NETL. This was the only core studied where flow was parallel to the bedding planes. The medical CT scanner XY slice montage of the fractured Tuscaloosa claystone is shown in Figure 15. The core is heterogeneous, with several higher density zones (light regions) and several fractures along the length of the core.
The dual-energy derived density again shows little in the way of observable trends (Figure 16). Several measurements were well below the average density of 2.72

Figure 15. False color medical CT slices of fractured Tuscaloosa claystone sample.

Figure 16. Averaged bulk dual-energy derived density of the Tuscaloosa claystone.
g/cc. The CT scanner was overdue for maintenance at this point; slight machine errors may have contributed to these values. With the three outliers removed a linear fit has a slope of 10−4, and thus no changes to the geometry of the core were detectable from the medical CT images alone.
The pressure across the core was measured with the same differential pressure transducer and LabView recording system used for the Eau Claire #2 fractured sub-core experiment, recorded every 30 seconds. The values averaged every 20 minutes are shown in Figure 17. A noticeable increase in the pressure from ≈3.3 psi to ≈4.4 psi was observed. This could be an indication of small amounts of precipitation within the fracture voids that reduced the mechanical and hydraulic aperture of the fracture, an excellent trait for a sealing formation.
5. Conclusions
For the three formations studied there was a minimal

Figure 17. Pressure across Tuscaloosa fractured core, measured from 0 - 250 psi differential pressure gauge.
change in the recordable fracture properties over the course of the extended saturated CO2-brine flow through experiments. This is a good result, indicating that the potential sealing properties of these formations will not degrade when in contact with CO2-saturated brine. Even though these were long tests for laboratory studies, on the geologic scale of interest for CCUS activities they are not “long”. As such, longer experiments may yield different results.
In addition, three out of four of these experiments were run at room temperature due to issues with the temperature control mechanism in the medical CT scanner. And increase in the temperature of the cores and fluids may increase the reaction rate and promote more rapid alteration of the fracture structure.
The most dramatic change was the reduction in the hydraulic aperture of the Tuscaloosa fractured sample, as shown by the increase in the differential pressure across the core. This increased resistance to flow could help stem the flow of CO2/brine from a CCUS reservoir in the Gulf Coast. No other flow properties were observed to change as much.
The lack of change in the fracture hydraulic properties of the fracture indicates that the non-dynamic pressure to flow relationships discussed in the introduction and currently implemented in many discrete fractures flow models is adequate for CO2-brine flow through fractured seals. That is, there appears to be little need for the inclusion of geochemical alterations to the basic fracture flow equations when the reactivity of the surrounding rock matrix material is very low. When other factors may affect the behavior of a fracture (such as changes to the stress field) those factors may need to be included, but geochemical reactions within the seal formations and CO2-brine mixtures studied appear minimal.
6. Acknowledgements
Thanks to Bryan Tennant, Karl Jarvis, and Roger Lapeer for assistance with all laboratory work. This work was completed as part of National Risk Assessment Partnership (NRAP) project. Support for this project came from the DOE Office of Fossil Energy’s Crosscutting Research program. The authors wish to acknowledge Robert Romanosky (NETL Strategic Center for Coal) and Regis Conrad (DOE Office of Fossil Energy) for programmatic guidance, direction, and support.