Quantitative Detection of Aloin and Related Compounds Present in Herbal Products and Aloe vera Plant Extract Using HPLC Method ()
1. Introduction
Aloe vera L. is a perennial plant with turgid green leaves joined at the stem in a rosette pattern [1]. It has gained high importance for its diverse therapeutic properties. The plant contains major quantities of water and seventy five different ingredients including vitamins, minerals, enzymes, sugars, anthraquinones or phenolic compounds, lignin, tannic acids, polysaccharide, glycoprotein, saponins, sterols, amino acids and salicylic acid [1]. The structures of some bioactive compounds present in Aloe vera L. are shown in Figure 1. Aloe vera provides nutrition, shows anti-inflammatory action and has a wide range of antimicrobial activity. It can be used not only in the medicine for the treatment of various diseases, but also as an ointment and cosmetics [2]. Aloe vera products have long been used in health foods for medical and preservative purposes. Aloe contains two major active materials: one is the aloe polysaccharides presenting in aloe filet; the other is anthraquinone derivatives existing in the leaves of different aloe plants [3]. The major constituents have multiple pharmacological actions including laxative, anti-bacterial, anti-inflammation, hemostatic, and antispasmodic [4-9]. These constituents are isolated by various extraction methods such as pressurized hot water extraction [10], ultrasonic and microwave extraction [11], supercritical CO2 extraction [12], and pressurized liquid extraction [13]. Fernand et al. [14] extracted the active components from C. alata L. using solid-phase extraction coupled with HPLC analysis. Later Gong et al. [15] used the ionic liquid separation of the Aloe vera constituent determined by HPLC method. It is complicated to determine the amount of each compound in an herb because of the existence of many active components in it. It is important to establish a simple, rapid and accurate quantitative method for the quality control of commercial formulated products. Here we demonstrated the determination of the Aloe vera product in real samples and commercial cosmetics products such as lotion and syrups in order to measure the exact concentration of the active components. Also the proposed method can be utilized for the scientific validation of the commercial products. This method provides an easy, economical, and efficient hydrolysis condition for the validation of commercial products.
2. Experimental Section
2.1. Chemicals
Aloins are used for the control of retention times and HPLC grade methanol and Acetonitrile were purchased from Sigma-Aldrich (St. Louis, USA). AR grade ethanol, sulfuric acid and chloroform were purchased from Sigma-Aldrich. Ultra pure water (18.2 MΩ·cm−1) was obtained by means of a MilliQ apparatus by Millipore, USA. Stock solutions of the analyte (1 mg/mL) were
 (a) (b) (c)
Figure 1. Bioactive compounds present in Aloe vera extract (a) Aloe emodine, (b) Eugenol methyl ester, (c) Aloins A & B.
prepared by dissolving suitable amounts of each pure substance in methanol and were stable for at least two months when stored at −20˚C (as assessed by HPLC assays). Standard solutions were prepared daily by diluting stock solutions with the mobile phase and directly injected into the HPLC system.
2.2. Methods
A High Performance Liquid Chromatography (HPLC) equipped with gradient elution capability, Ultraviolet spectrophotometer (UV, model 2487) and photodiode array (PDA, model 2996) as detector and an auto sampler (Waters Alliance system, model 2965). Data handling system used Waters Empower-2. A stainless steel column of length 250-mm, internal diameter 4.6-mm filled with waters proprietary phase chemically bonded to porous modified silica particles of 5 μ diameter which is used Waters X-Terra RP-8 (250 × 4.6 mm), 5 μ column. The mobile phase consisted in the ratio of water (78%) and acetonitrile (22%). The detection wavelength was 220 nm and the flow rate was 1.0 mL/min. Each injection volume was 20 μL. The column temperature maintained at ambient condition.
2.3. Preparation of Crude Plant Materials
The extract was prepared by the method reported in the literature [16]. Aloe peel powder was soaked in 60% ethanol solution for 24 hrs. The solution and residue were isolated by a centrifuge (800 B, Changsha) at a rolling speed of 4000 rpm. A reddish brown colloid containing aloe extractive was obtained. Sulphuric acid and chloroform were added into the extractive and refluxed to remove the chloroform extractive. This procedure was carried out in triplicates. After the evaporation of the chloroform, a yellowish-brown colloid was obtained as crude extract. Stock solution was prepared by dissolving in methanol.
3. Method Validation
Determination of total AQs content is measured at maximum absorbance wavelength (220 nm) in Figure 2. Triplicate runs were carried out for each partitioning experiment for accuracy (Table 1). The method was calibrated by analyzing five standard samples with known amount of 1,8-dihydroxyanthraquinone in the range 0.0066 - 0.0350 μg·mL−1. The linear regression equationy = 27.7x + 0.0057 was constructed by plotting the absorbance (A) as a function of the pure AQs concentration (c) with a correlation coefficient of r = 0.9996 and the relative standard deviation (RSD) of 2.4%. Limit of detection (LOD) is the lowest analyte concentration that could be detectable above the noise level of the system, was measured generally three times the standard deviations of the blank (S/N > 3.3). The LOD was defined as the formula,

where DL, σ and S are limit of detection, the standard deviation of the response and the slope of the calibration curve respectively.
The linear regressions and correlative coefficients were determined based on the calibration curves. The real concentrations were derived from the standard curves and used to calculate the standard deviation (SD) and coefficient of variation (CV), which were used as indexes for the precision and relative error for accuracy, respectively. The LOD determination of total AQs concentration was 0.0038 μg·mL−1. The HPLC data for the reference standards and samples are shown in Figure 3. This study attempted to establish an HPLC method for simultaneous determination of the aloin and aloe-emodin contents in aloe-extracts and aloe-containing lotion and syrups. HPLC chromatograms of aloin and aloe-emodin in aloe-containing products and standards are shown in Figure 3. For simultaneous analysis of two ingredients with different polarities, an isocratic elution analysis system was used. These three compounds were well resolved within 30 min. The retention time of Aloins A and B was observed at 9.4 and 10.9 min respectively. While recording Aloe vera plant extract, these Aloins A and B values are slightly red shifted and appeared at retention

Table 1. Analysis results for samples at different pH values (initial sample concentration was 28.5 μg·mL−1).
of 9.9 and 11.9 min respectively and it is tabulated in Table 2. The major peak at 2.4 min is due to the isolation of aloe emodin. These values are correlated well with the reported results. From the above studies it is observed that the major active components are present in the brown colored Aloe vera plant gels (Figures 4 and 5).

Table 2. The retention time (RT) of Aloe vera extract and reference standard.
The presence of Aloins A, B and aloe emodin in four different samples were identified (Figure 4). The commercially available products were analyzed using HPLC to identify the active components present in it. Three major peaks were identified for each sample. In some cases one or two components are seen which can be due to the low concentration of the active components (Figure 3). A calibration plot of Aloins A and B were generated using a known authentic sample. From this graph the unknown concentration of Aloins A and B can be measured (Figures 6(a) and (b)). Three concentrations of the calibration standard were spiked into the blank

Figure 3. HPLC chromatograms of aloin and aloe-emodin [1. Aloin A; 2. Aloin B; 3. aloe-emodin] in aloe-extract, aloe containing samples and reference standard.

Figure 4. HPLC chromatograms of aloe-extract containing Aloe-emodin, Aloin A and Aloin B.

Figure 5. HPLC of reference standard Aloin A and Aloin B.
samples and assayed by HPLC. The recoveries were determined by the percentage of the calculated concentration versus the theoretical concentration (Figure 7). The results indicated that this study established a feasible method for flavonoid detection in commercial formulated products.
 (a)
(a)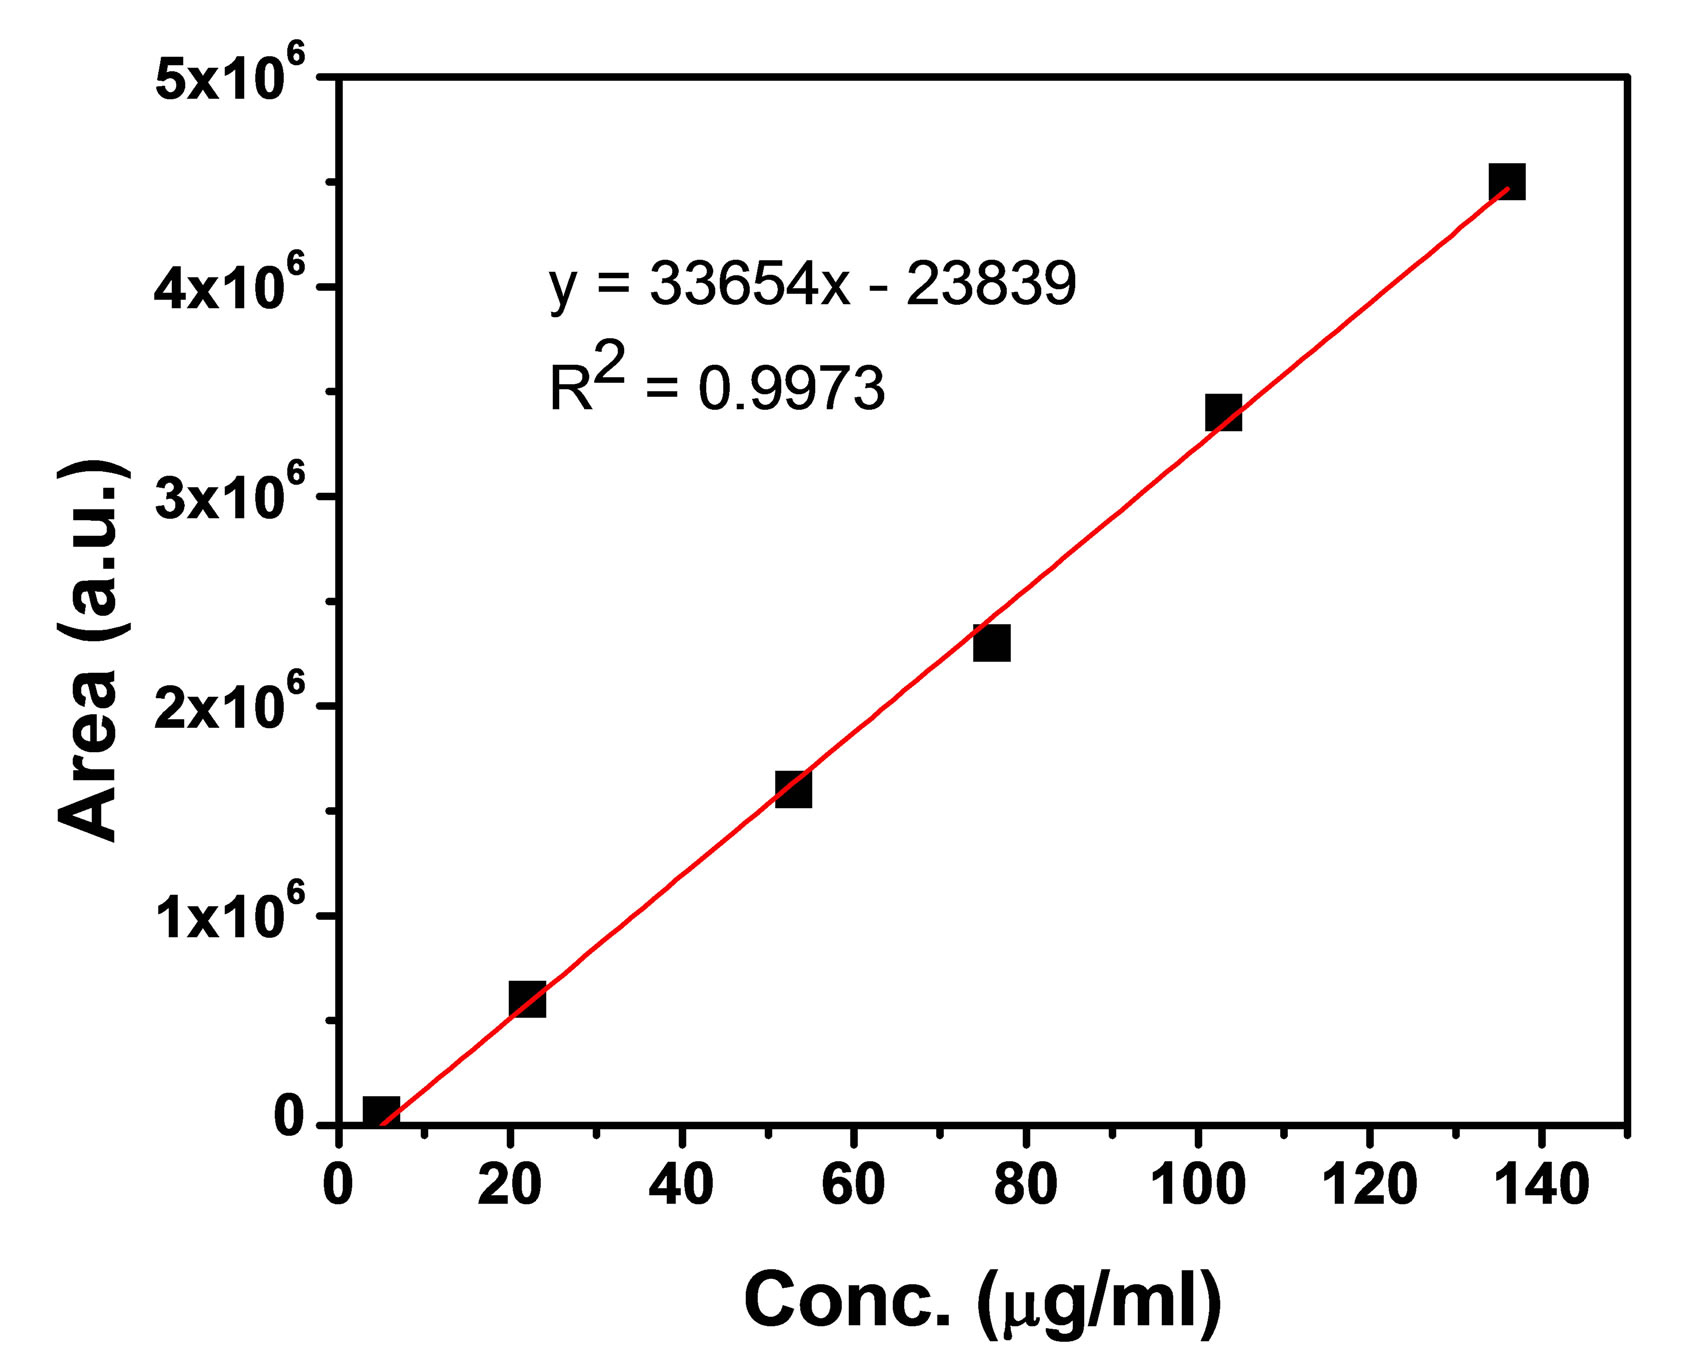 (b)
(b)
Figure 6. (a) Linearity graph of Aloin A; (b) Linearity graph of Aloin B.

Figure 7. Recovery of samples in percentage, pH 2.0, 4.0 and 6.0.
4. Conclusion
We have developed an analytical method based on HPLC for validation and determination of Aloins A and B contained in the extract and derived formulations. The proposed method is simple and shows good sensitivity, precision and this method can be extended for the analysis of bioactive compounds present in the commercial formulations to study their adulteration from the product available in the market. In comparison with the previously reported methods, the proposed one had advantages for the scientific validation of aloin content in the commercial products.
NOTES