The Effect of ECAP Deformation Route on Microstructure, Mechanical and Electrochemical Properties of Low CN Fe-20%Cr Alloy ()
1. Introduction
Severe plastic deformation (SPD) as a processing of fabricating ultrafine grained (UFG) material to the sub micrometer level has been acknowledged for twenty five years in the field of materials science and engineering [1] . SPD can be applied to materials with a wide range of chemical compositions in bulk form. Equal channel angular pressing (ECAP) is a type of SPD application that fabricate UFG material by incremental shear restricted to the narrow zone parallel to the intersecting plane of the two channels [2] [3] . The majority of papers on ECAP materials have been devoted to the face-centered cubic (FCC) materials such as Al [4] , Cu [5] and Ni [6] , but it was limited in body-centered cubic (BCC).
Several parameters of ECAP process that influenced on microstructural evolution and mechanical properties were die angle, pressing speed, die temperature and deformation route. The deformation route of ECAP has four basic methods: in route A, the sample is processed without any rotation; in route BA, the sample is rotated by 90˚ in an alternate direction between consecutive passes; in route Bc, the sample is rotated 90˚ counterclockwise between each pass; and in route C, the sample is rotated by 180˚ between passes [7] . Studies on the effect of the deformation route have been recommended for explaining its effect on microstructure and mechanical properties, especially in FCC material. These studies found that material processed by route Bc is the most efficient method to produce isotropic microstructure and high angle grain boundary (HAGB) due to the 90˚ crossing shear planes in every pass [8] -[10] . There are many studies concerning the effective deformation route for grain refinement in FCC metals, but there are limited studies for BCC. When the UFG materials are applied to structural materials, the anisotropy of microstructure is crucially important because of surface phenomena, such as corrosion, oxidation and corrosion fatigue. In order to improve the resistance to such degradations, it is important to characterize and control the anisotropy of the microstructure as well as the average as-received microstructure. However, the degree of anisotropy on microstructural development has not been carefully evaluated so far, especially in BCC metals [8] [11] -[13] . The effects of the pass number and deformation route on the microstructure, mechanical and electrochemical properties considering the degree of anisotropy will be discussed in detail in this study.
2. Experimental
2.1. Material
The present material had a chemical composition of low carbon and nitrogen (CN) Fe-20%Cr alloy with Cr 20.03; C 0.0004; N 0.0013 and Fe balance (in mass percent). Due to low carbon and nitrogen content, this alloy exhibited interstitial free and a good formability. This alloy was machined with dimensions of 7.95 mm × 7.95 mm × 100 mm for ECAP pressing.
2.2. ECAP
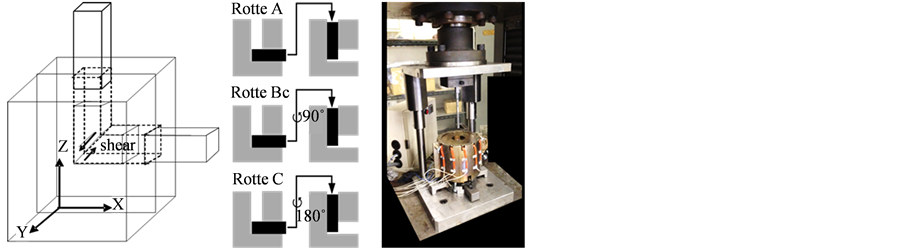
ECAP procedures were carried out using a split die with two channels intersecting at an inner angle of 90˚ and an outer angle of 0˚ at 423 K (Figure 1(a)). Before ECAP process, the samples were lubricated with high temperature fluorine lubricating grease, and then pressed for one, two and four passes via routes A, Bc and C (Figure 1(b) and Figure 1(c)).
 (a) (b) (c)
Figure 1. (a) ECAP system, (b) Schema ECAP of route A, Bc, and C, (c) ECAP equipment.
2.3. Microstructure Observation
The initial microstructure of the as-received sample was expressed using orientation color map electron backscattered diffraction (EBSD) (Figure 2). Microstructure quantification by EBSD, and the mechanical and electrochemical properties were analyzed during grain refinement process using SPD. And then, microstructure observation was carried out by a scanning electron microscope of field-emission type (FE-SEM, JSM 7001F), equipped with EBSD (Oxford Instrument Co.) image, and a transmission electron microscope (TEM, JEM 2100F). Therefore, EBSD orientation maps were processed using INCATM software. In case of microstructure observation by TEM, sample preparation was needed. Thin foils for TEM were polished using abrasive papers to about 100 mm thickness and then thinned by a twin-jet polishing Tenupol 5 facility using a solution of 40% acetic acid, 30% phosphoric acid, 20% nitric acid and 10% distilled water.
2.4. Mechanical Properties
Mechanical properties were measured by hardness and tensile testing. The micro hardness experiments were performed on a Vickers hardness testing machine by Shimadzu at room temperature. The hardness testings were carried out 10 points in the center of material for each sample. And then tensile testing was carried out using Autograph 10 kN Shimadzu with a normal strain rate 5.56 × 10⁻⁴ l/s. Tensile testing machine was equipped with camera. This camera will define displacement of tensile specimen. The tensile sample was cut by a Mitsubishi wire cutter with 3 mm gauge length, 1 mm gauge width and 1 mm gauge thickness.
2.5. Electrochemical Properties
Electrochemical properties were measured by Tafel testing. This corrosion testing was carried out at ambient temperature in a flat polarization cell, using platinum counter electrode and Ag/AgCl reference electrode in order to measure the potential and current density of corrosion resistance. In the beginning of testing, the electrolyte was dearated for 30 mins by flowing argon. The range of potential variations was controlled by Hokuto HABF5001. Tafel testing used solution 1 M NaCl and 1 M CH3COOH.
3. Results
3.1. Microstructure
Grain boundary misorientation maps are represented 3-dimentionally in Figure 3 in order to show the spatial configuration of low and high angle grain boundaries viewed from three orthogonal directions. Low angle grain boundaries (LAGB) are predominant with little fraction of HAGB before and after 2 passes by ECAP (Figures 3(b)-(d)), but the fraction of HAGB increased after 4 passes replacing some LAGB (Figures 3(e)-(g)). After 4 passes in route A, HAGB were planar and extended nearly parallel to Z-plane, resulting in little fraction of HAGB exposed on Z-plane. This planar and extended morphology is shared in common partly by HAGB in route C (Figure 3(g)). But, they are viewed on Z-plane as well as Y-plane. Thus, there are two parallel sets with common axis parallel to Y-axis. In contrast with route A and C, HAGB can be viewed more equally in all orthogonal planes in route Bc, and show more isotropic configuration. In summary, microstructure in route Bc is
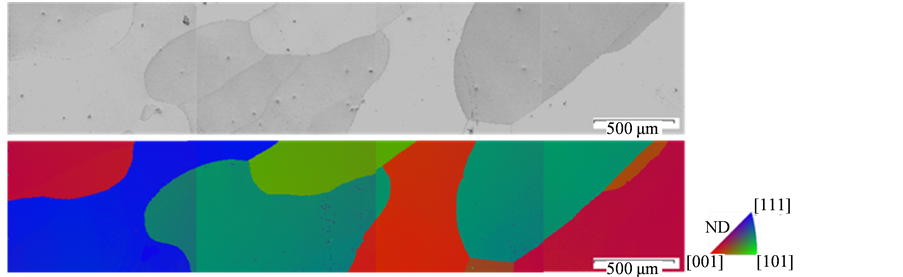
Figure 2. Pattern image map and orientation image map of low CN Fe-20%Cr alloy.
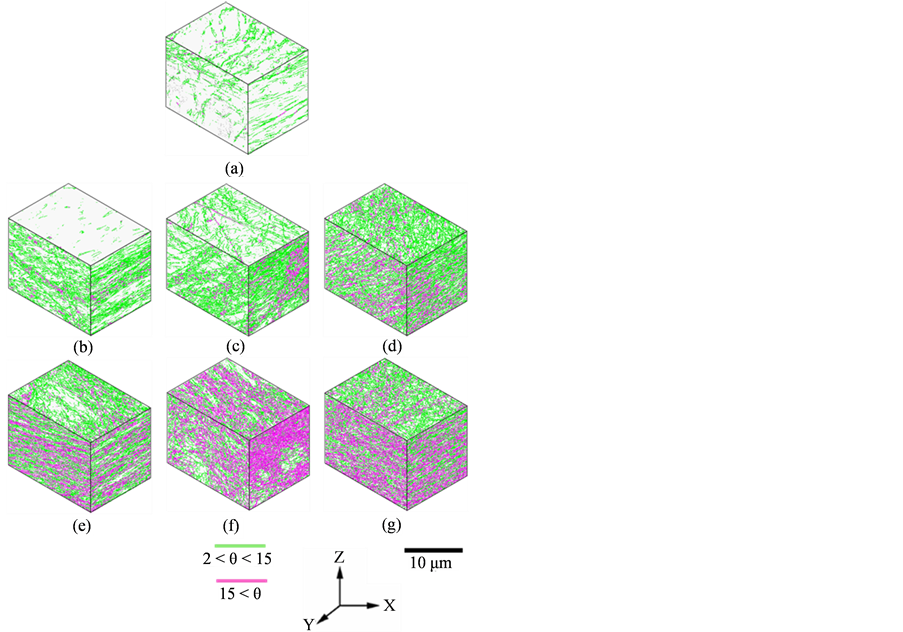
Figure 3. 3D Misorientation map of low CN Fe-20%Cr alloy after ECAP (a) one pass, (b) two passes route A, (c) two passes route Bc, (d) two passes route C, (e) four passes route A, (f) four passes route Bc, (g) four passes route C.
most isotropic in terms of the fraction of HAGB and their morphology than that in route A and C. This isotropic microstructure by the route Bc is in consistent with several previous researches on FCC metals [8] -[10] .
Fraction of HAGB and mean misorientation measured on the three planes are plotted as a function of pass number as shown in Figure 4. Both the parameters increased with ECAP pass, but the rate of increase is different among the observation planes. In routes A and C, both the fraction of HAGB and misorientation on Z-plane remained almost constant whereas they exhibited the steady increase on X and Y-plane. On the other hand, they increased to the same level on all the observation planes in route Bc. This isotropic increase in route Bc and the anisotropic increase with low level on Z-plane in route A and C are in consistent with the spatial configuration of HAGB shown in Figure 3.
The increase of misorientation and HAGB fraction occurs as a result of local crystal rotation in individual grains during ECAP. Therefore, by examining local texture, one can speculate the formation mechanism and nature of HAGB. Figure 5 shows {100}-pole figure in three observation planes after 4 passes. The degree of scattering and its isotropy is different in different routes. In route A and C, the texture on Y-plane is more diffused, and preferred orientations seems to be the collection of orientations rotated around Y-axis. With the results shown in Figure 3, the parallel sets of planar HAGB are mostly tilt boundary with rotation axis parallel to Y-axis. However, the texture on Z-plane seems to show a preferred single orientation whereas that on X-plane shows fibrous texture comprising the collection of the orientations rotated around a certain axis. This anisotropic texture is closely associated with the anisotropy of HAGB spatial configuration as shown in Figure 3. In route Bc, the degree of scattering is almost the same in all observation planes with no clear preferred orientation and rotation.
From Figure 3 to Figure 5, a schematic diagram showing simplified spatial configuration of HAGB is constructed and shown in Figure 6. In route A and C, the preferred texture is modeled as a collection of orientations rotated around the Y-axes bounded by HAGB with tilt character. However, there is a difference; there is one and
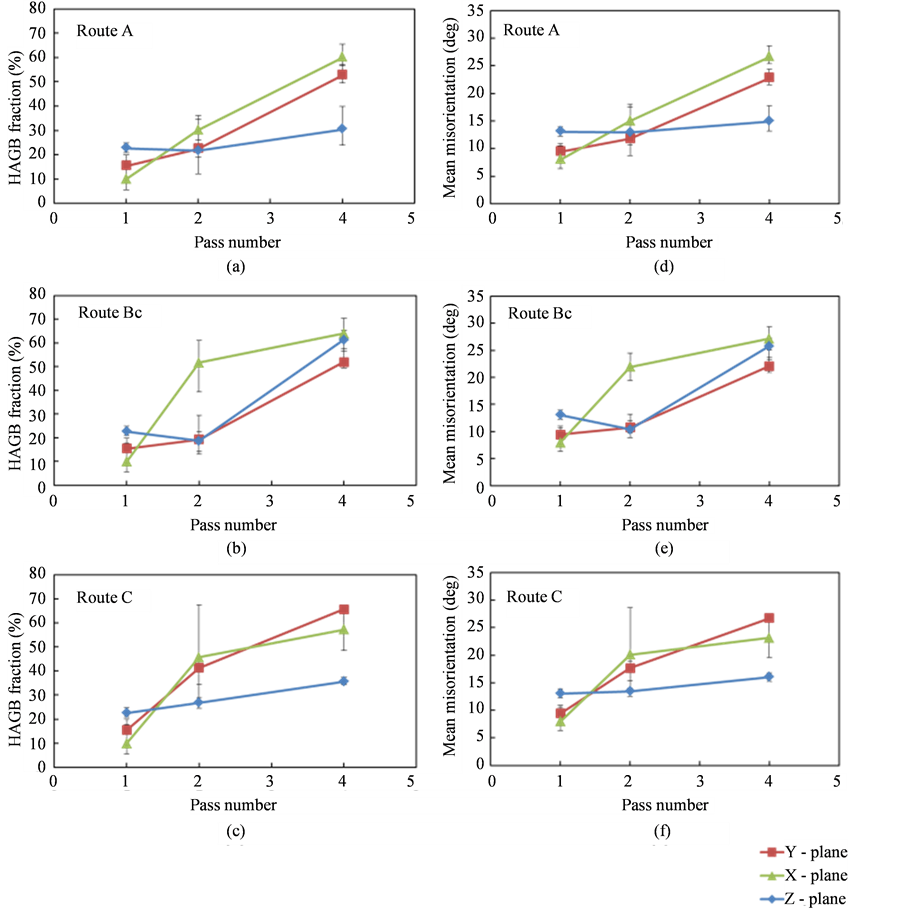
Figure 4. High angle grain boundary fraction of ECAP processed with respect three orthogonal plane for (a) route A, (b) route Bc and (c) route C, and mean misorientation angle for (d) route A, (e) route Bc and (f) route C.
two sets of HAGB on Y-plane after four passes in routes A and C, respectively.
Microstructure was observed by TEM on Y-plane as shown in Figure 7. Microstructure after one pass by ECAP exhibited a cellular dislocation structure. After two passes ECAP, microstructure became finer and consisted of elongated grains with rather planar boundaries. Larger grains were also observed within UFG structures. Since the selected area diffraction pattern (SADP) exhibited rather regular pattern, this microstructure consisted of dislocation cells structures with a similar orientation. After four passes, more homogenous equiaxed UFG structures were observed with sharper boundaries. SADP became divided into finer spots, which indicated that grains were fragmented in finer scale by HAGBs.
3.2. Mechanical Properties
Micro-hardness of ECAPed sample was measured on three orthogonal planes as shown in Figure 8. They increased with an increase of ECAP passes, but the degree of hardening was different among the three planes, namely, the hardening was relatively low in Z-plane, especially in routes A and C. This anisotropic hardening
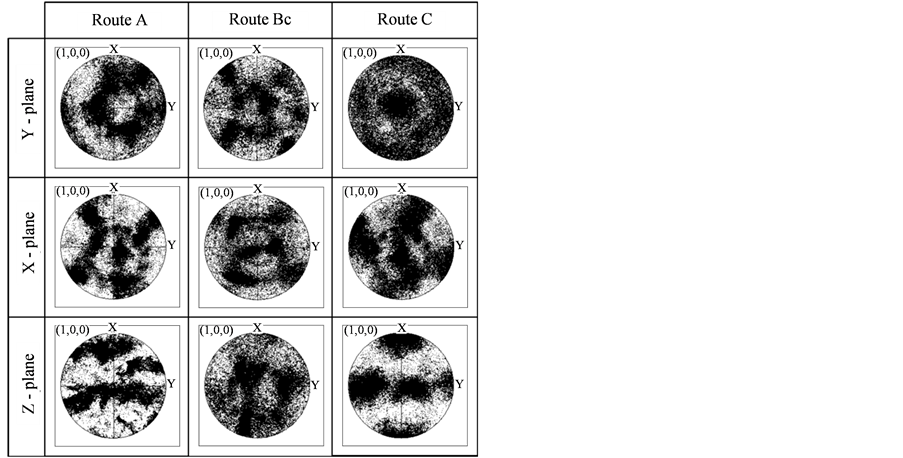
Figure 5. {100}-Pole figure of low CN Fe-20%Cr alloy after four passes ECAP.

Figure 6. Schematic diagram showing spatial configuration of high angle grain boundaries in three orthogonal planes in routes A, Bc and C.
was associated with the anisotropy of HAGB spatial configuration as shown in Figure 3. The less hardening on Z-plane might be a result of low HAGB density on Z-plane. Similarly, the isotropic hardening in route Bc reflected the isotropic configuration of HAGB.
Engineering stress-strain curves before and after one, two and four passes are shown in Figure 9. As compared with stress-strain curve before ECAP, those after ECAP show drastic increase of stress, and little strain hardening behavior. Thus, local elongation accompanying necking started at the beginning of straining. A steady increase of tensile stress was observed until four pass ECAP. The tensile stress is highest in route Bc followed by those in routes A and C after four passes. After two and four passes, elongation to failure was the highest in route Bc followed by the routes A and C. This difference of elongation may reflect the degree of anisotropy of microstructure; namely, isotropic microstructure may lead to uniform and homogenous deformation and high elongation to failure whereas anisotropic microstructure with extended parallel HAGBs in routes A and C may be the cause of early crack formation and failure.
3.3. Electrochemical Properties
Tafel extrapolation curve for as received, one, two and four passes by routes A, Bc and C are shown in Figure 10. Tafel testing was carried out to examine the effect of the anisotropy of HAGB spatial configuration on corrosion behavior. It is found that the curve of Tafel testing results shifted to higher values of the corrosion potential and current density with increasing number of ECAP process. Material processed by route C at Y-plane resulted in more stabilized in Tafel testing than routes A and Bc. This result corresponded to high fraction of HAGB and mean grain boundary misorientation.
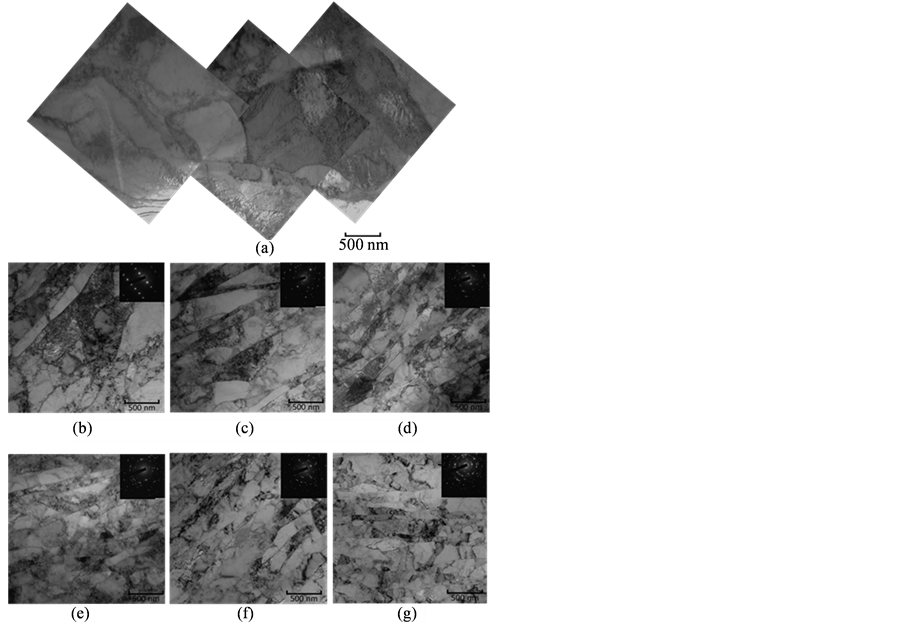
Figure 7. Microstructure using TEM of low CN Fe-20%Cr alloy after ECAP on Y - plane (a) one pass, (b) two passes route A, (c) two passes route Bc, (d) two passes route C, (e) four passes route A, (f) four passes route Bc, (g) four passes route.
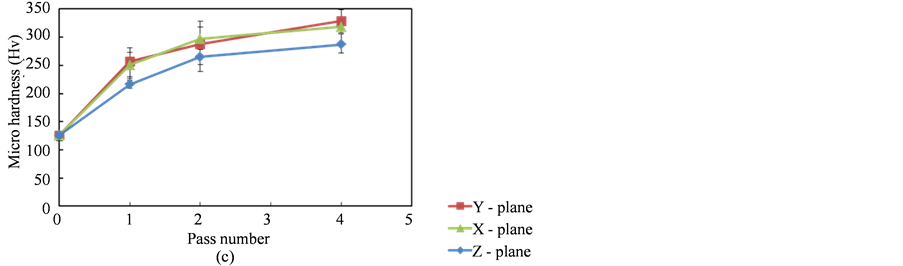
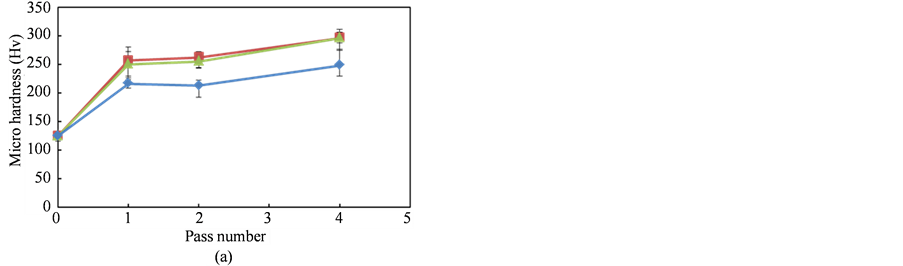

Figure 8. Microhardness after ECAP for low CN Fe-20%Cr alloy with (a) route A, (b) route Bc and (c) route C.
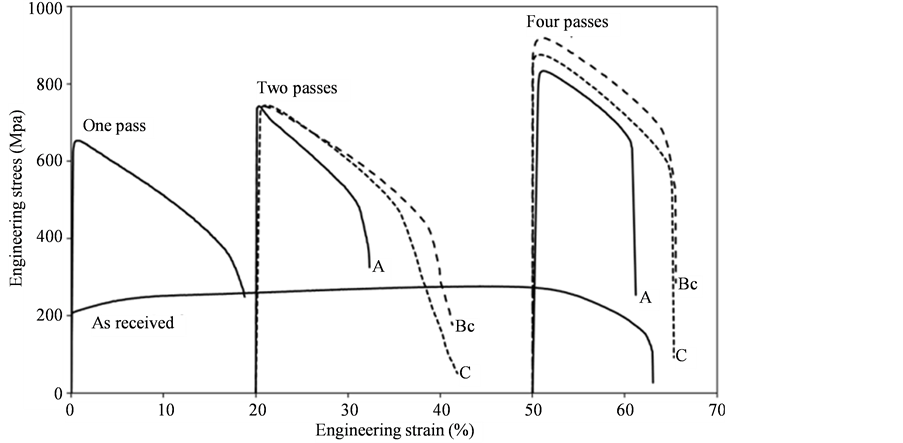
Figure 9. Room temperature tensile behavior of low CN Fe-20%Cr alloy ECAP-processed.
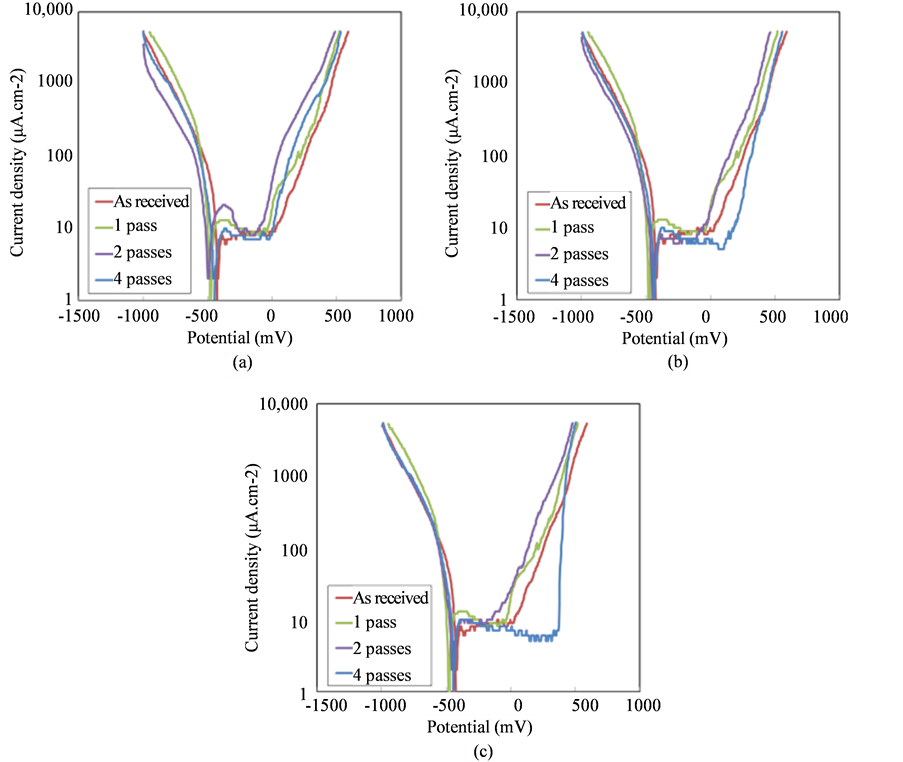
Figure 10. Tafel plots for as-ECAPed sample on Y-plane for (a) route A, (b) route Bc and (c) route C in 1 M NaCl and 1 M CH3COOH solution.
4. Discussion
4.1. Microstructure Development on Low CN Fe-20%Cr Alloy by ECAP
The present materials with extremely low C and N, are interstitial-free steel, and the effect of solute atoms on the development of microstructure can be neglected. Therefore, one can examine the microstructural evolution in terms of crystal slip intrinsic to BCC structures. Since the Peierls potential of screw dislocations is higher than that of edge dislocation in BCC crystals, slip by screw character is more predominant than by edge dislocation. When plastic straining increases by the formation and extension of dislocation loops, edge dislocations characters with high mobility slip faster than screw dislocations character with lower mobility, resulting in extended lines of screw dislocations. This extended dislocation loops in BCC metals were indeed observed by TEM frequently. Therefore, nature of the slip intrinsic to screw dislocation has influence on the macroscopic behavior of plastic deformation. Well-known deformation behaviors peculiar to BCC are the dominant cross-slip by screw character, dynamic recovery and tension/compression asymmetry attributed to slip irreversibility of screw character, etc.
During ECAP process, deformation induced boundaries developed parallel to the most shear-stressed slip plane. It might also be parallel to the macroscopic shear plane of ECAP. The grain boundaries tended to develop as a set of parallel boundaries nearly parallel to the shear plane in routes A and C. The shear planes were nearly parallel in successive passes. On the other hand, the shear planes in the successive passes were rotated with a wide range of angles viewed from all the orthogonal planes in route Bc. Thus, grains tended to be equiaxial and isotropic in route Bc. However, there was a difference in the alignment and fraction of HAGB between routes A and C.
In route A, the shear plane and shear direction in the successive passes were almost constant and the same slip system was activated in the successive passes. Orientation was stable leading to defined texture. Afterwards, the deformation-induced boundary formed parallel to the most activated slip plane that closes to the shear plane. As a result, a single set of parallel HAGB formed in route A.
In route C, the shear was reversed in alternative passes in the same shear plane. The slip reversibility was low in BCC compared to that in FCC because of the dominant activity of screw dislocation. Afterwards, a different slip system can be activated in the forward and reverse shear deformations. Stable end orientation in the two opposite shear was different. In addition, it was led to orientation scattering around the Y-axis.
4.2. Mechanical and Electrochemical Properties of Low CN Fe-20%Cr Alloy by ECAP
The present study showed that mechanical properties such as micro hardness and tensile stress exhibited an increase by ECAP as was reported before in many metals and alloys. However, the degree of hardening of ECAPed sample was different among three orthogonal planes in different routes. This anisotropic strain hardening seems to be characteristics to BCC metals. The isotropic hardening in the material processed by route Bc reflected the isotropic configuration of HAGB. Namely, this isotropic hardening tendency was observed due to spatial configuration of HAGB and high dislocation density in route Bc. Davenport et al. suggests that the 45˚ rotation of billets in route Bc resulted in cross hardening by interactions of mobile dislocation with geometrically necessary dislocation [14] . These interactions make it be difficult to reverse dislocation movement leading to effective dislocation accumulations and development of HAGB. On the other hand, in routes A and C, activated slip planes are nearly parallel in successive ECAP passes. Since screw dislocations are predominant in BCC metals, positive and negative screw dislocations pairs tend to meet by cross-slip and disappear in both the forward-forward and forward-reverse shear in successive passes. It explains the less effective dislocation accumulations and less development of HAGB [15] .
We carried out Tafel corrosion tests to examine how anisotropy of HAGB spatial configuration affects the corrosion resistance stability. Breakdown potential in Tafel increased with the increasing number of ECAP passes. The increasing of corrosion potential can be explained by a shift in the boundary between imperfect passivity and the corrosion region [16] . It indicates that the protective passive layer in the ECAPed sample is more stable than the as-received sample [17] . As a result, corrosion potential of material processed by route C exhibited the highest potential. The increasing of corrosion resistance may be attributed to the more uniform microstructure, due to the increment of the dislocation density and the dislocation accumulation [17] . Peguet et al. also suggests that the increment of corrosion potential is related more to the total density of dislocations induced by cold working (macroscopic effect) than to local structures such as pile-ups (mesocopic effect) [18] . The improvement of corrosion potential can be explained by surface process [19] -[21] . It was commonly interpreted as chromium enrichment in the passive film [21] .
5. Conclusions
The microstructural evolution of extremely low CN Fe-20%Cr alloy processed by ECAP for up to four passes via routes A, Bc and C were quantitatively analyzed by focusing on the degree of their anisotropy.
The anisotropy of HAGB spatial configuration in three orthogonal planes and the array of deformation induced HAGB were different among the three deformation routes. They were generally isotropic in route Bc, namely the grains were equiaxial, and the density of HAGB were comparable in the three orthogonal planes. On the other hand, they were more anisotropic in routes A and C.
The mechanical properties by micro hardness and tensile stress exhibited an increase by ECAP. The degree hardening was different among three orthogonal planes. Consequently, the isotropic hardening in route Bc reflected the isotropic configuration of HAGB.
Breakdown potential in Tafel increased with the increasing number of ECAP passes. The increasing of corrosion potential can be explained by a shift in the boundary between imperfect passivity and the corrosion region. It indicated that the protective passive layer in the ECAPed sample is more stable than the as-received sample.