1. Introduction
Over the past fifty years, Nigeria has earned enormous revenues from her oil subsector but the country has little or nothing to show for it according to Akinlo [1] . In the literature economies that had similar experience as Nigeria’s are usually described as having the “Dutch Disease”. Otaha [2] points out that the Dutch Disease is the theory that a resource export boom has an inherent tendency to distort the structure of production in favor of the non-traded goods sector relative the sector producing the non-booming tradeables. The volatility of international oil prices coupled with the recent reduction in the importation of crude oil by the United States has intensified calls for the diversification of the economy and revenue base. A paper by Lewis [3] shows that failure to diversify from oil is an important underlying source of Nigeria’s economic stagnation. Ross [4] argues that oil hinders democracy resulting in a country turning into a “rentier” state; Abebefe [5] warns of the dangers of overly dependence on oil stressing that oil has finite life and would deplete and also that oil revenues are not dependable because oil prices are exogenously determined; still, even if Nigeria takes steps to diversify her economy, it faces enormous challenges, see Akeem [6] , as a result of the declining non-oil exports and loss of market share in the non-oil trade, globally. Igwe [7] noted that the challenges facing the Nigerian economy are not only market-based, implying that nonmarket factors affect the economy too. Broadly speaking, market-based factors relate to the issues of competitiveness, financial, economic, and functioning of markets as well as legal framework. Nonmarket factors, on the other hand, relate to any issues occurring outside the workings of markets or established legal framework. This study explores how nonmarket factors affect the Nigeria’s non-oil sector.
2. Brief History of the Nigeria’s Non-Oil Sector
Before the discovery of oil in commercial quantity in the mid-950s, the Nigerian economy was characterized by the predominance of subsistence and commercial activities; narrow disarticulated production base, with illadapted technology; weak institutional capabilities; and neglected informal sector. The various policies of the pro-oil boom era “failed” to address the identified features of the economy Ekpo [8]. In the early 1960s, the agricultural sector suffered from low commodity prices. The contribution of agriculture to GDP was 63 percent in1960. The growth of agriculture for the periods 1960-1970 and 1970-1978 was unsatisfactory. By the mid- 1980s, the economy became heavily dependent on oil: Oil revenue represented almost 90 per cent of foreign exchange earnings and about 85 per cent of total exports. With the enormous oil revenue at the disposal of government and little or no sense of accountability, primitive accumulation intensified according to Obi [9] . Others such as Adeyeri [10] argue that economic disequilibrium between the oil and non-oil sectors in Nigeria is rooted in the economic structure inherited from the colonial rule. Another study by Moses [11] finds evidence that foreign direct investment flow to Nigeria was directed mainly to the oil and extractive sector. An interesting viewpoint by St. Matthew-Daniel [12] sees the root of the problem to be the general lack of production capability and Industry to process raw and natural resource. For John Litwack [13] , lead economist of the World Bank, the key task for Nigeria is to establish an institutional framework that can buffer government expenditures from oil prices. Next the researcher shows the extent to which nonmarket activities such as poverty, corruption, political instability, and primary school enrollment affect the Nigeria’s non-oil sector.
3. The Concept of Market Internality
The concept of market internality has been coined by Ikwueze [14] to explain how nonmarket activities affect markets. Market internalities can manifest in the economy in form of negative and positive. Negative internalities occur when nonmarket participants affect the efficient allocation of resources by imposing extra costs on a market while engaging in any activities outside a market transaction. Figure 1 shows how negative internalities affect efficient allocation of resources on a market. Figure 1 shows that when a firm incurs some extra costs resulting from activities of nonmarket participants, the supply curve St lies farther to the left (or above) than it would if the extra costs resulting from negative internalities were not taken into account. This means that St includes extra costs from a nonmarket economic agent and S does not. The market supply reflects both direct private costs and extra costs and therefore overstates total costs and understates total benefits. The outcome is shown in Figure 1 where equilibrium output Qt is less than optimal output Qo . The result is that the market under produces the good or service, and resources are under allocated. The price of the good is too high and the output of the good is too low to be at efficient market level Qo . As a result, market failure occurs in the form of under allocation of resources to the production of the good. Positive internalities occur when individuals, businesses, and governments affect the efficient allocation of resources by imposing extra benefits on a market while engaging in nonmarket activities. Below, Figure 2 shows how positive internalities affect efficient allocation of resources in a market. It shows that when a business earns some extraneous benefits resulting from nonmarket activities, the market demand curve Dt lies more to the right (or above) than it would if the extra benefits were not taken into account. This means that Dt includes extra benefits from nonmarket activities and D does not. The market demand reflects both the private and extra benefits and therefore overstates total benefits and understates total costs. The outcome is shown in Figure 2 where equilibrium output Qt is larger than optimal output Qo . The market overproduces the good or service, and resources are over allocated. The price of the good may be high, the same or low, depending on the exact source of positive internalities; and the output level may be too high compared with the efficient market level Qo . Thus, a market failure occurs due to over allocation of resources to the production of the good.
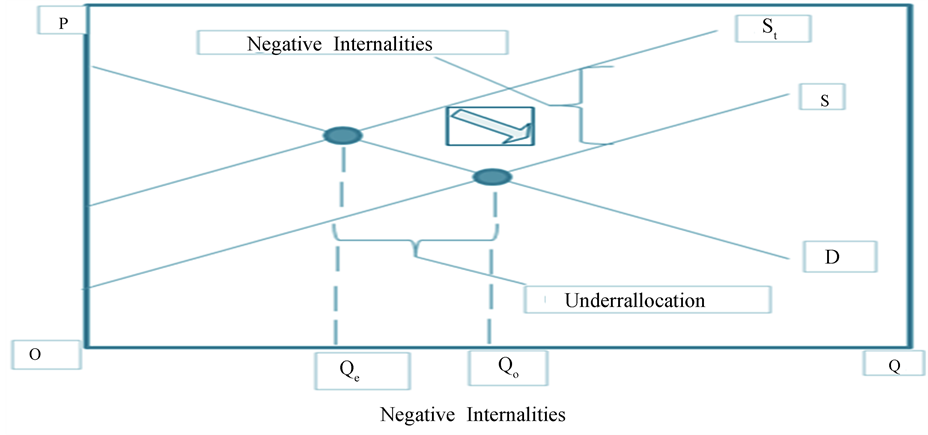
Figure 1. How nonmaket activities negatively affect markets; Source: prepared by the reasearcher, 2013.

Figure 2. How nonmaket activities positively affect markets; Source: prepared by the reasearcher, 2013.
4. Selected Sources of Market Internality in Nigeria
This study presents a brief description of the four sources of market internality that affect Nigeria’s non-oil sector such as poverty, corruption, political instability, and primary school enrollment. NONOIL (DEPENDENT): The data used for this study are extracted from the Nigerian Bureau of Statistics and various issues of Central Bank of Nigeria Annual Report. POVERTY (Negative internality): Data are extracted from the Nigeria Institute of Social and Economic Research (NISER) which employs the dynamic computable general equilibrium model to try to identify both direct and indirect effects of government policies on growth-inequality-poverty. A recent study by Okoroa for [15] noted that poverty is a major issue in Nigeria and stands at 62% in 2013, see World Bank [16] . CORRUPTION (Negative internality):Governance score relative to capturing perceptions of the extent to which public power is exercised for private gain, including both petty and grand forms of corruption, as well as “capture” of the state by elites and private interests. Data are gathered from Internet Center for Corruption Research. POLITICAL INSTABILITY (Negative internality): This measures perceptions of the likelihood that the government will be destabilized or overthrown by unconstitutional or violent means, including politically motivated violence and terrorism. Data are gathered from the World Bank Worldwide Governance Indicators [17] . PRIMARY SCHOOL ENROLLMENT (Positive internality): This measures the ratio of total enrollment, regardless of age, to the population of the age group that corresponds to attending primary school. Data are extracted the Index Mundi [18] and the United Nations Education, Scientific, and Cultural Organization (UNESCO) [18] .
5. Model Specification
An autoregressive distributed lag model in its simplest form is considered as (ADL (1,1)) model, see Chen[19] :
Yt=m+A1Yt-1+B0XtB1Xt-1+Ut, (1)
where Yt and Xt are stationary variables, and Ut is a white noise. The White Noise Process: A sequence Ut is awhite noise process if each value in the sequence has a mean of zero, constant variance, and is serially uncorrelated. The sequence Ut is a white noise process if for each period t , the following relationship applies: ΕUt=ΕUt-1=⋅⋅⋅=0; ΕUt2=ΕUt-12=0;ΕUtUt-s= ΕUtUt-j-s=0. For all U estimation, these applies: (i) If ΕXtUt≠0, then the ordinary least square would be inconsistent; (ii) If Ut is a white noise, or stationary and independentof Xt , Xt-1, ⋅⋅⋅, and, Yt, Yt-1, ⋅⋅⋅, the autoregressive distributed lad models can be estimated by ordinary least model. For the purposes of re-parameterization to error correction model (ECM) the following applies: thus, because Yt is equivalent to Yt-1+△Yt and Xt is equivalent to Xt-1+△Xt, we substitute Yt and Xt with Yt-1+△Yt and Xt-1+△Xt , respectively. Therefore the equation can be represented in the following ways:
△Yt=m+B0△Xt-1-a1Yt-1+B0+ B1Xt-1+B1Xt-1+Ut, (2)
△Yt=B0△Xt-1-a1Yt-1-m/1-a1-B0+ B1/1-a1Xt-1+Ut (3)
If we let j0=1-a1; j1=B0+ B1, we can further rewrite the equations in the error correction form as follows:
△Yt=m+B0△Xt-j0[Yt-1-m/1-a1-B0+ B1/1-a1Xt-1 ] +Ut; and the total long term effect/long run multiplier (equilibrium), say, k1, is therefore this: k1=[j1/-j0] ; Y and X will be in their long term equilibrium state when Y=k0+k1X, where k0=[m/-j0] . This is called the error correction model (ECM). In summary the ECM concludes that the current change in Y is the sum of two components. The current change in Y is proportional to the current change in X . The current change in Y is a partial correction for the extent to which the lag of Y (i.e., Yt-1 ) deviates fromthe equilibrium values corresponding to Xt-1 (the equilibrium error); differencing and forming a linear combination of the non-stationary data transform all variables in an ADL model equivalently into an ECM with stationary series only. Next the researcher adopts the Stata software to estimate the relationships between the variables understudy, notably non-oil sector, poverty, corruption, political instability, and primary school enrollment.
6. Estimation Techniques and Results
The estimate the relationship between Nigeria’s non-oil sector and poverty, corruption, political instability, and primary school enrollment the following tests were conducted. In order to determine the appropriate lag for this study the Akaike Information Criterion (AIC), Schwarz’ Bayesian Information Criterion, and Hanna-Quinn Information Criterion are estimated, as shown in Table 1, below:
6.1. Unit Root Test
Usually when time-series data are aggregated, a moving average (MA) error term arise. One way to deal with it is to include lagged values of the dependent variable in the Dickey-Fuller regression. The Dickey Fuller [20] unit root test is one of the most commonly used tests for stationarity. The standard Augmented Dicker-Fuller test is performed to assess the degree of integration of selected variables. The null hypothesis is that the time-series data have a unit root: H:w0, and the alternative hypothesis is that the time-series data are stationary: H:w 1. An autoregressive model can be represented according to Said [21] in the general drift/trend case by this equation:
△Yt=B0+Yt+a-1Yt-1+ΣBt△Yt-1+Et, where, Et is i.i.d. (0,s2) (4)
Therefore, based on Equation (4), because this study uses time-series data, to avoid getting a spurious regression model, the augmented Dickey-fuller test for stationarity of the series was conducted. The augmented DickeyFuller test is highly recommended if we are dealing with time-series data, according to Gujarati [22] . The nullhypothesis is that the series are non-stationary while the alternative hypothesis is that the series are stationary. If the calculated statistic turns out to be less than, see Mackinnon [23] [24] , critical values, then the null hypothesis has to be accepted, meaning that there is a unit root in the time-series data. This implies that the series is not stationary. But if the calculated statistic is greater than the Mackinnon critical value, then there is no unit root in the data, implying that the time-series data are stationary. Table 2 shows that all the variables are non-stationary at 5 percent significant level in their first difference, from the assumption of constant.
6.2. Co-Integration Test
Having established that the variables are non-stationary, we proceed to test for co-integration. Co-integration analysis helps to test for the existence of long-run relationship among or between variables. The multiple co-integration is based on vector auto-regression model by Johansen [25] . Individual or all series might not be stationary, but a linear combination of these series could be stationary. The theory of co-integration by Engle [26] addresses this issue of integrating short-run dynamics with log-run equilibrium. In Table 3, below, the trace statistic has the value of 78.5238 and the 5 percent critical value is 68.52. Thus the null hypothesis is rejected, meaning that there is co-integration. Therefore the study next performs the error correction model to estimate the long-run status of the variables. Therefore the study next performs the error correction model to estimate the long-run status of the variables.
Source: Computed by the researcher, 2014; Endogenous: Nonoil; Exogenous: _cons.

Table 2. Augmented Dickey-Fuller test results.
Source: Computed by the researcher, 2014.
Table 3. Johansen co-integration test results.
Source: Computed by the researcher, 2014.
6.3. Error Correction Model Test
Since it was found that the time-series variables were stationary only after first or second differencing, applying the difference variable for regression would imply loss of valuable information about the long-run relationship among the variables. In order to correct for such loss of information, the error correction estimation is used so as to integrate short-run dynamics with long run relationship as noted by Maddala [27] . The error correction estimation for this study yields the results in Table 4 below, showing estimates of the relationships between the Non-oil sector in Nigeria and rates of corruption, poverty, political instability, and primary-school enrolment. The error correction term (CE1) shows a positive value of .2616848. This means that 26% of the previous year’s disparities can potentially be adjusted for the current year. The positive sign of CE1 indicates that there are no long-term relationships among the variables. However the variables have short-run relationships. Table 4 shows that the p-values are 0.001, 0.022, 0.003, 0.003, 0.020, 0.049, and 0.020 for Non Oil, Non Oil (LD), Corruption, Poverty, Primary School Enrollment, Political Instability, and the estimate of the joint model, respectively. Thus, each of the four variables has statistically significant short-run effects on the Nigeria’s non-oil sector.
Table 4. Error correction model test results.
Source: Computed by the researcher, 2014; Lagrange Test = Lag 1 = 0.92; Lag 2 = 0.44; Jarque-Bera Test = Nonoil = 0.50.
7. Conclusion
The above study adopted the concept of market internality to explain how activities of third parties or nonmarket participants affect the Nigeria’s non-oil sector. Based on the tests conducted, the study found no long-term relationships among the variables. It however found the existence of short-run relationships among the variables, with poverty and corruption being more impactful than the other variables under study. This suggests that reducing poverty and corruption in Nigeria can be beneficial to the growth of the non-oil sector. There is little or no doubt that human and material resources resulting from lifting more people out of poverty and reducing corruption are more likely to be allocated to the Nigeria’s non-oil sector than the oil sector. Thus, reducing poverty and corruption can enhance the diversification of the Nigeria’s economy from the current oil-sector dependency to the non-oil sector.
Acknowledgements
Thanks to the board of directors of the New York State Economic Association for enabling the draft to be presented at the 66th NYSEA conference, 2013. I would also like to thank professors Dongyun Lin, K. Matthew Wong, and Edouard Mafoua who made suggestions during the panel discussion at the conference. The author remains responsible for errors, omissions, and suggestions.