1. INTRODUCTION
An United States government program known as The Older Americans Act (OAA) of 1965, established Senior Citizen Centers and charged them with the development of supportive services for the nation’s aging population. The goal of the OAA was threefold, to “reduce hunger and food security, promote socialization of older individuals, and promote health and well-being of older individuals by assigning them to access nutrition and other disease prevention and health promotion services” [1]. In 2003, when the number of persons aged 60+ was 45.7 million, over 1.8 million persons aged 60+ were receiving services through senior centers. By 2008, when the number of older adults had increased to 51.7 million, the number of senior center service users declined to 1.6 million [2,3]. This noteworthy decline in the proportion of older adults using services may be an indicator that services have been successful. Alternatively, the needs of older adults may have changed while services have not progressed. To present a multidimensional picture of service users, this study aimed to examine the physical health and well-being of OAA service users, notably those using nutrition service programs. The goal was to determine if persons who used services were healthier, more nourished, and had a higher quality of life than those who did not use services.
1.1. Service Programs
The Nutrition Services Programs are administered by the Administration on Aging (AOA) within the Department of Health and Human Services (HHS), and include three programs: 1) Congregate Nutrition Services; 2) the Home-Delivered Nutrition Services Programs commonly referred to as “Meals on Wheels”; and 3) the Nutrition Services Incentives Program. The Congregate and HomeDelivered programs target participants with the highest social and economic needs, notably low-income older adults and those with limited mobility and/or transportation. For the purpose of this study, both congregate meals and home-delivered meals were included. Within provided meals, government programming guidelines set the standard for meal composition. Each meal is required to meet 33.3% of the current dietary reference intakes (DRI). Further, special dietary needs are accommodated, as defined by the Food and Nutrition Board of the National Academy of Sciences [4].
Congregate Nutrition Services. Congregate nutrition services, or “congregate meals”, use satellite sites for meal delivery and consumption, and provision of nutriation-related services (e.g., nutrition screening, assessment, and counseling). Individuals 60 years and older, and their spouses can participate in this program and in 2009, 38% of meals were served at congregate sites [5]. Congregate meal sites are credited with increasing social and nutritional well-being of older adults [6]. Involvement in senior services decreases loneliness, promotes higher levels of life satisfaction, and improves quality of life [7]. Eighty-five percent of Turner’s (2004) sample of older adults (N = 856) valued their senior centers as important sources of social engagement [8].
Home-Delivered Meals. “Meals on Wheels” or the home-delivered meal program provides meals and other nutrition services to homebound older individuals. Individual programs are influenced by program location, available funding, and exact services provided (e.g., food delivery, nutrition education, nutrition counseling). Medical need, independent of financial need and ability to pay, determines eligibility for individuals participating in home-delivered meals, regardless of program funding [9]. A 2009 survey found that 70% of home-delivered meal respondents were aged 75 and older; 56% lived alone; 25% had annual incomes of $10,000 or less; and 59% said home-delivered meals provided at least half of their daily food intake [5]. The AOA reports that older adults are more likely to receive home-delivered meals as a first in-home service.
Senior Companions. The Senior Companion program was created in 1968 as part of the Department of Health, Education and Welfare, along with the AOA, to assist older Americans and their caregivers, or those with terminal illnesses. They do also assist with simple household chores, companionship, or assistance with daily errands. In 1973, the Senior Companion program was merged with the Foster Grandparents and the Retired and Senior Volunteer Program (RSVP) to create “Senior Corps”, all originally mandated by the Domestic Volunteer Service Act of 1973 [10].
1.2. Factors Affecting Service Use
Demographics. Aging is often beset by the onset of chronic conditions and disabilities that increase in frequency and severity across time [11,12]. However, the implications of age and disability for service use are ambiguous [13]. More recently, more women than men live beyond 65 years and spend more years living with disabilities [14]. Compounding disability, women spend more years widowed and have fewer economic resources [15].
In 2007, the US Census Bureau reported that 9.7% of older adults fell below the national poverty line. AARP (2010), using the experimental poverty measure, reported much higher levels particularly for specific groups (e.g., 25.3% for older Asians; 22.7% for those 80+ years of age) [16]. Variation in poverty rates is related to marital status (married people are less likely to be in poverty), gender (men are advantaged compared to women) [17], and ethnicity (White, non-Hispanics have lower poverty rates) [18]. Age also factors into poverty; persons >80 years of age are more impoverished. Burr, Mutchler and Warren (2005) found that service users have lower levels of education than non-users [19]. Higher incomes sustain independence whereas lower incomes leave older adults vulnerable to social isolation and poorer nutrition, and more in need of services [6,19].
Social Factors. As women may spend more years widowed and have fewer economic resources [15], these disadvantages can be offset to some extent by women’s penchant for cultivating social connectedness [20], whereas men may be disadvantaged by a reluctance to contact friends or family for assistance [21]. Specifically, women are more likely than men to participate in the services of senior centers [22]. The National Survey of Families and Households found that older married women had significantly more education, higher incomes, and greater access to health care than their widowed counterparts [20]. Thus, differences in service participation by marital status are complicated by findings that service use by widowed and married women is related to differences in education. Information regarding the relationship between marital status and service use is based largely on comparisons of widows and married women. Widows have significantly higher levels of disability than married women [23]. Married couples rate their health as better than single individuals [24] and single women are more likely to participate in senior services [25]. The authors suggest that service use may be related more to marital status than to disability.
Similarly, another social factor that must be considered is living arrangements. Residing with someone, whether a spouse, adult children, or other family members or friends, suggests the presence of social support but can also mask levels of need because they are assumed to be addressed by those in co-residence. Alternately, living alone may dispose one to use center-based services for social activity and also suggests higher ability levels and sufficient resources to maintain oneself. As early as 1983, Krout reported that service users sought social connectedness through participation in center-based services and that social integration was highly related to senior center participation [26].
Lifestyle Factors. The cumulative negative effects of lifestyle factors (e.g., alcohol, diet, physical inactivity) are associated with poorer health, decreased ability to perform ADLs [27], and increased use of services [28]. Physical inactivity has been linked to functional disability [29], heightened disease risk, poorer quality of life, increased health care costs, and more service use [30]. Sedentary older adults have greater difficulty performing ADLs and higher levels of depression, leading to an increased need for assistance, services, and financial support [31]. In particular, people with moderate disability find senior services are valuable, but in time their disabilities may become too great for participation in community services [32].
Conversely, PA among community-dwelling older adults has been related to improved psychological and physical well-being. A meta-analysis of 36 studies of the relationship between PA and psychological well-being found both direct and indirect benefits of activity in community-dwelling older adults [33]. Further, Bruce, Fries, and Hubert (2008) followed older adults across 13 years and found that for overweight and normal weight individuals, physical inactivity was a better predictor of morbidity than weight. They encourage initiatives that focus on activity rather than on weight per se [34].
The World Health Organization (WHO) has classified solitary older adults as a high-risk population. Aday (2003) found that the social connectedness developed at senior centers was positively related to emotional security, self-efficacy and positive affect as well as positive health outcomes [35]. Senior services increase the potential for developing beneficial and self-selected relationships that are likely to enhance psychological well-being. It has been observed that older adults spent 5% of available time with friends, and living arrangement was a significant factor in the among of an individual’s social time.
In similar manner, Hsieh, Sung, and Wan (2010) found that older adults who spend more time alone consumed fewer fruits and vegetables each day, inadequate amounts of fluids, and fewer dairy products [36]. Further, solitary older adults were at a higher risk for poor nutrition compared to their non-solitary counterparts. The jeopardy to nutrition was especially significant for older persons who lived alone and did not participate in congregate meals or other service programs, and were eating alone on a regular basis. This study also found that over 75% of solitary older adults were at moderate-to-high risk of malnutrition, as subjects had no fixed eating schedule and ate foods with poorer nutritional value. Other studies have also found a higher prevalence of malnutrition and risk of malnutrition in older adults who live alone than those who live with their families [37].
2. METHODS
2.1. Recruitment
Participants were recruited through ads, word of mouth, flyers and informational sessions at community centers and organizations whose membership included older adults: Commissions on Aging, Congregate Meals and Home Delivered meal programs, Older Adult Centers, Veteran’s Associations, Foster Grandparents, Retired Women’s Network and Caregiver Support Groups. Interviews took place at the participants’ home or at the site of recruitment, with the caregivers present, whenever possible. Caregivers were defined as family members or other qualified individuals who cared for participants who were non-verbal or otherwise incapable of providing accurate information. Data obtained from third parties, or caregivers, were evaluated against data obtained from the primary respondent for items dealing with nutritional information and health. Interviewers read the questions to the participants and most surveys took one hour to complete.
2.2. Inclusion/Exclusion Criteria
Inclusion criteria consisted of ability to give informed consent; 60+ years of age; and completion of at least 25% of questions. Respondents who were clearly incapable of supplying informed consent were excluded from the study, as were those who declined to have waivers signed.
All participants signed informed consents, but no identification was included with the data. Participation was voluntary and uncompensated. Caregiver information and any third party verifications included additional consent forms. All data were housed in locked file cabinets and only accessible to the primary investigator. Electronic data was password protected and housed on computers that were in locked offices on the campus where the primary investigator had obtained approval. The research was approved by the primary institution’s Institutional Review Board (IRB) and Human Subjects Committee.
2.3. Study Design
Initial recruitment yielded a convenience sample of 1100 community-dwelling rural older adults from the Midwestern United States; 35 participants were removed from the sample because of incomplete data. In the remaining sample (N = 1,065; M age = 75.5 years; S.D. = 8.4) 65% were women and 45% were married. Participants averaged 13 years of education and most lived in two-person households. Eighty-nine percent were white; African Americans accounted for 5% of the sample.
2.4. Instruments
Service Use. Service use was determined by consistent use of services available through senior services or other service organizations. Services were listed and marked for participation (e.g., “Do you participate in congregate meals?” [1 = “yes”; 2 = “no”]) and frequency of use (“How often do you participate in congregate dining at the older adult center?”). Noted programs queried were nutrition services, home help, and senior companions.
Demographics. Demographic items, part of the Chronic Illness Resources Survey, assessed age, marital status, education level, religious affiliation, and gender (36 items). Marital status was measured using categorical responses (1 = “single,” 2 = “married,” 3 = “divorced,” 4 = “widowed”). Social engagement was measured with openended questions regarding participation in social events (e.g., Book Club? 1 = “yes”; 2 = “no”), hobbies, and duration of participation in number of months. The survey asked for income ranges but 70% of the respondents omitted this information. Because of the low response rate, income was not included in the analyses. Living arrangement was measured dichotomously (1 = “living alone,” 2 = “living with others”) as well as by openended questions (“Who do you live with?”), type of housing, and number of persons residing in the home.
Health and Physical Well-Being. Health and physical well-being was measured by self-reported diagnoses which were verified through caregivers, medical records, and cross checking of medications. Physical impairments were assessed through caregiver and self-report, medical record verification, and interviewer observation. Questions regarding medical conditions, sensory health and ability to perform ADLs (e.g. feeding, toileting, dressing, grooming, bathing) and IDALs (managing finances, handling transportation, shopping, preparing meals, managing medications, housework) were answered by the participants directly.
Nutritional Status. Three measures were used to depict the nutritional status of participants. The Block Full Length Food Frequency (FFQ) is a 160-item questionnaire with multiple responses per item; it assesses the frequency of eating and serving size of specified foods (α = 0.77) [38]. The 24-hour recall (24HR) asks participants to list the foods they have eaten during a specified time span (α = 0.80) [39]. The Mini Nutritional Assessment (MNA) is a 27-item multiple-choice assessment whose specificity, sensitivity and validity range from 96% - 98% (α = 0.89) [40].
Nutritional status was calculated using the gram, milligram, and microgram intake of all macro and micronutrients in the respondent’s diet and compared to dietary recommendations which are based on age, gender, weight, and PA levels, and compared to recommended daily allowance (RDA) and dietary reference intake (DRI) levels. If the discrepancy between calculated recommendations and actual intake were greater than normal variations, nutritional status was deemed to be “poor”.
The Physical Activity List chronicles number and frequency of activities, duration of each performance, and years of participation in each (α = 0.60) [41]. The Health Survey was comprised of 17 items from the original 36 item survey, and addresses limitations in PAs secondary to health problems, limitations in social activities because of physical or emotional problems, general mental health, vitality, among many others (α = 0.85) [42]. In this study, reported PAs ranged from chair exercises to running on a treadmill.
Psychological Well-Being. Memory was assessed by self-reported forgetfulness, caregiver reports on forgetfulness, and documentation in medical records (“Do you forget to take your medications?” [1 = “yes”; 2 = “no”]). Frequency and duration of memory impairment were recorded in episodes and months, respectively. Depression was measured by evidence of a physician’s diagnosis and evidence of a prescription for an antidepressant (if applicable), confirmed through a chart review and/or a family member. The presence of depression was coded dichotomously (1 = “yes”; 2 = “no”).
2.5. Analysis
Service users (n = 177) were compared to non-users (n = 888) on demographics, ADLs, health and physical wellbeing, psychological well-being, and social engagement. Significant service use was calculated from services specifically available to seniors in relation to nutrition (home delivered meals congregate meals).
Multiple comparisons were adjusted post hoc using the Bonferroni procedure when appropriate. Dichotomous variables were coded as “0, 1” and logistic regressions were used to determine contributions to binary outcomes. T-testing, Spearman correlations, linear and logistic regressions were performed. Mann-Whitney-U testing, appropriate for nonparametric data, and t-tests (two tailed, equality of variance not assumed according to Levene’s testing) were used to determine differences between the service users and non-users.
The t-test comparisons for available data for respondents versus non-respondents on select characteristics, such as age, were not statistically significant. A subsample of the population was used to determine inter-rater reliability (n = 21) at the start of the investigation. Interviewers had high rates of inter-rater reliabilities at alpha levels of 0.93 between identical questions asked of the same subject by different interviewers on different days.
For the purpose of this study, “significant service use” was defined as consistent daily or weekly use of two or more available senior services. Within the non-user of services subgroup, the respondents were further subdivided into those with unmet needs versus those whose needs were met. Individuals with unmet needs, who will be referred to as the “at risk” subgroup, were assessed by poor dietary patterning, poor overall nutritional status, disability without increased assistance, indicators of poorer overall health and nutrition, and threats to social engagement. Group assignment was determined by need factors, including physical health, nutritional status, and overall absence of frailty indicators.
3. RESULTS
1100 participants were recruited for the study. 35 failed to complete at least 25% of requested information, specifically demographic and health information, and were eliminated from the sample. Service users (n = 177) accounted for 16.6% of the total participant sample (n = 1065). Descriptive statistics indicated that some data was nonparametric (Table 1). Chi square analysis showed statistically significant differences for race, age, and marital status (Table 1). Logistic regressions were used to test for differences between users and non-users of services for age (b = −0.08; p < 0.001) and for marital status, (b = −0.3.4; p < 0.02) (Table 2).
Demographics. Independent t-testing found that service users were 5 years older and only 23% were married (Table 1). There were no other significant differences in remaining demographics. A two tailed t-test showed no statistical differences between third party verified data and self-reported data from primary respondents.
A group of non-service users were defined as having unmet needs (n = 331). This group, shown in Tables 3 and 4, displayed significant differences in age and marital status compared to their counterparts, non-service users whose needs were met. They were older (p < 0.001) and more likely to be widowed (p < 0.05) (Table 4). This subset of non-users had significantly greater difficulties with ADLs and IADLs (Table 3). For these reasons, this group will be referred to as the “at risk” group. Logistic regression showed that, besides the constant, only age was a significant contributor to the variance regarding categorization of a non-service user with unmet needs, although classification of the respondents was performed using several key indicators, based on physical health, nutritional status, and social engagement.
More closely, “at risk” individuals were primarily female, Caucasian, widowed, and in their early seventies, as noted in Table 4. They had a high school education or less and lived alone. The “at risk” group had an average gross income was less than those with met needs, 80% reported incomes below $40,000 for their household, in contrast to 80% overall reporting a gross income below $60,000 annually. It should be noted that income was
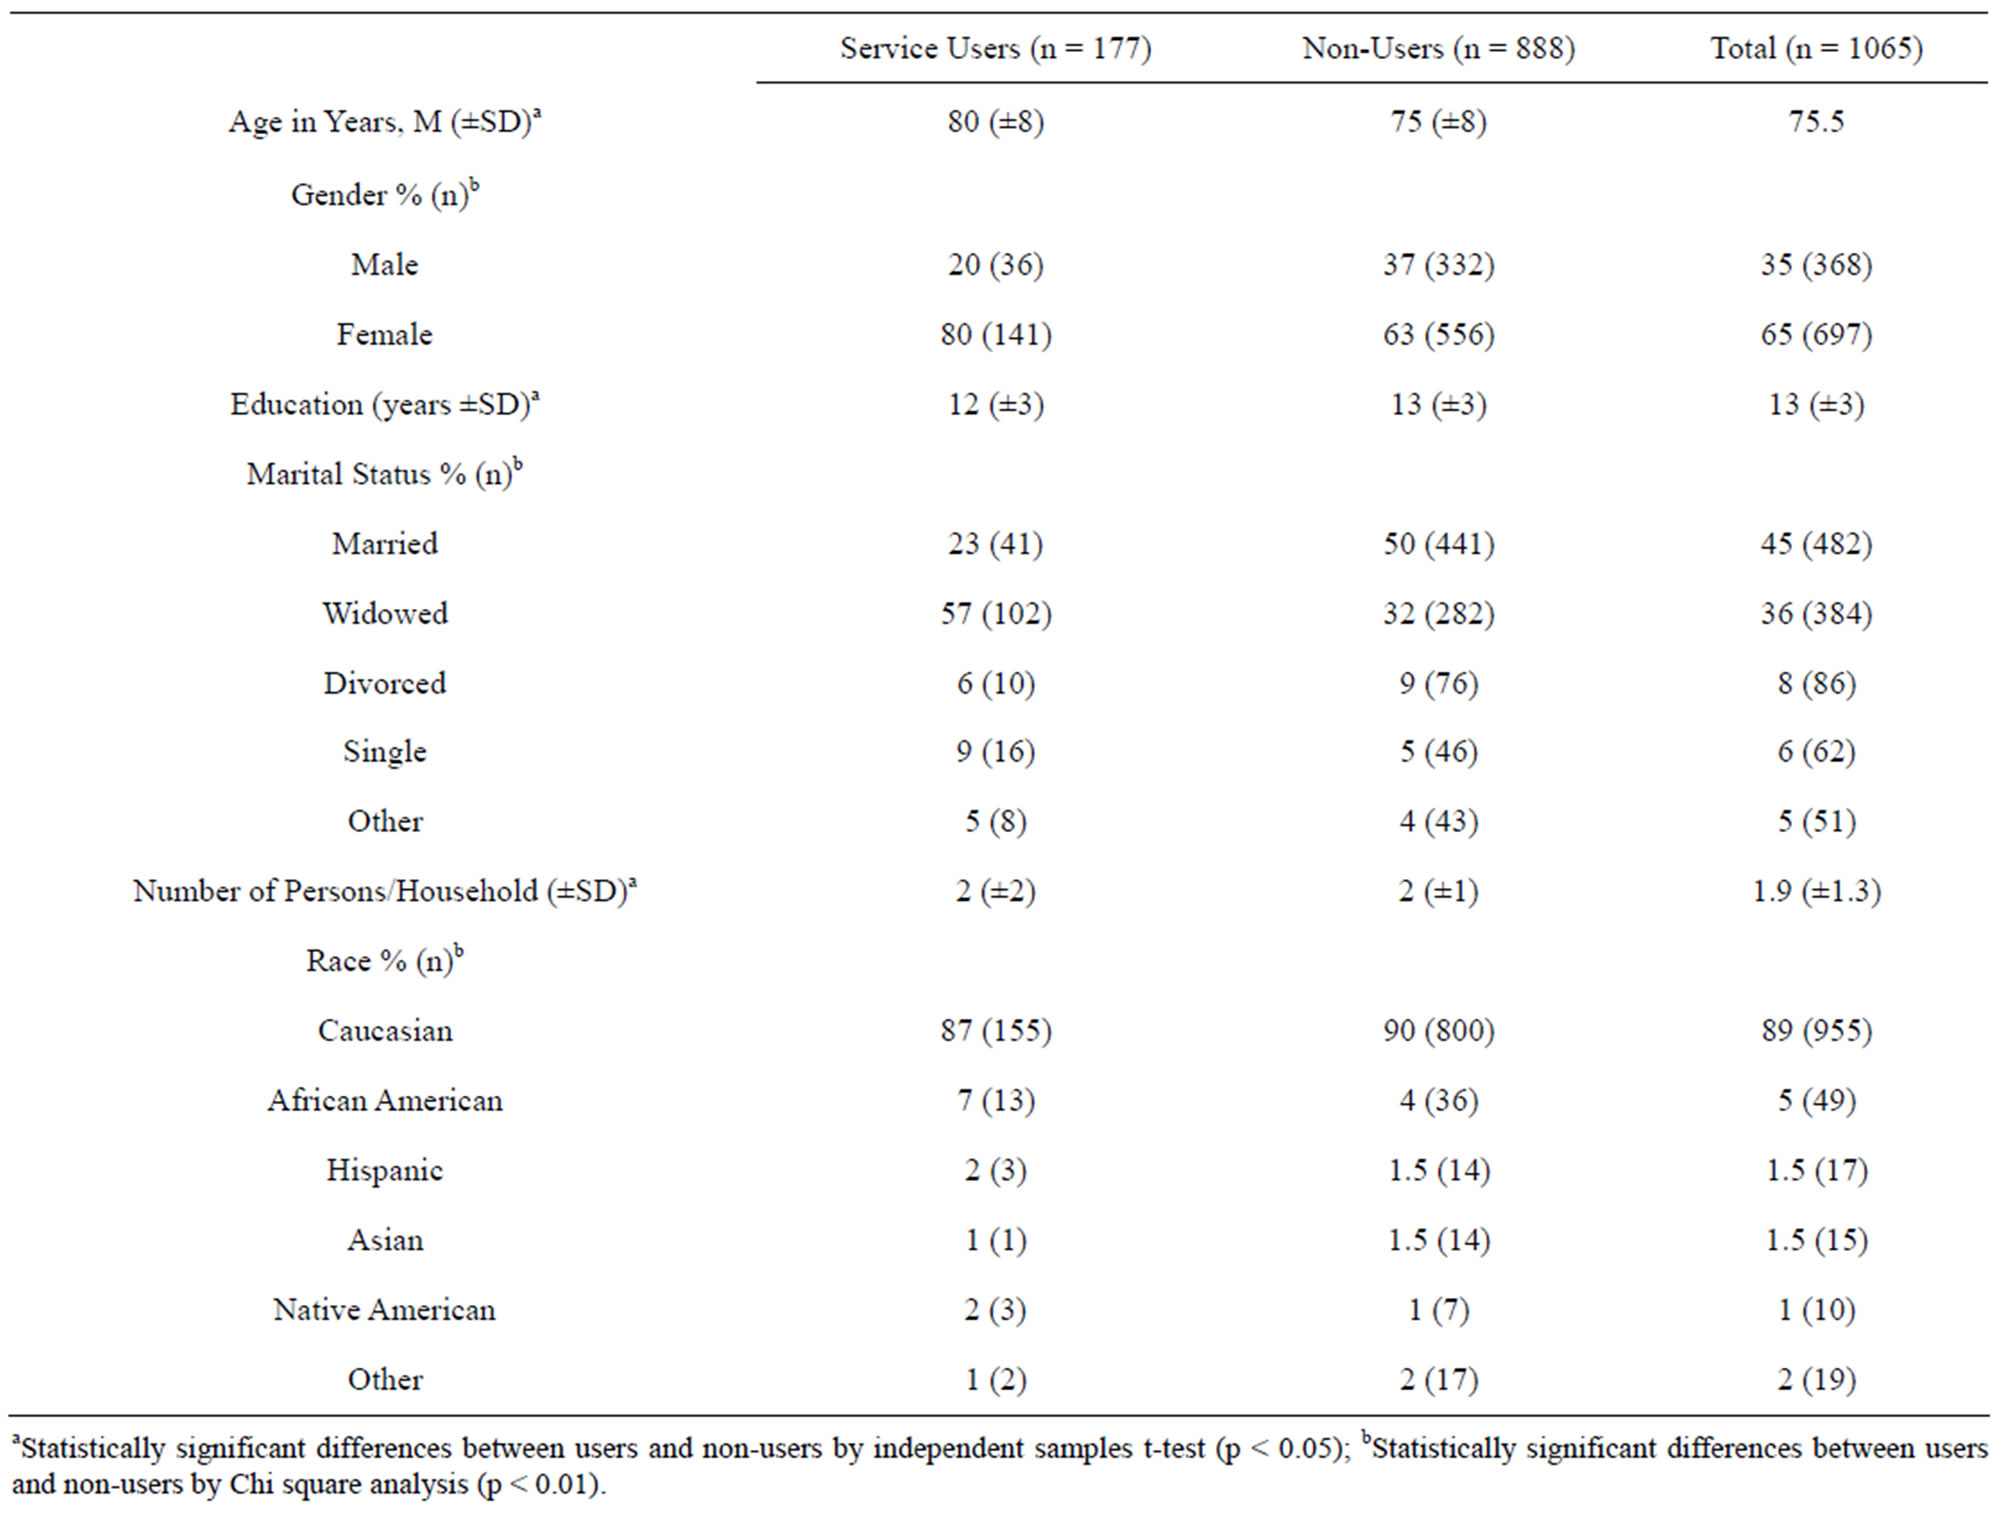
Table 1. Sample characteristics for all participants (n = 1065).
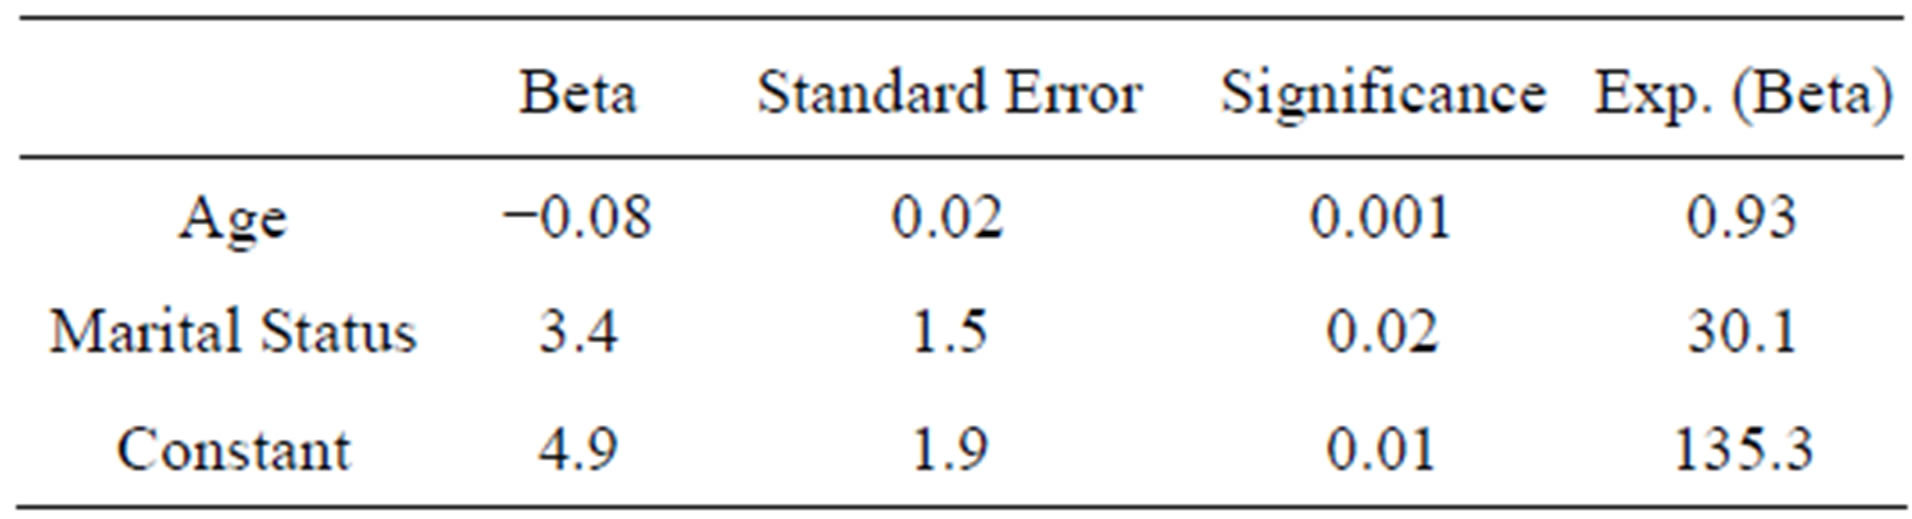
Table 2. Logistic regression results for elected demographic variables and service users (n = 177) versus non-users (n = 888).
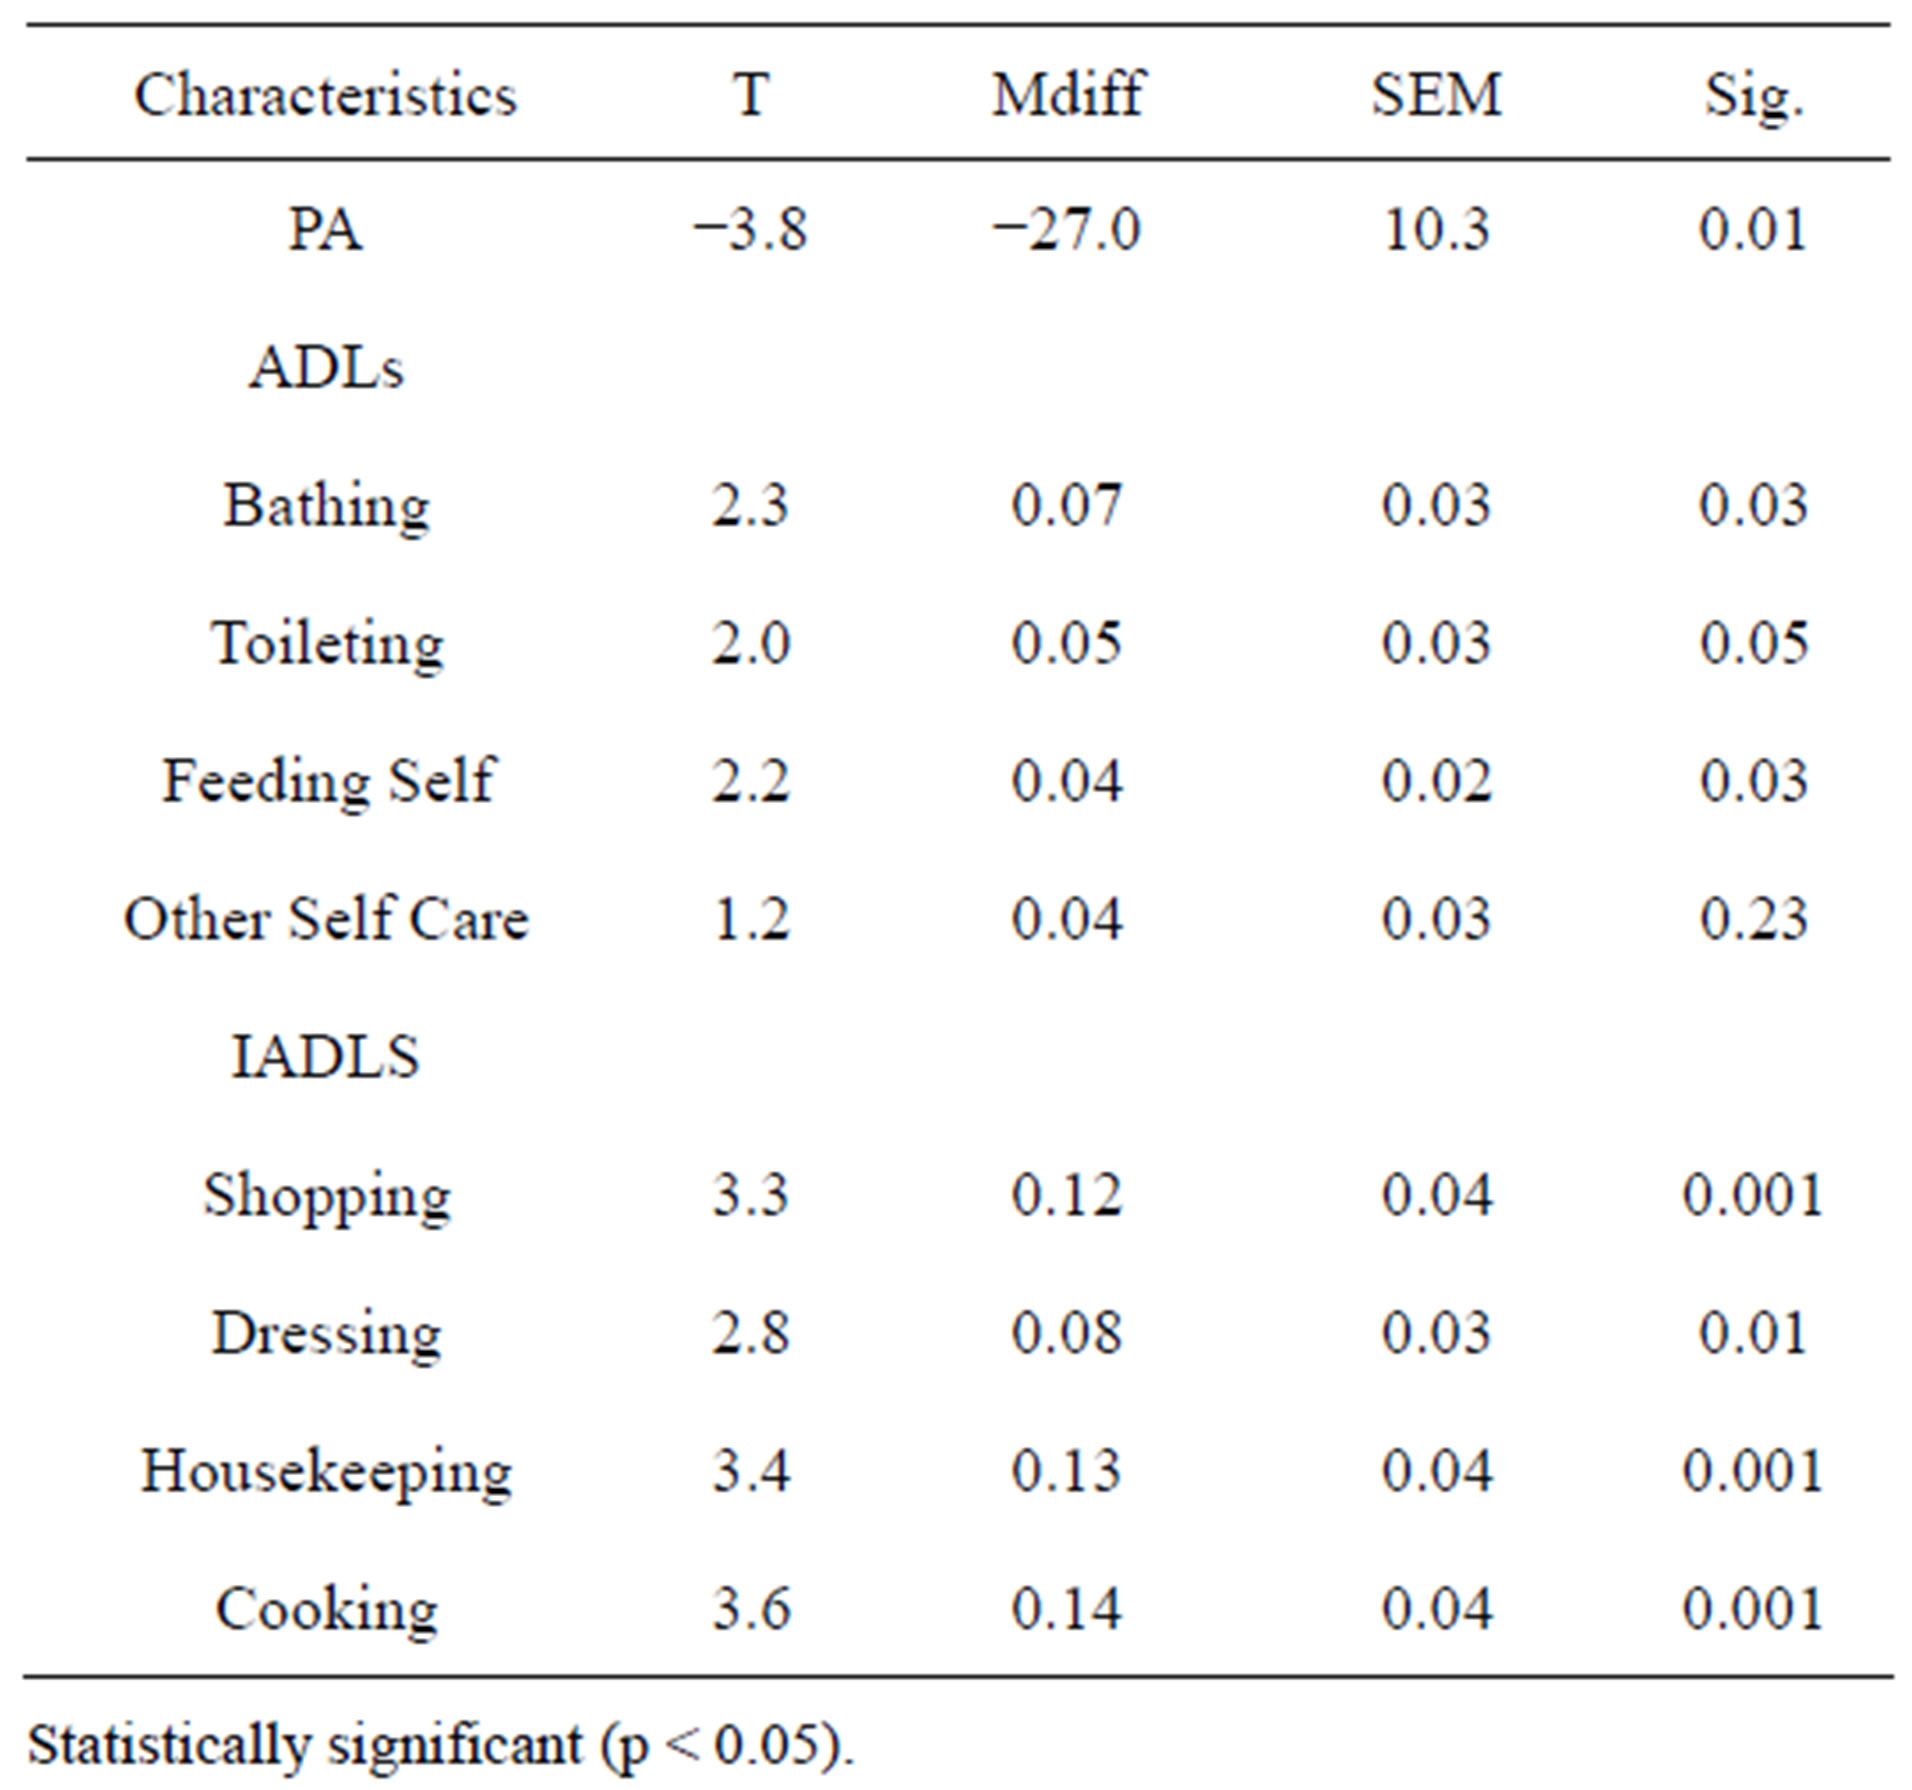
Table 3. T-testing for differences between service users (n = 177) and non-users (n = 888) for indicators of PA and ADL.
reported by less than half of all respondents and therefore was not analyzed. Persons fitting this description should be thoroughly screened to ensure delivery of services to address these unmet needs.
Lifestyle Factors. For social engagement and activities, Mann-Whitney U testing showed significant differences between service users and non-users. Service users participated in fewer social activities (z = −2.5; p < 0.01) outside service activities and reported less interpersonal interaction (z = −1.9; p < 0.05) (Table 5). For non-service users, the mean number of meals eaten alone per day was 1 (S.D. = 1) and the number of days per week that they ate at least one meal alone was 4 (S.D. = 3) when compared to service users.
Significant differences were seen between service users and non-service users on measures of mental health. Service users had poorer memory (z = −3.9; p < 0.001) and a higher frequency of a depression diagnosis (z = −2.0; p < 0.05). Statistically significant differences between groups were also found for four of six indicators of physical health and well-being, which are detailed in Table 5. T-tests were used to compare physical activity between service users versus non-users (T = −3.8; p < 0.01). Significant differences were also found between
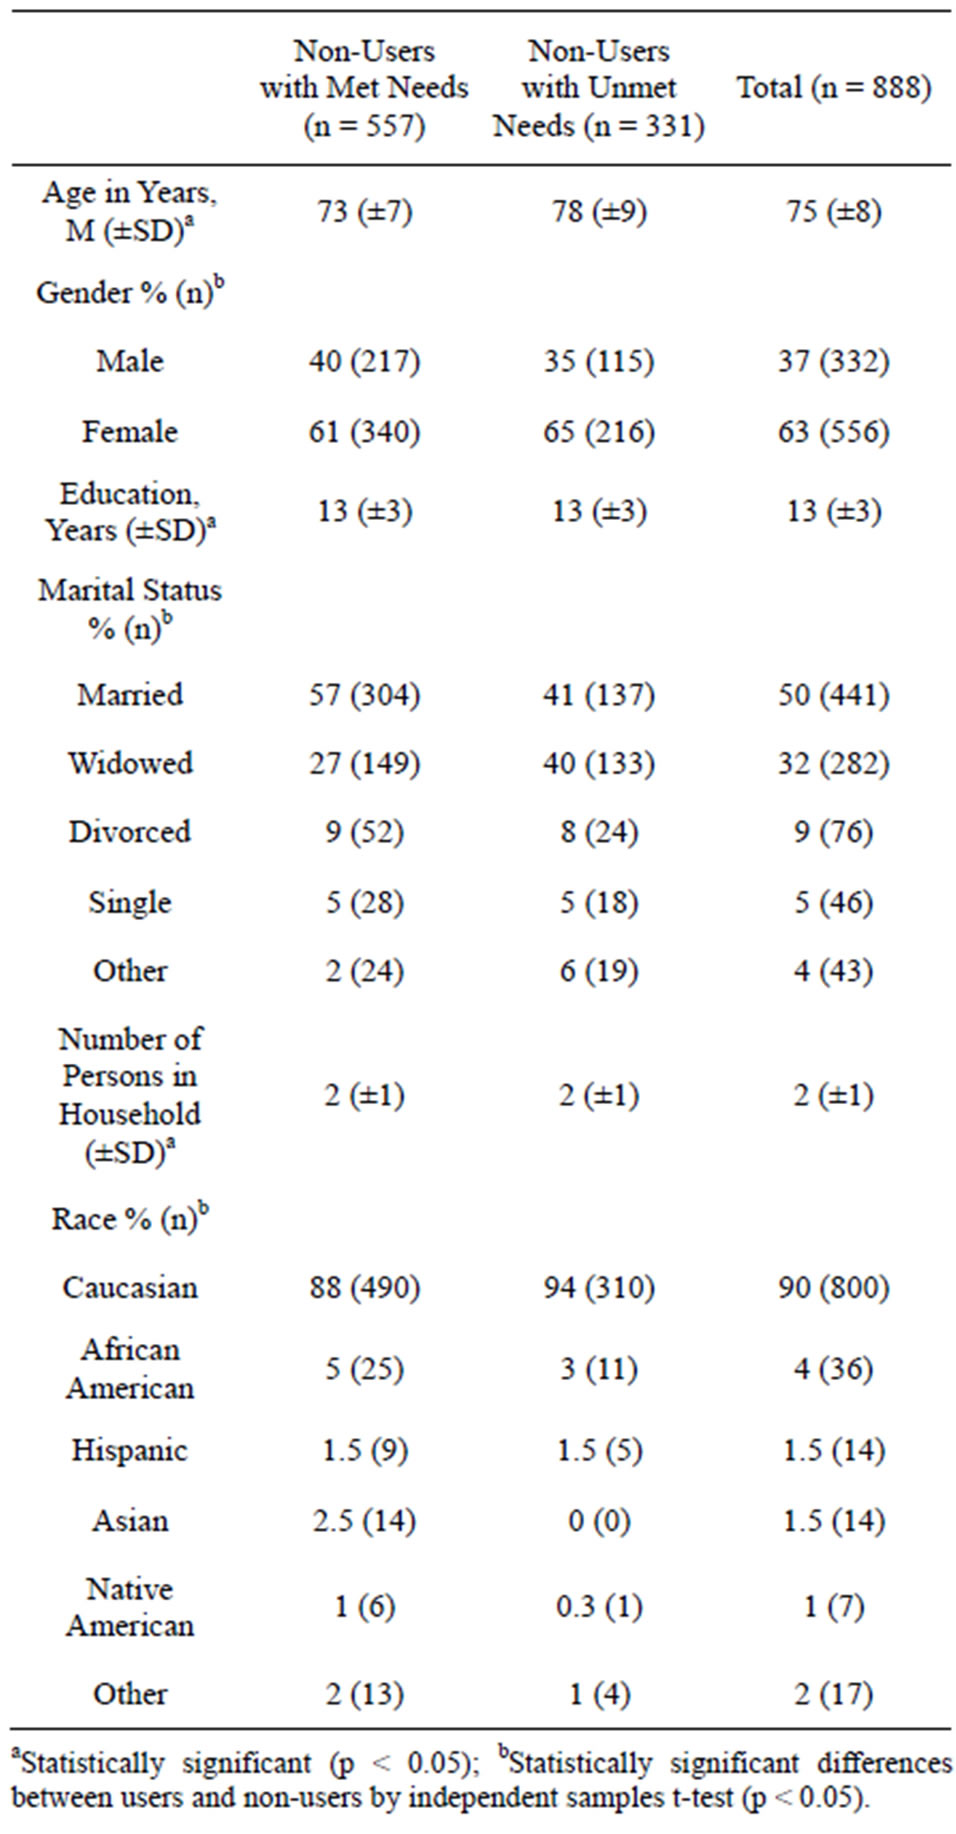
Table 4. Sample characteristics (n = 888) for non-users with met and unmet needs.
users and non-users with respect to basic and instrumental activities of daily living. Service users had lower IADL scores and were less active (Table 3).
The “at risk” participants had poorer nutritional status when compared to service users, with decreased intake of several key vitamins and minerals and increased intake of macronutrients such as saturated fat. Non-service users, but not those deemed “at risk”, engaged in more physical activity as a group overall, with more years of participation, greater duration of exercise and greater frequency of exercise than service users.
However, a substantial percentage of this sub-sample (33%) was not able to engage in physical activity, or reported shorter duration, less frequency and lower levels w
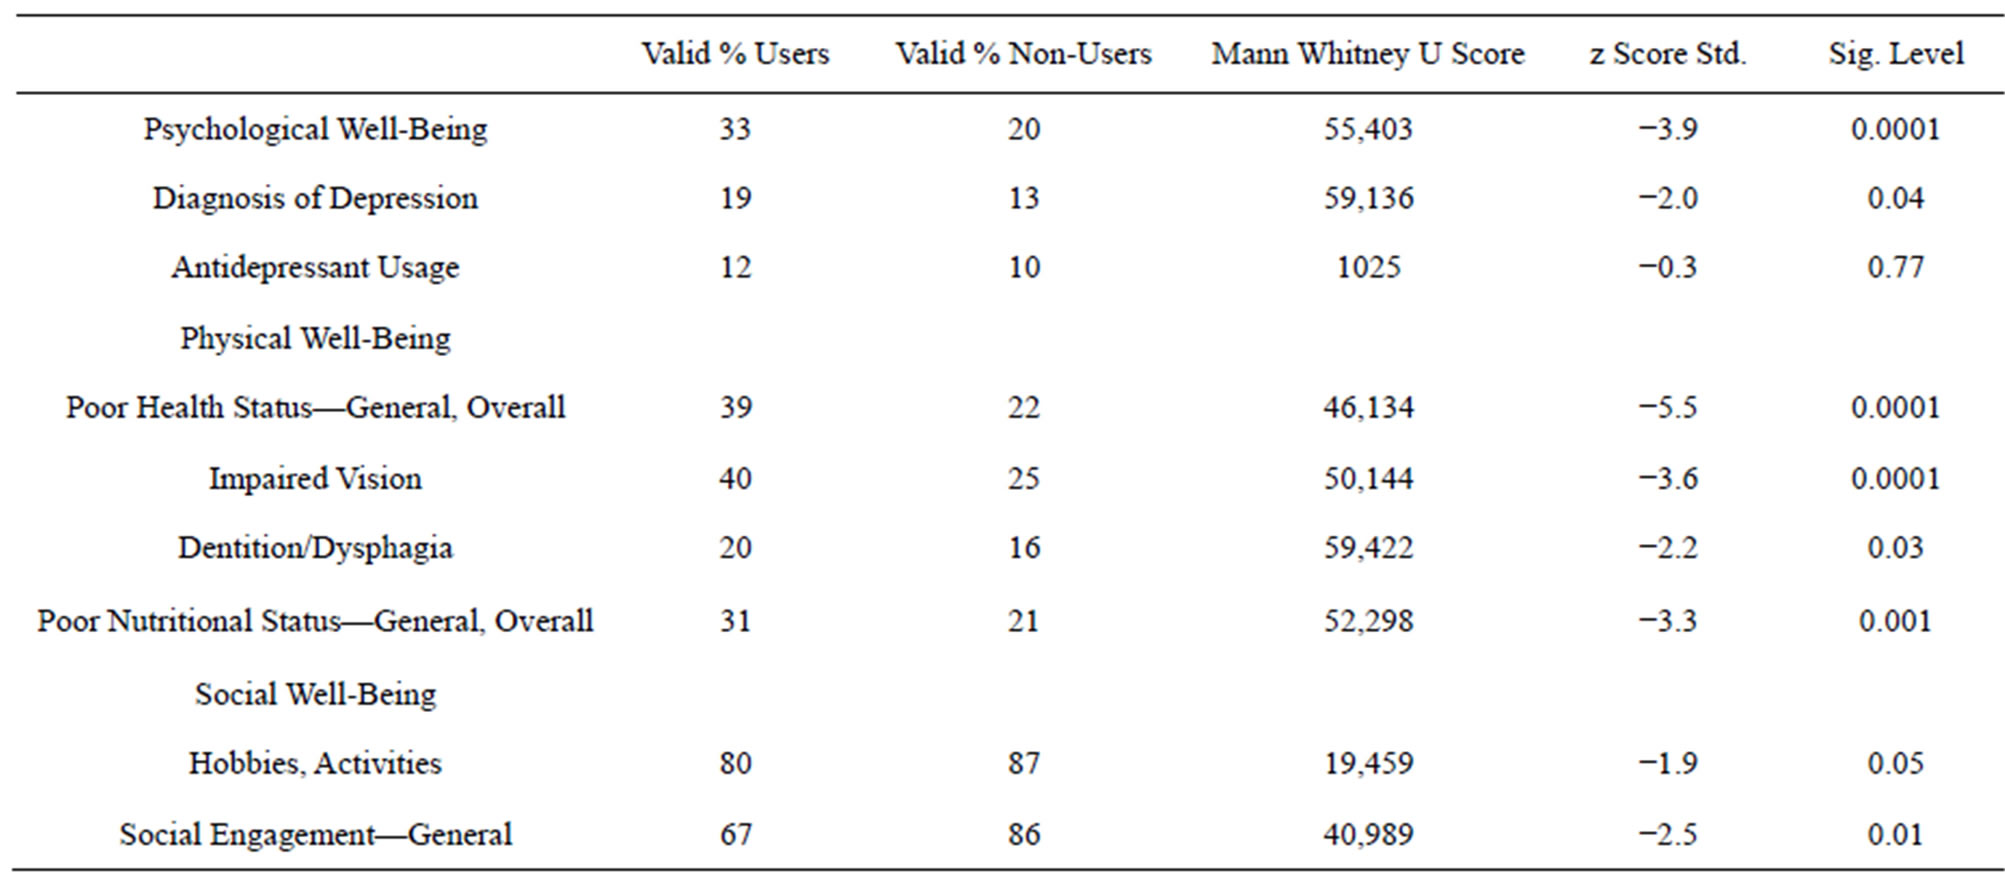
Table 5. Mann-Whitney U between service users (n = 177) and non-users (n = 888) in measures of psychological, physical and social well-being.
of intensity of the activity. Within the non-service user category, no statistically significant differences between physically active versus inactive persons with respect to general demographics were found.
4. DISCUSSION
The goal of this study was to determine whether or not older adults who utilized community services had better nutritional status, were more or less able to perform Activities of Daily Living (ADL), Instrumental Activities of Daily Living (IADLs), or PA than non-users. Based on a sizeable sample, participants fell on a continuum that ranged from none to extensive service use.
Demographics. Compared to service users, those who did not use services were younger, less impaired, and more likely to have a living spouse. As mentioned research suggests, it is assumed that many non-users had not yet developed needs for services [12]. This study found that within the non-user group, an “at risk” group was identified, a subset of older adults who were impaired and appeared to have unmet needs, and were primarily Caucasian females who were widowed and in their early seventies. They had a high school education or less and were living alone (Table 4). Others “at risk” individuals showed approximately 80% having an income <$40,000 annually for their household.
Social Factors. Krout’s findings of the contribution of center-based services to social integration may be implicit in this study’s findings in that the “at risk” groups were lonelier, more isolated and less likely to engage in social interactions [26]. The potential impact of such unmet needs on subsequent decline is enormous through their relationship to physical and psychological wellbeing in older adults. Increasingly, social indices should be used as screening tools for directing services towards older persons in need.
Screening tools may be of use in the “at risk” participants identified in this article. Depression levels were higher, memory impairment was greater, and the use of antidepressants was higher than their counterparts.
These issues impinge on quality of life, morbidity and mortality from other somatic disease states. Older persons who present for treatment of depression or memory impairment can be directed to senior services, and service professionals could implement case management that includes service provision. Results also showed that service users were less likely to engage in social activeties and reported less interpersonal interaction than nonusers with unmet needs. This suggests that service users are more apt to engage in social activities and interpersonal interaction within their selected service and may not participate in activities outside such services.
These findings, however, must be interpreted in light of the cross-sectional nature of the data and the sample homogeneity in terms of race, religion, geographic location and nonrandom selection. Further, participant’s social desirability, or inability to recall accurate information, may alter the responses. Thus, these results necessitate cautious generalization, interpretation, and application.
These findings, however, must be interpreted in light of the cross-sectional nature of the data and the sample homogeneity in terms of race, religion, geographic location, and nonrandom selection. Further, participant’s social desirability, or inability to recall accurate information, may alter the responses. Thus, these results necessitate cautious generalization, interpretation, and application.
Lifestyle Factors. Participants deemed “at risk” were at greater risk from nutritional inadequacy. These individuals ate fewer meals per day, ate in isolation, and did not obtain the benefits of meals that meet the guidelines of the government’s nutrition programming. In this study, a sub-sample of non-users was sedentary because of disability, yet others without disabilities also reported decreased PA. Further, the “at risk” respondents were more likely to be ill, sedentary, to be taking several medications, and they had more difficulties with ADLs and IADLs. Because nutritional status is inextricably tied to health status, the results indicate that nutrition and nonuse of senior services can be used as a proxy for overall physical health.
Acquisition of nutritional information is also particularly prone to biases for several reasons. Most notably, persons may be unaware of exact portion sizes, ingredients, and general classifications of foodstuffs, which are essential to the nutritional analyses of dietary information. Second, people may be forgetful when recalling intake and fluid consumption, particularly with respect to condiments, added fats and sugars, and brand or type of item. Under-reporting is also a limitation, consistently evident with “bad” food items, namely sweets, fats and fast foods. Moreover, many persons may wish to present themselves as eating “healthy” when queried by the health professional. However, attempts to actively minimize biases were made; third party verification and triangulation were used to improve the data collection. In addition, the first-to-fifth-pass-call technique, which is a technique to recall information as many as five times to ensure collection of accurate information, was used.
5. CONCLUSIONS
The increase in older adults eligible for services contrasts with the waning number of service users. Past literature, as well as this study, notes the importance of using senior services when it applies to physical health and well-being, psychological well-being, and social engagement for various age groups, marital statuses, income, and education levels. The decrease in number of service users, in this study only 16.6% of participants, may imply that increasingly older individuals are not interested or attracted to the current senior services offerings. As the population of older adults ages and their disabilities potentially increase, the need for services may increase as well. Concurrently, service programs must market services to such potential users, ultimately benefiting from the provision and use of services.
Moreover, outreach attempts may frame the services in a more positive light to make them more appealing. Revisions tailored to specific communities highlighting benefits of using senior services may encourage vulnerable older adults to participate in home and community-based services. Senior services could also be recalibrated to add emphasis on establishing suitable patterns of social engagement, proper nutritional intake, and PA earlier in adulthood. Engagement in social and PAs develops over the life course and argues for early intervention and the cultivation of preventive strategies.
Most critically, this study points to a subset of nonusers who are at a higher need for services, which should prompt an investigation into reasoning for non-participation. A more complete description of this group and their specific needs is an important direction for future research.