Big Data Study for Gluten-Free Foods in India and USA Using Online Reviews and Social Media ()
1. Introduction
Celiac disease (CD) is an inherited, autoimmune disorder in which proteins from the grains wheat, rye and barley (collectively called gluten) damage the small intestine [1] . The only treatment for CD is a strict, lifelong gluten-free diet, with a prevalence rate of about one in 100 - 133 people worldwide [2] . Celiac disease is widespread across the globe [3] . Bowman Ingredients, in 2014 in Europe forecasted that sales volume would increase up to 40% in 2015 and that UK gluten-free market would rise to £250 million by 2017 [4] . Apart from gluten-free flour, biscuits, cookies and snacks, product innovations like gluten-free beers are becoming very popular. One such example is Lasso drinks’ “Against the Grain” beer which has become quite popular [5] . Gluten-free (GF) products are consumed both by individuals with celiac disease and by health conscious people for weight management, high fiber and high protein diet and also by diabetic patients [6] . Due to reasons mentioned above the North America is the largest market for gluten-free products which accounted for a market share of 52% in 2014. The celiac disease incidence rate for Americans is one in 133. About three million Americans have celiac disease and a further estimated 40 million suffer from gluten-intolerance or sensitivity. It has been anticipated that the number of celiac patients is expected to double every 15 years [7] . It is dominated by various players, depending on their core competencies. The key players in this market are the Boulder Brands Inc., The Hain Celestial Group, Inc., Dr. Schar, General Mills, Inc., Kellogg’s Company and The Kraft Heinz Company [7] . Restaurants are redoing their menus to attract gluten-free customers, food manufacturers are creating new products, and retailers are redesigning their stores [8] . Approximately, 10% of USA restaurants offer a gluten-free menu to attract 22% of gluten-free food consumers. The number of food items on restaurants’ menus grew 9% from in 2012 to 24% in 2018 [9] . The global gluten-free market was projected to reach US$6.2 billion by 2018, with North America contributing about 59% of the share [10] .
Perceived as a “western disease”, gluten sensitivity has never really been taken seriously in developing countries like India. Due to lack of awareness it has remained highly under-diagnosed [11] . According to Ramakrishna, celiac disease is an impending epidemic [12] . As per Singh, India is an important global producer of important gluten-free sources such as sorghum, rice, corn, soybeans, millets, and pulses [13] . The gluten-free foods’ market in Asia-Pacific region including India is estimated to grow from $340.8 million in 2013 to $502.5 million by 2018, at a CAGR of 8.1% from 2013 to 2018. Gluten-free bakery & confectionery segment has acquired the largest share of the gluten-free foods market in India [14] .
Online blogs, articles and reviews have played a major role in increased sales of gluten-free foods. Thus, analysis of editorial and social media content becomes essential to understand the leading trends in gluten-free foods. Trend analysis via sentiment analysis and trend impressions provides in-depth analyses of public opinion and causes for those opinion [15] .
Sentiment analysis is a type of natural language processing for tracking the mood of the public about a particular product or topic [16] . Sentiment analysis, which is also called opinion mining, involves in building a system to collect and examine opinions about the product made in blog posts, comments, reviews or tweets [17] . Sentiment analysis can be useful in several ways. For example, in marketing it helps in judging the success of an ad campaign or new product launching, determining which versions of a product or service are popular and even identifying which demographics like or dislike particular features [18] . The difference between sentiment analysis from editorial media and social media (Facebook, Twitter, Youtube) sentiment analysis is that text is short, usually one sentence composed of at most 140 characters, in the case of Twitter [19] .
In this study, consumer preferences for gluten-free foods were analyzed on the basis of public sentiment obtained from social and editorial media data. The study provided deep insights about positive, negative and neutral sentiments related to gluten-free foods. The study also revealed that most of the consumers talked and expected product innovation in food sections like snacks, fast food (pizza, pasta and noodles) and desserts on social and editorial media. In this study, especial focus was laid to explore the top searched key words on editorial and social media related to gluten-free foods. Searches were divided into developed (e.g., U.S.A.) and developing nations (e.g., India) to get more details about the consumer preferences. This study would help manufacturers of gluten-free foods to develop food products according to the choices and preferences of consumers. The study is very unique in itself since it combines big data to the niche market of gluten-free foods to draw the valuable consumer preferences using online platforms.
2. Methodology
The editorial and social media data was crawled into excel format with help of an American data company “Perspectory Media Insights” [20] [21] . For editorial media, Perspectory Media Insights collects data from 240 million media outlets and Google Trends uses all the web and media portals connected to Google. In case of social media, Perspectory Media Insights has data contract with Facebook, Twitter, Youtube, Instagram and all Google based blogging site to provide allthe non-protected freely accessible data including comments, tweets, blog reports etc. Perspectory Media nsights uses ‘Natural Language Processing technique’ to rate the public reviews or comments on editorial and social media as “positive”, “negative” or “neutral” sentiment. Positive sentiment includes good things which consumers wrote on editorial and social media (e.g., taste of gluten-free was good or I like organic gluten-free foods). Negative sentiment included about complaints or side-effects of gluten-free foods (e.g., gluten-free food are expensive, gluten-free are not healthy). Neutral sentiment included the general information related to gluten-free foods (e.g., gluten-free cookies are available at our store; I am recently diagnosed with celiac-disease-any comments for the diet please).
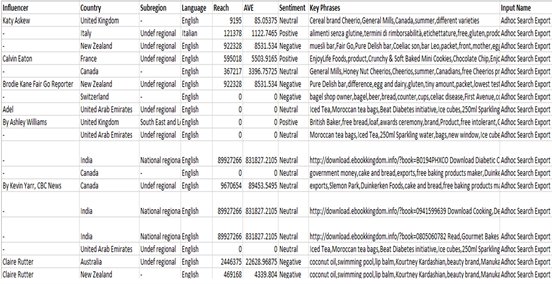
Other than Perspectory Media Insights, Google Trends [22] was used to get the list of most searched keywords and their growth percentages in developed and developing nations (see Table 1 and Table 2 for more details).
The editorial and social media data was taken for one year from 2016 to 2017 for this study.
The editorial data and social media data included the following:
- Editorial data―It included online newspapers, articles, research journals, reviews & forums. Data from websites of Celiac Society of India, Celiac Society of America, National Celiac Society of USA, Marketsand Markets report, Mintel and Nielsen database.
- Social media data―It includeddata from Facebook, Twitter, Pininterest, Youtube and Google Plus about gluten-free foods.
- Keywords used to extract the data―Gluten-free*, free from gluten*, wheat-free*, no gluten*, not gluten*, no wheat*, food for celiac*, without gluten*, gluten sensitive* + food, gluten-allergy* + food, celiac* + food, gluten-free + snack*, gluten-free + pizza*, gluten-free + pasta*, gluten-free + chocolate*, gluten-free + drink*, gluten-free + beer*, gluten-free + confectionary*, gluten-free + liquor*, gluten-free + bakery*, gluten-free + fast-food*, gluten-free + cereal*, gluten-free + cornflakes*, gluten-free + wine*, gluten-free + alcohol*, gluten-free + energy drink*, gluten-free + cookies*, gluten-free + savories*, gluten-free + juice*, gluten-free + noodle*.
All these keywords were searched independently for both editorial and social media one by one to prepare the consolidated reported.
Research tool: Perceptual mapping was used as research tool to study the trends of editorial media. Perceptual map was prepared based on weighted score of sentiment, number of articles and percentage share of articles. All the articles of editorial media were read thoroughly and their sentiment was decided based on text mining for each food category. Food categories taken into consideration were flour & mixes, fast food (including pizza & pasta), bakery, cereals & cornflakes, snacks, soft & energy drinks, liquor, confectionary and last category was desserts. Then, positive, negative and neutral sentiments for all articles were compiled into a total number for each food category. Total number of articles
![]()
![]()
Table 1. Top searched keywords on editorial and social media in developing countries e.g., India and their growth % in 2016-17 compared to 2015-16.
Source: Google trends, 2018.
for each category of sentiment were multiplied with their score allotted. Positive sentiment as given a score of 1.5, neutral sentiment was given a score of 1 and negative sentiment was given a score of 0.5. Dimensions used to prepare perceptual map was number of articles for each category and weighted score of each category based on sentiment analysis [15] . Formula used to prepare perceptual map is given below:
(1)
(2)
3. Results and Discussion
3.1. Global Sentiment Analysis for Gluten-Free Foods
1) Sentiment analysis via editorial media
Big data has been coined as a term denoting large or complex data sets. Big data analytics has been considered as the process of examining large data sets to unveil hidden patterns, unknown correlations, market trends, customer preferences and other useful business information. The goal of big data analytics is to make business decisions more accurate and prompt by enabling data scientists, predictive modelers and other analytics professionals to analyze large volumes of transaction data and to draw out meaningful results [23] .
Sentiment analysis included the techniques to understand the attitude and mood of a speaker or a writer with respect to some topic or the overall contextual polarity of a document by determining the polarity of a given text as positive, negative, or neutral or as “angry”, “sad”, and “happy” [23] [24] .
Figure 1 shows sentiment analysis via editorial media (also see Appendix Figure 1 to see examples of editorial media). Keywords which fell in category of each sentiment are discussed below:
![]()
![]()
Table 2. Top searched keywords on editorial and social media in developing countries e.g., USA along with the growth % in 2016-17 compared to 2015-16.
Source: Google trends, 2018
![]()
Figure 1. Global sentiment analysis via editorial media―2016-17. Source: Editorial media data obtained from Perspectory Media Insights.
Positive (53%)―Leading trends talked about these topics in relation to gluten free foods―organic food, marshmallows, reduce weight, oatmeal, Cheerios, Arrowroot, Peanut butter cookie, King Arthur floor, Panera bread, cider, doughnut, almond meal, quinoa, Dunkin Donuts, high energy level, improves skin and overall health, getting slim, Amaranth.
Neutral (43%)―Leading trends were cookies, allergy, beer, bakery, bread, bun, recipes, cracker, ginger bread, pop-corn, Zucchini fritters, Oatmeal, pan cake, banana bread, pizza.
Negative (4%)―Leading trends were Fad, diabetes, lack of dietary fiber, essential nutrients, French fries, candies, high carbohydrates, irritable bowel syndrome, reduce Bifidobacterium and Lactobacillus, food labels, high cost [20] [21] .
2) Sentiment analysis via social media
Figure 2 shows sentiment analysis via social media. Following trends were discovered in each category of sentiment analysis (also see Appendix Figure 2 to see examples of social media). Keywords which fell in category of each sentiment are discussed below:
![]()
Figure 2. Global sentiment analysis via social media―2016-17. Source: Social media data obtained from Perspectory Media Insights
Positive (32%)―Rice Krispies, gluten-free bakeries, dark chocolates, gluten-free oats, gluten-free travel and restaurants, gluten-free menu, fish & chips, choco chip cookies, gluten-free flour mixes, nut milk, coconut milk and gluten-free beer, McDonalds gluten-free menu.
Neutral (51%)―Dairy-Free & Vegan Options, Protein Bar, noodle soup, Tortilla Chips, beef and chips, pop-corn, Indian grains, ragi, millets, white rice, jowar, soy and rice flour, gluten-free cornflakes, pizza crust, bread, desserts, baking crust, cake, pan cake cookie.
Negative (17%)―Obesity, high sugar, high carbohydrate, taste, availability on nearby store, wheat contamination, lack of proteins and micro-nutrients, dough binding ability, expensive, skin rash, lactose intolerance and diabetes [20] [21] .
Figure 3 shows social analysis by channel. Mainly five channels were used to extract the data from social media namely Twitter, Facebook, Instagram, Blogs and Youtube.
Twitter (49.10% responses) was favorite platform been used the public to put their opinions about gluten-free foods. Many micro blogs were also written by dieticians, nutritionists and food experts, where news recipes of gluten-free foods were discussed along with healthy gluten-free options.
Facebook (23.16% responses) was also popular platform. Many groups and health websites had been formed on Facebook by users of gluten-free foods e.g. Gluten Free, Free From Gluten, Gluten Dude, NYC Celiac Disease and Gluten-Free Meetup, Gluten-free Mama, Celiac group of Mumbai India, Gluten Free, Free From Gluten, Gluten Dude, NYC Celiac Disease and Gluten-Free Meetup, Gluten-free Mama, Celiac group of Mumbai India etc.
Instagram (14.52% responses) has gained high popularity in last few years. Few famous Instagram pages were #glutenfree, gluten.free.me, udisglutenfree, gluten_freeeats, Australian Gluten-Free Life. People posted pictures and share recipes of gluten-free foods.
![]()
Figure 3. Social media analysis by channel across the globe―2016-17.
Blogs (12.22% responses) contributed a lot to create awareness about gluten-free foods. Many blog writers discussed benefits and harms of consuming gluten-free diet. Emphasis was also given to new recipes which were good in taste and high in nutrition.
Youtube (1% response) had lowest response rate. However, few famous Youtube videos on gluten-free foods were What Gluten-Free Really Means, 30 Days Of A Gluten-Free Diet, How to Go Gluten-Free, Gluten Free Foods List, Gluten-Free vs. Gluten Taste Test and Top 10 Gluten Free Dishes [20] [21] .
3.2. Top Searched Keywords on Google for Gluten-Free Foods
Table 1 shows that in India, Gluten free flour, Chocolate brownie, Tapioca, Snack and Rolled oats were top five most searched keywords in 2016-17 as gluten-free foods in India are at a niche stage and most of the people look for basic eatables like flour and snacks (also see Appendix Figure 3 to see word cloud of most popular keywords related to gluten-free foods in India). Chocolate chip cookie, Peanut butter and Amaranth grain achieved growth rate of 200% or higher and are expected to grow further due to increased public consumption. Chocolate, South Indian Dishes, Gluten free grains, Cookie, Multigrain flour, Dairy, Organic food, Sugar-free, Affordable food, Biscuits, Flaxseed, Noodles, Namkeen, Rice, Lactose free food, Indian cuisine, Maize, Pasta and Bread registered growth rate above 100% and were kind of stable trends and were in demand round the year [22] .
Few leading brands in India offering gluten-free food were Dr.Schar, Dr. Gluten, Zero G, Kalpana foods, Savorlife, Bewell, Wheafree etc.
Table 2 shows that in USA, Christmas cookies, Chips & krispies, Girl Scout Cookies, organic foods and Chicken wings were top five most searched keywords due to their high demand in Christmas New Year week in 2016-17 and they witnessed highest growth rates as compared to year 2015-16 (also see Appendix Figure 4 to see word cloud of most popular keywords related to gluten-free foods in USA). Lentils, Sugar cookie, Taco bell, Gluten-free beer, Oatmeal, Sourdough bread, Corn tortilla and Cheerios achieved growth rate of 200% or higher and were expected to grow further due to increased food consumption. Hot chocolate, Carbohydrate, Organic foods, Meatballs, Dominos, Quinoa, Whole grain, Pasta, Pancakes, Wrap, Cornmeal, Cupcakes, Pizza crust, Donuts, Cookies, Banana bread, Cinnamon roll and Snacks registered growth rate above 100% and were kind of stable trends and were in demand round the year [22] .
Few leading brands in USA offering gluten-free foods were Dr.Schar, Udi’s, Pamela’s, Glutino, Marry gone, Wholefoods, Trader Joe’s, Amy’s, Blue Diamond, Cheerios etc.
3.3. Exploring Consumer Preferences for Gluten-Free Foods Using Perceptual Map
Figure 4 and Table 3 show a global perceptual map for different food categories of gluten-free foods based on the data of editorial media. From the map it was clear that snacks was the leading food section across the world with 17% share of articles. Many new products were launched with different ingredients and better taste. Few popular snacks were Blue Diamond Pecan Nut-Thins (made of rice flour and pecans), Barbeque Popchips (potato chips), Mary’s Gone Crackers (brown rice, quinoa, flax seeds, and sesame seeds), Food Should Taste Good Multigrain Tortilla Chips (corn chips), Schar Pretzels, Baked Cheese Crunchies and Organic Stone Ground Blue Corn Chips by Trader Joe’s. People were buying different types of multigrain and whole grain snacks with special herbs. Pizza, pasta and fast food with 13% share of articles was second leading category. Famous brands were Amy’s, Udi’s, Dominos, Schar and local pizza and pasta cafes with their specialties. Frozen pizzas, pizza crust and pizza base of different type were also in high demand. In pasta and noodles, Thasia, NutraHi and Schar were few popular brands. In confectionery and desserts with 13% share of articles and weighted score of 46714 and 44085 respectively, local bakers were more popular as they provided fresh products at affordable prices instead of packed ones. Most of the editorial articles discussed about local recipes as they were more liked by consumers. Liquor and Bakery had 12% share of articles. Bakery section was led by local bakeries but bakery products by Wholefoods, Trader Joe’s, Schar, Pamela’s and Udi’s were also quite famous. Ginger bread, banana bread, cinnamon bread were also getting popular. In liquor section few famous beers were Buck Wild Pale Ale, Redbridge Lager, Dragon’s Gold (Fruit Beer), American Pale Ale, India Pale Ale, Mikkeller Cream Ale, Brasseurs Sans Gluten Glutenberg Blanche and Lasso Gluten-free beer. Flour & mixes (10% share of articles) were stable in nature as most of users of gluten-free foods bought them most of the times. Multigrain and wholegrain flours and mixes were in high demand. Flour mixes prepared from brown rice, quinoa, sorghum, amaranth, almond etc were preferred over plain corn or rice flour. King Arthur,
![]()
Figure 4. Perceptual map of gluten-free food across the globe for year 2016-17.
Bob red mill, Nature pro, Dr.Gluten, Dr. Schar and Glutino were few famous brands. Soft drinks and energy drinks (6% share of articles) were most of the time naturally gluten-free. Fresh juices or juices with fruit pulp were preferred by users. Cereals and flakes (5% share of articles) had very narrow product brand. Post coco pebbles, gluten-free flakes by Kellogg’s and Nestle, Cheerios Oatmeal were few popular brands [15] [23] [24] (also see Appendix Figure 5 and Appendix Figure 6 for more details).
4. Conclusion
Big data analysis revealed that maximum online searched about gluten-free foods on editorial and social media were made in developed nations like USA, which had high availability and huge variety of gluten-free foods. Gluten-free
![]()
Table 3. Score obtained from perceptual map of gluten-free food across the globe for year 2016-17.
Source: Author’s own compilation from editorial media data obtained from Perspectory Media Insights data crawlers.
foods in developing nations like India were at a very niche stage, and users here searched for very basic food options like gluten-free flour, biscuits, snacks and noodles. It was observed that data volume of social media was very high compared to editorial media as people posted many things of social media especially on Twitter about gluten-free diet. However, in editorial media only journalists, blog writers and researches publish their findings and opinions about gluten-free food. The study also revealed that most of the consumers talked and expected product innovation in food sections like snacks, fast food (pizza, pasta and noodles) and desserts on social and editorial media. This study would provide direction to manufacturers of gluten-free foods to develop food products according to the choices and preferences of consumers based on ideas and reviews obtained from social and editorial media. The study is very unique in itself since it combines big data to the niche market of gluten-free foods to draw the valuable consumer preferences using online platforms.
Acknowledgements
I would like to thank Professors at SKRAU, Bikaner India, namely, Dr. Amita Sharma, Dr. Madhu Sharma, Dr. Rajesh Sharma, Dr. MadhuGoel and Dr. AditiMathur for guiding me in this research. Special thanks to Dr. Jonathan Deutsch (Prof. Culinary Arts and Food Science, Drexel University, USA) and Mr. Ashish Sharma (Innovator and leader of Big data practices, USA), for their constant guidance and support throughout the research. My deep thanks to Mr. AdarshTiwari (who was in team of Perspectory Media Insights) for his support in the data extraction process of the research.
Limitations of the Study
The world of social media and editorial is very big and immense. Perspectory Media Insights collects data from 240 million media outlets and Google Trends uses all the web and media portals connected to Google. However still there are chances that a lot of media portals remain touched in this research due to difficultly in accessing them. Thus, the data about editorial and social media on gluten-free foods is mere representation of big data obtained from Perspectory Media Insights and does not claim the data from whole web universe.
Appendix
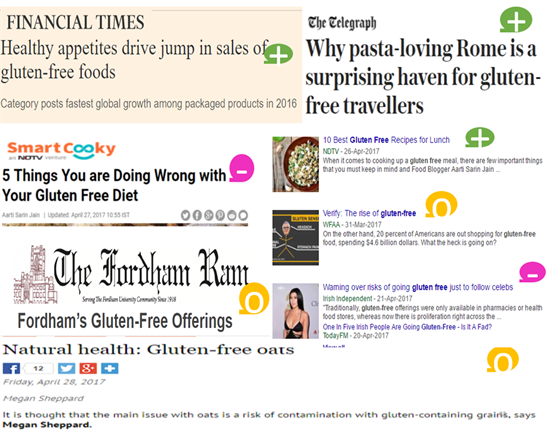
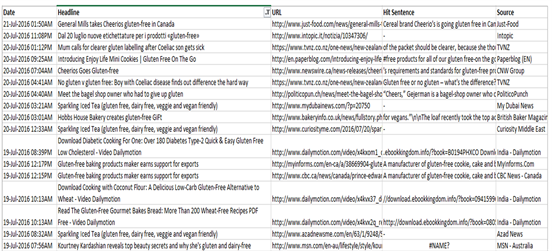
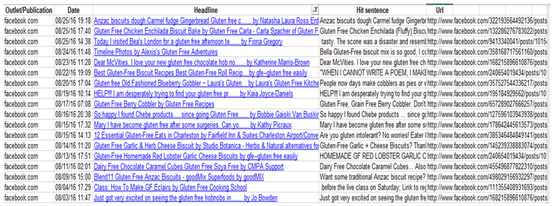
Appendix Figure 1. Examples for sentiments analysis of editorial media. In the about figure various examples and their related sentiments have been shown from editorial media. Green circle has been used for positive sentiment, pink circle for negative and brown circle for neutral sentiment.
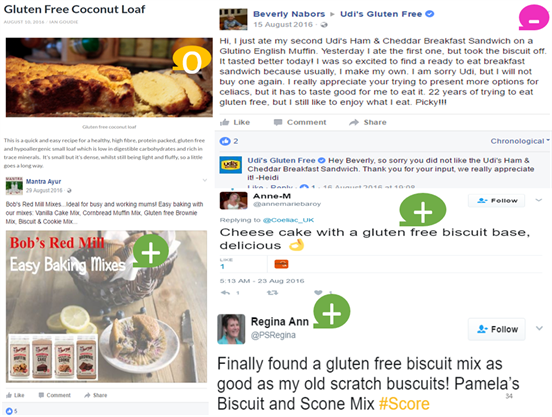
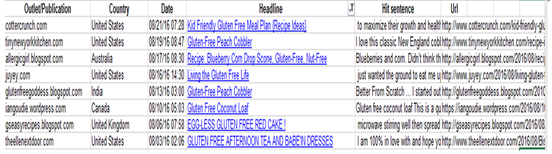
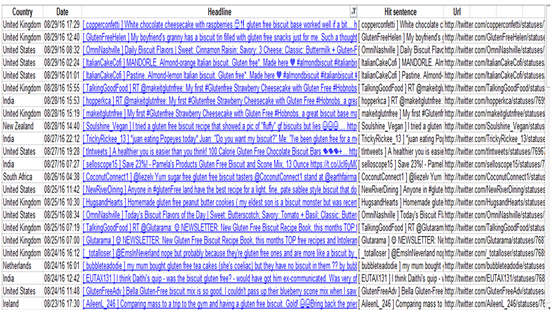
Appendix Figure 2. Examples for sentiments analysis of social media. In the about figure various examples and their related sentiments have been shown from editorial media. Green circle has been used for positive sentiment, pink circle for negative and brown circle for neutral sentiment.
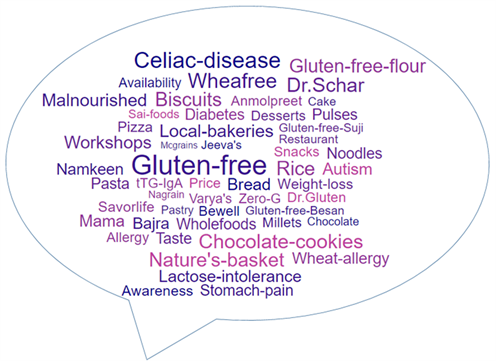
Appendix Figure 3. Word cloud for gluten-free foods in India. Word cloud for gluten-free foods in India. Word cloud provides a glimpse of most common keywords been associated with gluten-free food in India. Bigger size words indicate higher popularity of a particular keyword compared to other keywords. In India rice, celiac disease, Wheafree, Dr. Schar, gluten-free flour and chocolate cookies are most commonly used keywords, in context of gluten-free foods.
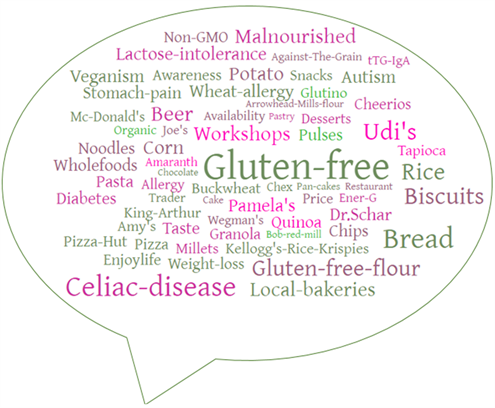
Appendix Figure 4. Word cloud for gluten-free foods in USA. Word cloud of USA is densely populated, since it has many popular keywords associated with gluten-free foods. Most popular keywords are Udi’s, bread, flour, celiac disease, veganism, autism, lactose-intolerance, biscuits, Pamela’s, rice, quinoa, malnourished and local bakeries.
(a)
(b)
Appendix Figure 5. Sample for editorial media data sets. Source: Perspectory Media Insights, 2016-17.
(a)
(b)
(c)
Appendix Figure 6. Sample for social media data sets. (a) Facebook sample; (b) Facebook sample; (c) Twitter sample. Source: Perspectory Media Insights, 2016-17.