Studies on Physical, Chemical and Bacteriological Characteristics on Quality of Spring Water in Hajigak Iron Ore Mine, Bamyan Province, Central Afghanistan ()
1. Introduction
Water is needed not only to process mineral resources in Afghanistan, but also to supply existing communities and the associated community growth that may accompany a developing mining economy [1] . Water is an invaluable resource to living things, and essential for the sustenance of life on earth [2] . According to the World Health Organisation (WHO) more than 3.4 million people die each year from waterborne disease, most of whom are young children. In addition, it is estimated that around 50% of the population in developing countries is suffering from a water-related disease at one time [3] . Thus purity and cleanliness of water is very important for better quality of drinking water. Water quality is determined by physical, chemical and microbiological properties. These water quality characteristics throughout the world are characterized by wide variability. Therefore the quality of natural water sources used for different purposes should be established in terms of the specific water-quality parameters that affect the possible use of water. The quality of drinking water is a powerful environmental determinant of health [4] . Millions of people in developed countries do not have access to adequate and safe water supply. Increasing population and urbanization make it difficult for governments around the world to meet the increasing demand for portable drinking water. Without safe water near dwellings, the health and livelihood of families can be severely affected [5] [6] . Natural processes and human activities are the main factors to contaminate and pollute the water sources overtime that lead to decrease of potable water. The quality of surface water and ground water is a function of both natural and human influences. Major water contaminants include agrochemical and municipal wastes, tailings and waste water from mines, oil field and industry, brine pits, leaking underground storage tanks and pipeline, sewage sludge and septic systems [7] . The continued consumption of toxic and contaminated water in a short period or over long term may cause serious health problems to the inhabitant of the area.
As studies on hydrogeology of ground water have been done in different parts of Hajigak iron ore mine, no comprehensive study has been completed on the water quality of this area for drinking purposes. In this study, the quality of water in Hajigak Iron Ore Mine is evaluated using lab analysis, experiments, and suggestion based on lab result, site visits and inhabitant interviews. The lab analysis involves physical parameters such as temperature, EC, TDS, chemical parameters such as pH, DO, total hardness and bacteriological parameters of spring/surface water.
The Hajigak iron ore mine is situated in the mountainous province of Bamyan with area covering 35 km2 west of the capital Kabul with altitude more than 3700 meters above sea-level. Peters (2007) stated that Hajigak deposit, 2100 Mt, is of world-class size [8] . These deposits are discovered in 1911 by Hyden from Indian Geological Survey [9] . Previous Russian estimates are 1700 million metric tons (Mt), although the mining reserve estimate for the near-surface oxide ore in most explored area is 85 Mt (Momji and Chaikin, 1960) [10] ; Mirzad, 1961 [11] ; Kusov, 1963 [12] ; Kusov and others, 1965a, b [13] ; Bouladon and de Lapparent 1975 [14] ; Abdullah and others, 1977 [15] ). Land scan mapping reported that the population of this area is less and the inhabitants are as maximum as 50 persons per square Km. However most populations stays in wider flat valleys that may constitute big villages that would be more than 500 persons per km2 [1] .
The geohydrology of the Hajigak mine is recognized by Peters and others [1] . Abdullah and Chmyriov [15] defined that the Haji-Gak area as hydrogeological folded region that occupies the central part of Afghanistan with a predominant mountain climate. The developed geohydrologic units ranked from high to low relative hydraulic conductivity are conglomerate, limestones and dolostones, metamorphic rocks, and intrusive rocks with lavas. The elevations of some of mountains in the area reported altitude than 4000 meters above sea level that receives considerable precipitation, especially during the winter months as snowfall. The runoff from the snowmelt in the spring and summer provides surface-water flow in the perennial and ephemeral streams [16] .
Water quality refers to the chemical, physical, biological, and radiological characteristics of water [17] . Johnson and others (1997) defined water quality as a measure of the condition of water relative to the requirements of one or more biotic species and/or to any human need or purpose [18] . The water quality is affected by agricultural, municipal, mining and industrial activities.
1.1. Physical Characteristics
Physical characteristics of water including temperature, electrical conductivity, color, turbidity, salinity, taste, odor and total dissolved solids that are determined by the help of new modern technological equipments with very accuracy analysis done in situ and in water lab. According to Freeze (1979) electrical conductivity is the ability of a substance to conduct an electrical current [19] . Hem (1970) stated that pure liquid water has a very low electrical conductance, less than a tenth of a micro Siemens at 25˚C [20] .
1.2. Chemical Characteristic
Chemical characteristics of water involve pH, dissolved oxygen (DO), total hardness, heavy metals and surfactants. The chemical characteristics of natural water are a reflection of the soils and rocks with which the water has been in contact. Microbial and chemical transformations affect the chemical characteristics of water. The pH measures the concentration of hydrogen ions (H+) in the water. Because values of pH are based on a logarithmic scale, each 1.0 change in pH represents a factor of ten changes in acidity. This means that a pH of 3.0 is 10 times more acidic than a pH of 4.0 [21] . USGS defined that water hardness is the amount of dissolved calcium and magnesium in the water. Hardness is a property of water that is not a health concern, but it can be a nuisance [22] .
1.3. Bacteriological Characteristic
The use of bacteria as indicators of the sanitary quality of water probably dates back to 1880 when Von Fritsch described Klebsiella pneumoniae and K. rhinoscleromatis as micro-organisms present in human feces [23] . Percy and Grace Frankland started the first routine bacteriological examination of water in London in 1885 [24] . The most basic test for bacterial contamination of a water supply is the test for total coli form bacteria. Total coli form counts give a general indication of the sanitary condition of a water supply [25] . Unfortunately general indications of total coli form do not overtly in water. Whereas water sources may be contaminated seriously especially spring/surface water because it follows in open environments and attached with polluted soil, vegetation, feces of human and animals. There are three groups of coli form bacteria. Each is an indicator of drinking water quality and each has a different level of risk. Total coli form is a large collection of different kinds of bacteria. Fecal coli form is types of total coli form that exist in feces. E. coli is a subgroup of fecal coli form [26] (Figure 1).
Total coli forms bacteria can be exist in the soil and water that is polluted by surface water and in human or animal waste.
Fecal coli forms bacteria are a kind of total coli forms, which can be found in the gut and feces of warm-blooded animals and humans. Because the origins of fecal coli forms are more specific than the origins of the more general total coli form group of bacteria, fecal coli forms are considered a more accurate indication of animal or human waste than the total coli forms.
Escherichia coli bacteria (E. coli) are a major species of fecal coli form. The five general groups of bacteria that comprise the total coli forms, only E. coli is generally not found growing and reproducing in the environment. Consequently, E. coli is considered to be the species of coli form bacteria that are the best indicator of fecal pollution and the possible presence of pathogens [24] .
1.4. Cause of Water Contamination
In fact, water quality is a complex subject, in part because water is a complex medium intrinsically tied to the ecology of the Earth. Industrial and commercial activities such as manufacturing, mining activities, construction, transport are a major cause of water pollution. This includes runoff from agricultural areas, urban runoff and discharge of treated and untreated sewage, domestic water waste, municipal waste, animal waste, industrial waste, natural process of earth such earthquake, flood, cyclone etc. According to Widyanto (1975) about 80% of water pollution in any developing country is caused by domestic wastes [27] .
1.5. Role of Industrial Activities on Water Pollution
Industrial waste disposal has become a significance source of water pollution whether in surface water and ground water. The effluent discharge from industries like textile mills, distilleries, fertilizers factories, sugar factories, tanneries and metal processing industries on surface lands and agricultural lands without following the norms of effluent wastes is causing serious surface water pollution and ground water pollution [28] . The waste releases from industries contain hazardous substances such arsenic, cadmium, mercury, cyanide, fluoride and chloride in toxic concentration, which completely changes the quality of water. These water uses are very dangerous for drinking, cooking, brushing, bathing and irrigation purposes.
2. Study Area
The study area is western part of Hajigak iron ore mine, whereas this iron ore mine is the best known and largest iron oxide deposit in Afghanistan, located in Hajigak Pass of Bamyan province. It has the biggest untapped iron ore deposits of Asia [29] . The study area is enclosed between latitudes (34˚30' - 35˚00'N) and Longitudes (68˚00' - 68˚45'E) [1] (Figure 2).
3. Materials and Methods
3.1. Sampling
Sampling of waters of spring in the study area was carried out manually. Samples were collected at 6 stations covering the entire Hajigak Prospect subareas. At each station, one sample has been collected in new clean 1500 ml sterile bottles (Photo 1). A total of 6 surface/spring water samples were collected. The sample volume, about 1.5 Liters of water, was collected from each sampling sites and stored in a cool container. The sample locations were identified and recorded with the help of GPS (Figure 3).
3.2. Method and Results
3.2.1. Physical Analysis
Temperature reading of water samples measured by WTW pH meter of model pH 3310 SET 2 on the mine site. The electrical conductivity (EC) measurement
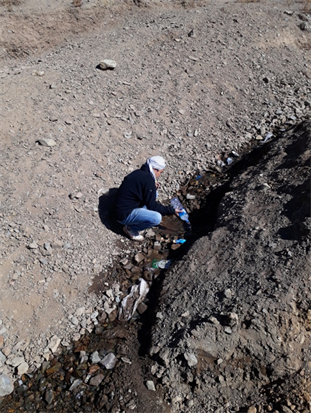
Photo 1. Collection of water Sample in Pay Kottal. area of Hajigak iron ore mine.
![]()
Figure 3. Geomorphologic and topographical map of study area.
of water samples have done in water lab through conductivity meter. The model of conductivity meter was Cond 3310 SET 1. The total dissolved solid (TDS) readings of samples were determined by WTW dissolved oxygen meter model-Oxi 3310 SET 1. Color of water samples determined in lab by HACH TEST KIT color model-CO-1, 0-100, 0-500. The turbidity of water samples determined in laboratory by turbidity meter model-WA-PT-4 and for more accuracy the turbidity of water samples analysis in HACH turbidity meter.
According the lab analysis of samples, there is description of individual physical properties of water samples in six stations of spring water in Pai Kottal of Hajigak iron ore mine. It is observed that values of temperature in spring water for throughout of area limited from (11˚C - 16˚C) (Table 1) with 13.7˚C average value of temperature. It suggests that this water temperature is a good for inhabitants consumers and based on water quality, high temperature negatively
![]()
Table 1. Physical characteristic of water samples obtained from Hajigak iron ore mine.
impact water quality by enhancing the growth of micro-organisms which may increase taste, odor, color and corrosion problems [30] . Decrease of water temperature lead to increase the solubility of some gases such N2, CO2, O2 that make better the quality and taste of water.
Conductivity values of the water samples shown in (Table 1). Although water itself is not an electrolyte, it does have a very small conductivity, implying that at least some ions are present. The units of conductivity are Siemens per cm (S/cm) [31] . Electrical conductivity gives an indication of the amount of total dissolved substitution in water [32] . EC Values recorded ranged from 272 till 424 μS・cm−1 (Table 1). The average of EC in water samples for throughout of interested area recorded 340 μS・cm−1. This indicates there is very strong dissolution of solute in samples water. In industrial and domestic uses when the conductivity gets too high, indicating a potentially harmful accumulation of solids, a quantity of water is drained out of the system and replaced with water having lower conductivity.
The TDS values of water sample shown in Table 1, ranged between 130.2 (mg/l) and 431 (mg/l) that all the water samples analysis values very below based on WHO recommended guideline value of 1000 mg・L−1. Whenever the water TDS were below 1000 mg/lit, it indicates to be fresh water and suitable for irrigation and drinking purposes.
The salt content of the water can be measured very precisely using the conductivity method [21] . The salinity of water samples are at range of 0.0 - 0.20 (Table 1), indicating that the salinity of water in area of interest is very low and good quality for drinking purpose.
Color in drinking water can be caused by dissolved and suspended materials, an example of dissolved substances is tannin, which is caused by organic matter coming from leaves, roots, and plant remains. Suspended material in water bodies may be a result of natural causes and/or human activity. Transparent water with a low accumulation of dissolved materials appears blue. Dissolved organic matter, such as humus, peat or decaying plant matter, can produce a yellow or brown color. Some algae or dinoflagellates produce reddish or deep yellow waters. Water rich in phytoplankton and other algae usually appears green. Soil runoff produces a variety of yellow, red, brown and gray colors [33] . The color values of water sample analysis ranged from 3 - 10 (Table 1) and the average is 6, whereas it is below based on WHO guideline 2011 and Standard values for Afghanistan. A bit of color in water may not make it harmful to drink. Highly colored water has significant effects on aquatic plants and algal growth [33] .
Turbidity is caused by particles suspended or dissolved in water that scatter light make the water appear cloudy or murky. Particulate matter may include sediment especially clay and silt, fine organic and inorganic matter, soluble colored organic compounds, algae, and other microscopic organisms [34] . The turbidity of water samples reported at range of 0.5 - 10 (Table 1) and the areas which turbidity is five or below of five is good, but the station No-3 (water sample of HM3, HM3‘ ) turbidity values are 7.48 and 10 it means their turbidity is high based on WHO guideline 2011 and Standard values for Afghanistan. High turbidity can significantly reduce the aesthetic quality of lakes and streams, having a harmful impact on recreation and tourism. It can increase the cost of water treatment for drinking and food processing [34] .
3.2.2. Chemical Analysis
The chemical parameters were carried out in lab through titration standard methods and HACH spectrophotometer model DR-3900 by using specific reagents whereas these reagents are very costly and inaccessible. The chemical composition of water sample is carried out by spectrophotometer which is working by specific reagents as follows:
Fluoride (F), Sulphate (SO4), Phospate (PO3), Potassium (K), Nitrite (NO2), Nitrate (NO3), Ammuonia (NH3), Iron (Fe), Manganese (Mn), Copper (Cu), Aluminium (Al), Arsenic (As), Cyanide (Cy).
The pH of water samples is measured by WTW pH meter of model pH 3310 SET 2 at the mine site. Dissolved Oxygen (DO) of samples is determined by WTW dissolved oxygen meter model-Oxi 3310 SET 1. Details on some chemical analysis procedure such as Ca2, Mg2, Cl, Phenolphthalein Alkalinity (PA), Total Alkalinity (TA), Hydroxide (OH), Carbonate (CO3) and Bicarbonate (HCO3) are presented in Appendix.
The pH values of water samples analysis shows range of 7.17 - 8.24 (Table 2). According the WHO guideline 2011, Standard values for Afghanistan and
![]()
Table 2. Chemical characteristic of water samples obtained from Hajigak iron ore mine.
National Standard of most Asian countries limitation is (6.5 - 8.5). Potential of hydrogen in water samples show an average of 7.95 for whole study area. The World Health Organization [4] recommends a pH value of 6.5 or higher for drinking water to prevent corrosion. Thus the pH above 8.0 would be disadvantageous in the treatment and disinfection of drinking water with chlorine [30] . However, pH values between 6.5 and 8.5 usually indicate good water quality and this range is typical of most drainage basins of the world [35] .
Water is a great solvent for calcium and magnesium [36] . The total hardness values of water samples ranged between 140 mg/l and 170 mg/l, the average total hardness is 150 mg/l (Table 2). The sample No-HM1, HM3′ , HM3 and HM3′ are moderately hard but the sample No-HM2 and HM4 are very hard. Hardness does not pose a health risk [36] .
Dissolved oxygen is one of the best indicators of water quality. The amount of dissolved oxygen that the water can hold depends on the temperature and salinity of the water. Cold water can hold more dissolved oxygen than warm water and fresh water can hold more dissolved oxygen than salt water [21] . The DO value of water samples is shown in (Table 2). The values of water samples are sufficient for drinking purposes.
The values of calcium ranged from 20 mg・l−1 to 60.12 mg・l−1, where the standard limit is up to 75 mg・l−1, showing sufficient calcium in water samples (Table 4). The values of Magnesium and Chloride also show sufficient amount in water samples (Table 4), whereas the local standard and WHO limit is up to 100 and 25 mg・l−1 respectively. The analysis shown that Phenolphthalein Alkalinity is zero (P) = 0 means the volume of acid used till the completion of reaction is zero (Table 4). This can only happen when both OH− and
ions are not present in water (Table 3). Alkalinity is present due to HCO3 ion only which can be determined using methyl orange indicator, methyl orange alkalinity (M).
The values of total alkalinity in water sample are from 150 - 225 mg・l−1 (Table 4). According on (Table 3) the bicarbonates values directly change to total alkalinity (TA) values. The sodium and total iron analysis shows rather good quality of water in study area (Table 5). The analysis of OH, CO2, and HCO3 shows, normal amount (Table 5). Existence of Fluoride (F), Sulphate (SO4), Phospate (PO3), Potassium (K), Nitrite (NO2), Nitrate (NO3), Ammuonia (NH3), Iron (Fe), Manganese (Mn), Copper (Cu), Aluminium (Al), Arsenic (As), Cyanide (Cy) with normal and limited amount (Table 6) indicates that the spring/surface
![]()
Table 3. Values of Hydroxyl ions, Carbonates and Bicarbonates from the values of phenolphthalein and total alkalinities.
![]()
Table 4. Chemical characteristic of water samples obtained from Hajigak iron ore mine.
![]()
Table 5. Chemical characteristic of water samples obtained from Hajigak iron ore mine (OH, CO3, HCO3, Na and Fe).
![]()
Table 6. Chemical characteristic of water sample No HM3.
water in this area of mine is fresh and non toxic for drinking purpose of inhabitants. Results reveal that the spring water of study area is free of toxic substances, toxic agents and harmful chemicals, that indicates the area has very fresh and good quality of water according to world health organization 2011 guideline values, National standard of most Asian countries (NSMAC) and standard values for Afghanistan (SVFA).
3.2.3. Bacteriological Analysis
One of the biggest concerns related to water contamination is bacteria. New developments in UV-VIS spectroscopy utilize the measurement of light absorption to quantify bacterial concentration levels in water samples accurately. This process is immediate, portable, and cost-effective, making a leading choice in analytical instrumentation for water analysis. The water samples immediately transferred to lab for bacterial analysis. This analyze done by HACH spectrophotometer model DR. 5200, that taken three days for accurate result. For analyzing needs 100 ml water sample of each sterile bottle is collected. Water samples analysis for T. coli form have taken three days based on accuracy and equipments requirement in water lab. Whenever the T. coli form bacteria showed existence in water samples, analysis should be done on water samples for fecal coli form and E. coli.
According the bacteriological analysis in water samples, the values of total coli form bacteria is at ranged of 11 - 27 MPN/100ml (Table 7). This concentration indicates that spring water of the area is non portable water and not recommended for drinking purpose. Whereas these numbers may varies during the seasons of year and inhabitant activities. In the four stations, the detected the E. coli and fecal coli form bacteria in 100 ml of water samples which base on WHO guideline, NSMAC and SVFA must not be detectable in any 100 ml water sample (Table 7). In two stations, the E. coli and fecal coli form bacteria are not detected in 100 ml water samples (Table 7) whereas the total coli form is lower at a ranged of 11 and 12 MPN/100ml.
![]()
Table 7. Bacteriological characteristic of water samples in Hajigak iron ore mine.
4. Discussion
It is observed that values of temperature in spring water throughout the area are limited from (11˚C - 16˚C) (Table 1) with 13.7˚C average value of temperature. It suggests that this water temperature is a good for inhabitant consumers and based on water quality, high temperature negatively impact water quality by enhancing the growth of micro-organisms which may increase taste, odor, color and corrosion problems [30] . Decrease of water temperature lead to increase the solubility of some gases such N2, CO2 and O2 that make the quality and taste of water better. The pH value of water samples shows a range of 7.17 - 8.24 (Table 2). According the WHO guideline 2011, Standard values for Afghanistan and National Standard of most Asian countries limitation is (6.5 - 8.5). Potential of hydrogen in water samples shows on an average of 7.95 for whole study area. The World Health Organization [4] recommends a pH value of 6.5 or higher for drinking water to prevent corrosion. Thus the pH above 8.0 would be disadvantageous in the treatment and disinfection of drinking water with chlorine [30] . However, pH values between 6.5 and 8.5 usually indicate good water quality and this range is typical of most drainage basins of the world [35] . Electrical Conductivity values recorded ranged from 272 - 424 μS・cm−1 (Table 1). The average of EC in water samples for throughout of interested area recorded 340 μS・cm−1. This indicates there is very strong dissolution of solute in samples water. In industrial and domestic uses when the conductivity gets too high, indicating a potentially harmful accumulation of solids, a quantity of water is drained out of the system and replaced with water having lower conductivity. The Total Dissolved Solid values of water sample are ranged on 130.2 - 431 that all the water samples analysis values fall below the WHO recommended guideline of 1000 mg・L−1. Whenever the water TDS were below 1000 mg/lit, it is indicate to be fresh water and suitable for irrigation and drinking purposes.
The total hardness values of water samples ranged on 140 - 170, the average hardness is 150. The samples No. HM1,
, HM3 and HM3′ are moderately hard but the sample No. HM2 and HM4 are very hard. Hardness does not pose a health risk [36] . The salinity of water samples are at range of 0 - 0.20. This means the salinity of water in area of interest is very low and indicated the good quality for drinking purpose. The values of water samples are sufficient for drinking purposes. Dissolved oxygen in the surface water can tell us about photosynthesis. The color values of water sample analysis ranged from 3 - 10 and the average is 6, whereas it is below based on WHO guideline 2011 and Standard values for Afghanistan. A bit visibility of color in drinking water is not harmful for drinking purpose. But high visibility of color in water may be affective for some aquatic environments. The turbidity values of water samples recorded at range of 0.5 - 10 (Table 1) and the areas which turbidity is five or below of five is good, but the station No 3 (water sample of HM3, HM3′ ) the turbidity values are 7.48 and 10 indicating that turbidity is very much based on WHO guideline 2011 and Standard values for Afghanistan. High turbidity can significantly reduce the aesthetic quality of lakes and streams, having a harmful impact on recreation and tourism. It can increase the cost of water treatment for drinking and food processing [34] . Analysis reveals that the spring’s water of the study area are free of toxic substances, toxic agents and harmful chemicals, that indicates the area has very fresh and good quality of water according to world health organization 2011 guideline values, National standard of most Asian countries (NSMAC) and standard values for Afghanistan (SVFA). The calcium concentrations range from 20 - 60.12 mg・l−1, where the standard limit is up 75 mg・l−1, showing sufficient calcium in water samples (Table 4). The Magnesium and chloride concentrations also show the sufficient amount in water samples (Table 4).
The values of total alkalinity in water sample are from 150 - 225 mg・l−1 (Table 4). According on (Table 3) the bicarbonates values directly change to total alkalinity (TA) values. The sodium and total Iron analysis shows rather good quality of water in study area (Table 5). The analysis of OH, CO2, and HCO3, shows normal amount (Table 5). Existence of Fluoride (F), Sulphate (SO4), Phospate (PO3), Potassium (K), Nitrite (NO2), Nitrate (NO3), Ammuonia (NH3), Iron (Fe), Manganese (Mn), Copper (Cu), Aluminium (Al), Arsenic (As), Cyanide (Cy) with normal ranges (Table 6) indicates that the spring water is chemically fresh and nontoxic in this area of mine and suitable for drinking purpose of inhabitants.
There is no concern of diseases and health problems because of water quality based of chemical studies. However, the bacteriological analysis in water samples revealed that the total coli form bacteria ranged between 11 and 27 MPN/100ml (Table 7). This result indicates that spring water of interested area is not suitable for drinking purposes. Whereas these numbers may varies during the seasons of the year and inhabitant activities. Detection of total coil form bacteria in water samples required taken analysis for present of other kind of coli form bacteria in water samples. Unfortunately in four stations, the E. coli and fecal coli form bacteria in 100 ml of water samples are detected, which base on WHO guideline (2011), NSMAC and Afghanistan National Drinking Water Quality Standards (August 2012) [37] must not be used for drinking purposes (Table 7). In two stations of sampling, the E. coli, fecal coli form bacteria in 100 ml water samples are not detected (Table 7) whereas the total coli form is lower at ranged of 11 and 12 MPN/100ml. But these waters also are not potable water. Most coli form bacteria do not cause disease. But the E. coli strain 0157:H7 can cause serious illness. It has been found in cattle, chickens, pigs, and sheep. Cases of E. coli 0157:H7 caused by contaminated drinking water supplies are rare [25] . It means there is not serious matter because of non-existence or less chances of E. coli strain 0157:H7 in drinking water sources of study area.
5. Conclusion
As on the earth surface, springs are always in contact with open environments, vegetation cover, animals and soils; thus contamination level of these waters is very high and uncontrollable. The most acceptable solution in this area can be the construction of water system in the mouth of springs such reservoirs, which distributes drinking water through channels and pipes to consumers. In this study the major and unique sources of drinking water of inhabitants of this area are springs that flow from high altitudes to downward, whilst washing out of its entire movement direction, which resulted in the contamination of water, specifically the total coli form bacteria that exists in soil, vegetation cover and mammal’s feces; therefore drinking water system is required to be monitored and regular lab analysis is conducted to find out the presence of each kind of bacteria and toxic agents periodically and/or annually. Positive test for total coli form bacteria indicates that the same sample must be analysis for either fecal coli form or E. coli bacteria. Positive test for E. coli bacteria indicates that it is unsafe for drinking, as it is non-potable water, and avoids using for teeth brushing, bathing purposes, until the treatment of water done. Unfortunately in this study E. coli form bacteria exist in water sample that indicates there is a greater health risk to consumers that pathogens exist. Presence of pathogens in short term causes diseases such as diarrhea, cramps, nausea, headaches or other symptoms, as well as potentially poses long-term health effects, especially for infants, young children, elderly and people with severely compromised immune systems [38] . As surface water sources are more vulnerable to bacterial contamination, it is very significant to conduct regular awareness program by state and/or local authorities for inhabitants especially women, regarding water hygiene, water illness, water safety, and home treatments of drinking water. There are some methods and home treatment suggested to protect drinking water against bacterial contamination. The best method to treatment of drinking water is chlorinating. It is inexpensive and keeps the water system and water tank clean. Boiling the water is costly, impossible and not applicable at all for consumers, but water boiling is advised till to disinfection and/or confirmation that contamination has been eliminated and treated. The ultraviolet water filter system for providing 99.9% pure drinking water and ozone, or reversing osmosis systems is suggested but in this study, some houses are not furnished to water pipe system. If the contamination is a recurring problem after disinfection, thus it is the responsibility of government to provide drinking water for people, and hereby may be a good planning regulated by state or local authorities.
Acknowledgements
I am thankful to Green tech engineering and Construction Company especially Eng Haidari and Eng Rahimi. A special appreciation is extended to the Department of Hydrogeology, ministry of energy and water, Kabul Afghanistan especially Eng Aziz and Eng Ahmad Massud to provide laboratory facilities to carry out this work. Special thanks go to Mr Ali Ahmad Rezaye and Eng Enayatullah Tani for the cooperation and help to coordinates during field survey, sampling, transportation of samples. Great thanks go Eng Basir Traki, GIS expert for providing maps. Finally I am grateful of constructive comments of the reviewers.
Appendix
1. Estimation of Calcium (Ca2)
Take 50 ml sample in conical flask. If the sample is having higher alkalinity, use smaller volumes diluted to 50 ml, add 2 ml of sodium hydroxide (NaOH) solution in the sample then add 100 to 200 mg of murexide indicator a pink color develops. Titrate against ethylenediaminetetraacetic acid (EDTA) solution until the pink color changes to purple. For better judgment of end point, compare the purple color with the distilled water blank titration end point.
(1)
where,
X = volume of EDTA used.
2. Estimation of Magnesium (Mg2)
Find out the volume of EDTA used in calcium determination. Also find out the volume of EDTA used in hardness (Ca+Mg) determination with same volume of the sample as taken in the calcium determination.
(2)
where,
Y = EDTA used in hardness determination.
X = EDTA used in calcium determination for the same volume of the sample.
3. Estimation of Chloride (Cl)
Take 50 ml of sample in a conical flask and add 2 ml of K2CrO4 solution. Titrate the contents against 0.02 N AgNO3 until a persistent red thing appears.
(3)
where,
ml = burette reading.
4. Estimation of Phenolphthalein Alkalinity (PA)
Take 100 ml of sample in a conical flask and add 2 drops of phenolphthalein indicator. If the solution remains colorless, phenolphthalein alkalinity = 0. If the color changed to pink after addition of phenolphthalein, titrate it with 0.1 N HCl until the color disappears at end point, this is phenolphthalein alkalinity (PA).
(4)
where,
A = ml of HCl used with only phenolphthalein.
5. Estimation of Total Alkalinity (TA)
Take 100 ml of sample in a conical flask and add 2 drops of phenolphthalein indicator. If the solution remains colorless, phenolphthalein alkalinity = 0. Now add 2 - 3 drops of methyl orange to the same sample and continue the titration further, until the yellow color changes to pink at the end point. This is total alkalinity (TA).
(5)
where,
B = ml of total HCl used with only phenolphthalein and methyl orange.
6. Estimation of Hydroxide OH, Carbonate CO3 and Bicarbonate HCO3
Concentration of carbonates, Bicarbonates and Hydroxyl ions in a sample can be determined from the phenolphthalein alkalinity and total alkalinity values (Table 3). The primary forms of alkalinity in water are Hydroxide, carbonates, Bicarbonates ions.
NOTES
#Fatima Rezaye’s guide.