Synthesis of Chiral Schiff Base Metal Complex Inducing CD and Elucidation of Structure of Adsorption on Surface of Gold Nanoparticles ()
1. Introduction
Metal nanoparticles including gold nanoparticles have been a subject of research and applications in various fields because it has unique properties of surface plasmon resonance (SPR). There are many types of plasmonic concepts and applications. For example, the plasmon concept of the refractive index change is applied to the refractive index sensing [1] [2] and then the plasmon concept of hot electron transfer is conductivity and catalysis [3] [4] [5] . In addition, the plasmon concept of plasmon resonance energy transition is applied to SER and SERS [6] [7] [8] [9] [10] and then the plasmon concept of multiphoton photoluminescence is used to light-emitting systems [11] , the concept of magnetic plasmon propagation is used to plasmonic antiferromagnetism [12] . The concept of chiral dipole-dipole coupling has been applied to optically active plasmon [13] [14] [15] [16] .
Recently, induced CD on metal nanoparticles from chiral additive molecules including biomolecules [17] have been attracted much attention in the field of nano-chirality [18] [19] [20] , which are beyond conventional framework of chirality of micro-matters [21] . In principle, intensity of induced CD increases or decreases depending on parallel and perpendicular arrangement of transition moments of metal nanoparticles and chiral additive molecules, respectively [20] . However, actual situation of supramolecular systems of metal nanoparticles and chiral additives are more complicated. Although some metal nanoparticles exhibit chiroptical properties [22] , addition of chiral additives onto achiral metal nanoparticles may be significant due to their potential applications for chiral catalysts [23] . Elucidation of the adsorption structure of the gold and the chiral additives and its effects are also an important concern (Scheme 1) [24] [25] [26] .
To date we have reported induced CD due to chiral Schiff base metal complexes onto various materials, for example, achiral Schiff base metal complexes [27] , achiral ferrocene [28] , metallodendrimers and metal nanoclusters made in them [29] [30] , nanoparticles of metal semiconductors [31] . Some chiral Schiff base complexes have large electronic transition dipole moment, but less induced CD can be observed experimentally. As for copper nanoparticles made in metallodendrimers [31] [32] disagreement between experimental results [32] and theoretical dipole moment [33] may be attributed to molecular recognition of chiral additives onto particle surfaces [34] . Moreover, some chiral metal complexes exhibited weaken induced CD [35] because of arrangement of dipole molecules of both species.
Practically, chiral AuNP catalysts will be expected as candidate materials for organic silanol reaction that has been used as an attractive nucleophile agent mainly. There may be three reaction acts as nucleophile agent of silanol. The first is used as a bond formation or base by nucleophilic reaction of silanol oxygen. The second is a specific reaction of the neighboring functional groups that use the interaction between the hydroxyl group and a metal compound. And the third is a molecule conversion utilizing specific reactivity of the silicon-bonded carbon one based on the presence of silanol hydroxyl groups. In this way, silanol
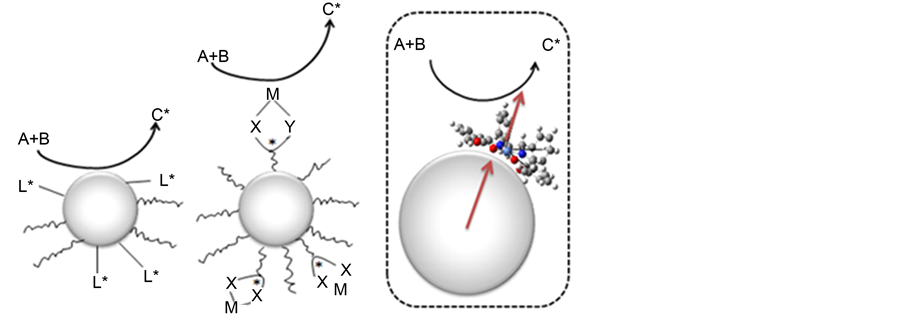
Scheme 1. Concept of chiral catalysis including AuNP: [Left] heterogeneous type having chiral ligands [23] , [Middle] chiral homogenous type linked by AuNP binder [23] , [Right] homogeneous type having chiral ligands (present).
might be attractive as a nucleophile agent. Moreover, the expected co-product must be hydrogen gas in the synthesis process, which is ideal in terms of the environment.
Herein we have successfully observed considerably intense induced CD demonstrated onto AuNP in plasmon region due to chiral Schiff base Ni(II), Cu(II), and Zn(II) complexes (compound 1a-1c) for the first time. With a different ligand complex of by synthesizing eleven compounds (compound 2a-5c) including compound 1a-1c (Scheme 2), we compared the differences of the induced CD. Using a TD-DFT we predicted adsorption structure.
2. Methods and Experimental Details
2.1. Preparation of Complexes
We prepared eleven compounds has various ligands. Compounds 1a, 1b and 1c were prepared according to the literature procedure [36] . Compounds 2a and 2b were prepared according to the literature procedure [37] . Compound 4 was prepared according to the literature procedure [38] .
Preparation of 2c: To a solution of salicylaldehyde (0.244 g, 2.00 mmol) dissolved in methanol (40 mL), (1R,2R)-(+)-1,2-Diphenylethylenediamine (0.212 g, 1.00 mmol) was added and stirred at 313 K for 2 h to give yellow solution of ligand. Zinc(II) acetate dehydrate (0.220 g, 1.00 mmol) was added to the resulting solution and stirring at 313 K for 2 h to give yellow solution of the complex. After cooling the solution, this yellow compound was filtered. Yield 0.302 g (61.4%). Anal. Found: C, 56.27; H, 5.25; N, 54.53%. Calc. for C28H22N2O2Zn: C, 59.15; H, 5.42; N, 4.18%. IR (KBr (cm-1)): 1627 (C=N). UV-Vis (diffuse reflectance) peak/nm; 391. CD (KBr) peak/nm; 383.
Preparation of 3: To a solution of 2,3-Dihydroxybenzaldehyde (0.276 g, 2.00 mmol) dissolved in methanol(40 mL), (1R,2R)-(+)-1,2-Diphenylethylenedia- mine (0.212 g, 1.00 mmol) was added and stirred at 313 K for 2 h to give brown solution of ligand. Copper(II) acetate monohydrate(0.200 g, 1.00 mmol) was added to the resulting solution and stirring at 313 K for 2 h to give brown solution of the complex. After cooling the solution, this brown compound was fil
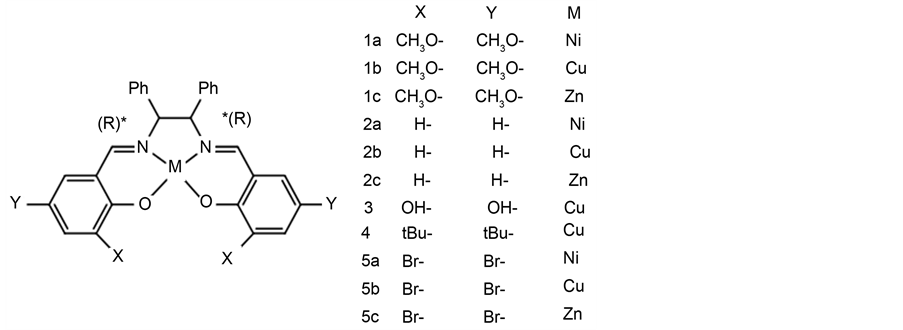
Scheme 2. Chemical Structures of eleven compounds.
tered. Yield 0.412 g (77.7%). Anal. Found: C, 65.59; H, 4.61; N, 5.37%. Calc. for C28H22N2O4Cu: C, 65.42; H, 4.31; N, 5.45%. IR (KBr(cm−1)): 1617 (C=N),3417 (OH). UV-Vis (diffuse reflectance) peak/nm; 446, 574. CD (KBr) peak/nm ; 434, 610.
Preparation of 5a: To a solution of 3,5-Dibromosalicylaldehyde (0.560 g, 2.00 mmol) dissolved in methanol (40 mL), (1R,2R)-(+)-1,2-Diphenylethylenedia- mine (0.2122 g, 1.00 mmol) was added and stirred at 313 K for 2 h to give yellow solution of ligand. Nickel (II) acetate tetrahydrate (0.249 g, 1.00 mmol) was added to the resulting solution and stirring at 313 K for 2 h to give orange solution of the complex. After cooling the solution, this orange compound was filtered. Yield 0.695 g (86.8%). Anal. Found: C, 42.76; H, 2.36; N, 3.44%. Calc. for C28H18Br4N2O2Ni: C, 42.42; H, 2.29; N, 3.53%. IR (KBr (cm-1)):1620 (C=N). UV-Vis (diffuse reflectance)/nm ; 430, 573. CD (KBr) peak/nm ; 409, 572.
Preparation of 5b: To a solution of 3,5-Dibromosalicylaldehyde (0.560 g, 2.00 mmol) dissolved in methanol (40 mL), (1R,2R)-(+)-1,2-Diphenylethyle- nediamine (0.212 g, 1.00 mmol) was added and stirred at 313 K for 2 h to give yellow solution of ligand. Copper(II) acetate monohydrate(0.200 g, 1.00 mmol) was added to the resulting solution and stirring at 313 K for 2 h to give green solution of the complex. After cooling the solution, this green compound was filtered. Yield 0.725 g (90.9%). Anal. Found: C, 42.06; H, 2.27; N, 3.43%. Calc. for C28H18Br4N2O2Cu: C, 42.16; H, 2.27; N, 3.51%. IR (KBr (cm-1)):1623 (C=N). UV-Vis (diffuse reflectance) peak/nm; 399, 582. CD(KBr) peak/nm ; 379, 575.
Preparation of 5c: To a solution of 3,5-Dibromosalicylaldehyde (0.560 g, 2.00 mmol dissolved in methanol (40 mL), (1R,2R)-(+)-1,2-Diphenylethylenediamine (0.212 g, 1.00 mmol) was added and stirred at 313 K for 2 h to give yellow solution of ligand. Zinc(II) acetate dihydrate (0.220 g, 1.00 mmol) was added to the resulting solution and stirring at 313 K for 2 h to give yellow solution of the complex. After cooling the solution, this yellow compound was filtered. Yield 0.692 g (86.6%). Anal. Found: C, 42.01; H, 2.02; N, 3.33%. Calc. for C28H18Br4N2O2Zn: C, 42.07; H, 2.27; N, 3.50%. IR (KBr (cm-1)): 1629 (C=N). UV- Vis (diffuse reflectance) peak/nm; 404. CD (KBr) peak/nm ; 401.
2.2. Preparation of AuNP and Complexes of Composite Solution
AuNP (10 nm) were purchased from Funakoshi (BMGC10) and used without further purification. Spectral measurements were performed as 0.005 mM-0.1 mM solutions for chiral metal complexes and the most suitable 1:1 (v/v) solutions for mixed solutions of chiral metal complexes and AuNP. The experimental conditions were investigated widely.
2.3. Measurements
Electronic spectra were measured on a JASCO V-570 spectrophotometer in the range of 900-200 nm at 298 K. Circular dichroism (CD) spectra were measured on a JASCO J-725 spectropolarimeter in the range of 800-200 nm at 298 K.
2.4. Calculations
Geometry optimization and normal vibration analysis are computed using DFT with B3LYP functional, Lanl2dz for Cu, Ni, and Zn and 6-31+G(d) basis set for H, C, N, O and Br in the GAUSSIAN 03 program package [39] . In addition, transition electric dipole moment and excitation energies are calculated using TD-DFT with B3LYP functional, Lanl2dz for Cu, Ni, and Zn and 6-31+G(d) basis set for H, C, N and O. For comparison, transition electric dipole moment and excitation energies are also calculated using ZINDO. As ability of induced CD, dipole moments of molecules were calculated by TD-DFT.
2.5. Rietveld Structural Analysis
The powder X-ray diffraction (XRD) pattern of complexes 2c (Figure 1) were collected at 298 K on Rigaku Smart lab at the University of Tokyo. A capillary was packed with a powder sample (whose quality was confirmed characteristic peaks around 7, 8, and 17 degree) and measurement was performed. Intensity data were collected on a Rigaku Smart lab with graphite monochromated Cu Kα radiation (1.54184 Å). Structural analysis by the Rietveld method [40] was carried out using PDXL2 ver.2.2.1.0 (Rigaku Corporation).
2.6. X-Ray Crystallography
Single crystals were glued on top of a glass fiber and coated with a thin layer of epoxy resin to measure the diffraction data. Intensity data were collected on a Bruker APEX2 CCD diffractometer with graphite monochromated Mo Kα radiation (k = 0.71073 Å). Data analysis was conducted using the SAINT program package. The structures were solved by direct methods with SHELXS-97 [41] , expanded by Fourier techniques and refined by the full-matrix least-squares method based on F2 with the program SHELXL-97 [41] . An empirical absorption correction was applied in the program SADABS. All non-hydrogen atoms were readily located and refined by anisotropic thermal parameters. All hydrogen atoms were located at geometrically calculated positions and refined using riding models.
![]()
Figure 1. Powder X-ray diffraction patterns of 2c.
3. Results and Discussion
3.1. CD spectra and UV Spectra Results
Figures 2-4 depict electronic and CD spectra of hybrid system of AuNP and 1a, 1b and 1c, respectively. Pure AuNP (10 nm) showed surface plasmon band at around 530 nm without distinct CD bands. On the other hand, Pure compound 1a, 1b and 1c exhibited predominant absorption bands at 400, 380, and 380 nm, respectively, and predominant CD peaks at 400 nm. It should be noted that mixed solutions (namely hybrid systems) of each metal complex and AuNP (10 nm) exhibited predominantly induced CD bands at about 600 nm. The bands are close to surface plasmon band of pure AuNP and no CD peak could be observed as neither pure AuNP nor pure 1a, 1b and 1c. It should also be noted that the intensity of induced CD peaks were clearly increased for the first time among our studies using chiral Schiff base additives, which is distinctly different from weakly induced or negatively induced ones [32] . Interestingly, additional and characteristic (chiro) optical absorption resulting from supramolecular assemblies could be observed for the present system.
Induced CD was observed in the same manner about 4, 5a, 5b and 5c. Induced CD was not observed about 2a, 2b, 2c and 3. From the existing theory [20] , it considered for the dipole moment of the gold nanoparticles and the complexes is a vertical. The supporting information shows the results of other compounds.
![]()
Figure 2. CD and electronic spectra of the systems of AuNP and 1a. Plasmon-induced is observed to 550 nm.
![]()
Figure 3. CD and electronic spectra of the systems of AuNP and 1b. Plasmon-induced is observed to 550 nm.
3.2. TD-DFT Calculation and Expectation of Adsorption Structure
Figure 9 (left) shows calculated electric dipole moments (for optimized structures) of the chiral metal complexes, which are orientated in the direction of center of two phenyl groups regardless of metal centers. Furthermore, optimized structures of the complexes suggested that square planar coordination geometry and conformation of organic ligands are suitable for adsorption onto the surface of AuNP by methoxy groups. According to parallel arrangement of electric transition dipole moment to enhance induced CD band associated with surface plasmon band based on theoretical study [20] , electric supramolecular hybrid systems may be proposed in Figure 5 (right).
3.3. Structural Description
3.3.1. Structure Description of 2c
The crystallographic data and selected bond lengths for 2c are listed in Table 1 and Table 2, respectively. The crystal of 2c crystallized in the orthorhombic (chiral and non-polar) space group P212121 with Z = 2. This complex is a strain square-planar complex these central metal is zinc. Its packing shows in which
![]()
Figure 4. CD and electronic spectra of the systems of AuNP and 1c. Plasmon-induced is observed to 550 nm.
![]()
Figure 5. [Left] Calculated electric dipole moments (blue arrows in similar direction with slightly different magnitudes) for compound 1a, 1b and 1c of optimized structures. [Right] Proposed arrangement of supramolecular hybrid systems of chiral complex and AuNP.
planar ligands not to overlap (Figure 6, Figure 7). The results of calculation and results of X-ray structure analysis were compared. Surroundings of Zn are distorted flat type, which is different from the optimized structure adopting the plan type arrangement. Both of the phenyl groups were arranged in an overlapping manner, and it was almost the same arrangement as the optimized structure.
3.3.2. Structure Description of 3
The crystallographic data and selected bond lengths for 3 are listed in Table 3
![]()
Table 1. Crystal data and structure refinement (Rietveld with PDXL2) for 2c.
![]()
Table 2. Selected bond lengths[Å] and angles[˚] for 2c.
![]()
Table 3. Crystal data and structure refinement for 3.
![]()
Figure 6. Crystal structure of 2c showing selected atom labeling scheme. Hydrogen atoms are omitted for clarity.
![]()
Figure 7. A perspective view of the packing of 2c.
and Table 4, respectively. The crystal of 3 crystallized in the monoclinic (chiral and non-polar) space group C2 with Z = 4. This complex is a square-planar complex these central metal is copper (Figure 8). Its packing shows in which planar ligands overlap in the c axis direction (Figure 9). The results of calculation and results of X-ray structure analysis were compared. Independent two molecules of the asymmetric unit have the same structure, the periphery of the copper is a planar type, and both phenyl groups are arranged in an overlapping arrangement. The length from the adsorbed hydroxyl group was almost the same as the optimized structure (0.9773 nm).
4. Conclusion
We have observed significantly enhanced induced CD bands on AuNP for chiral Schiff base complexes and estimated their molecular arrangement based on parallel transition dipole moment. We have observed significantly enhanced induced CD bands on AuNP due to chiral Schiff base complexes and estimated their molecular arrangement based on parallel transition dipole moment. From
![]()
Figure 8. Crystal structure of 3 showing selected atom labeling scheme. Hydrogen atoms are omitted for clarity.
![]()
Figure 9. A perspective view of the packing of 3.
![]()
Table 4. Selected bond lengths[Å] and angles[˚] for 3.
XPS measurement, we found the complex is present in the Au substrate surface in the form of a complex. From the STM measurement, the complex which has been observed induced CD is adsorbed standing on the Au surface. On the other hand, the complex which has not been observed induced CD is adsorbed on the Au surface in the state complex which doesn’t have central metal. The proposed supramolecular structures have potential application as new type of chiral AuNP catalysts possessing merits of both heterogenous (AuNP with chiral ligands) and homogenous (AuNP supported chiral metal complexes) ones on the surface (Scheme 1). Further investigation about chiral catalytic functions is in progress now. However, it should be noted here that merely small amount of bubbles was confirmed from the Au substrate surface during the preliminary reaction aiming at applications.
Acknowledgements
This work was partly performed under the Cooperative Research Program of “Network Joint Research Centre for Materials and Devices”. The authors thank Profs. Kenji Hara and Toshikazu Kawaguchi (Hokkaido University) for preliminary discussion for surface and catalysis chemistry (Supplementary File).
Appendix A. Supplementary Data
CCDC 1480602 and 1480604 contains the supplementary crystallographic data for 2c and 3 respectively. These data can be obtained free of charge via http://www.ccdc.cam.ac.uk/conts/retrieving.html, or from the Cambridge Crystallographic Data Centre, 12 Union Road, Cambridge CB21EZ, UK; fax: (+44) 1223-336-033; or e-mail: deposit@ccdc.cam.ac.uk.
Supplementary File
1.1. XPS
The XPS measurement was performed in the gold substrate and complexes. This was confirmed the presence or absence of elements of gold substrate surface in order to examine the state of the adsorption of gold and complex in detail as a model case of gold colloid and complex solution.
1.1.1. Preparation of XPS Measurements
We performed XPS measurement for 1a, 1b, 1c, 3 and 4. First we prepared 10 nm × 10 nm square gold substrate, then prepared 0.01 mM methanol solution of compound 1a, 1b and 1c, also prepared 0.2 mM methanol solution of 3 and 4, respectively. The gold substrate put into sample tubes and tried interactions gold surface and complexes by immersing 1 hour complexes solution. Immersed gold substrate washed for three times with chloroform, and then dry surface with Ar gas. We measured for Au, C, O, N and Central metal atoms, respectively.
1.1.2. XPS Qualitative Analysis
According to XPS measurement, for example, it shows that the constituent elements of the 1a is present in the gold substrate surface. We observe binding energy that 84 eV for Au4f7/2 and 88 eV for Au4f5/2 peaks of the Au substrate elements, and then 285 eV for C1s, 532 eV for O1s, 398 eV for N1s, 853 eV for Ni2p3/2 and 870 eV for Ni2p1/2 peaks of constituent elements of 1a. Copper atom has been measured as a comparison but it should be appreciated that copper atom was not observed matter of course. In the same way, peak of the complex elements (C, O, N and Central metal atoms) also for 1b, 1c and 4 was observed. Although the C, O and N elements was observed for 3, the central metal has not been observed. This point will be discussed in conjunction with the STM. The supporting information shows the results of 1b, 1c, 3 and 4.
1.1.3. XPS Quantitative Analysis
We performed a quantitative analysis of elements by the area calculation for XPS spectrum of previous chapter. Results are shown Table 1.
Configuration element ratio Nitrogen and the center metal of the complexes is matched from the calculation results. Induced CD compounds is present on gold substrate with keeping its shape. Then, we calculated the percentage of nitrogen and central metal of the complexes on the basis of Table 1. The ratio of nitrogen and central metal in Au surface is 2:0.82(1a), 2:0.81 (1b), 2:1.28 (1c).This results is almost the same as the ratio of the elements of these compound. For 3, nitrogen and central metal is present on Au surface but about 4, the nitrogen is present but the central metal was not observed on the Au surface. We can say the presence or absence of the induced CD is, is that consistent with the presence or absence of the central metal by XPS spectra in this chapter.
1.2. STM
STM measurement was performed to investigate the adsorption structure of the gold substrate and the complex visually.
1.2.1. Preparation of STM Measurements
We performed STM measurement for 1a, 1b, 1c, 3 and 4. First we prepared 10 nm × 10 nm square gold substrate, then prepared 0.01 mM methanol solution of 1a, 1b and 1c, also prepared 0.2 mM methanol solution of 3 and 4, respectively. It was performed exima treatment (172 nm) for 3 minutes for activating the Au surface. The gold substrate put into sample tubes and tried interactions Au surface and complexes by immersing 1 hour complexes solution. Immersed gold substrate washed for three times with chloroform, and then dry surface with Ar gas.
1.2.2. Measurements of STM
In Figure S1, it can be observed gold atom one by one. The distance between atoms is consistent with 0.24 nm is a literature value of gold [42] .
In Figure S2, surface of Au and 1a can be observed layered structure on the left, also the structure of the particulate on the right can be observed. Figure S3 is the same sample as Figure S2 but a different location. We performed the analysis of the depth about where was surrounded by a square (Figure S4).
The grain height is 1.194 nm and it is that substantially coincide with the longitudinal length of 1a (1.266 nm). From this it can be said that the complex is adsorbed standing on the Au surface. This fact is consistent with the theoretical study [20] .
In Figure S5, surface of Au and 3 can be observed layered structure on the right, also the structure of the particulate on the left can be observed. Granular structure on the left we consider to be a structure derived from the same complex as in the case of 1a. However, in the XPS spectra, the central metal of the complex did not exist. We considered compound exist in the Au surface in the state of the ligand that compound has no central metal. This complex is induced CD was not observed but it is that this is one of cause.
![]()
Figure S1. STM image of 50 nm × 50 nm square Au substrate (maximum roughness was less than 1 nm).
![]()
Figure S2. STM image of 100 nm × 100 nm square Au and 1a substrate (1).
![]()
Figure S3. STM image of 100 nm × 100 nm square Au and 1a substrate (2).
![]()
Figure S4. Depth analysis and optimized structure of 1a.
![]()
Figure S5. STM image of 200 nm × 200 nm square Au and 3 substrate.