A Decision-Making Method for Improving Logistics Services Quality by Integrating Fuzzy Kano Model with Importance-Performance Analysis ()
1. Introduction
Customer satisfaction is very important for logistics companies seeking competitive advantage, because they realize that if they do not satisfy the expectation of customers, their place will be taken by other companies whose activities will be more concentrated on customer expectations [1] . But Chinese local logistics companies are of small and medium size, and scattered distribution, the only way to improve customer satisfaction is to enhance logistics services quality. Therefore, logistics services are gaining prominence in China as demonstrated through its essentiality and customer expectation [2] . In order to identify the priority of logistics services quality attributes, a decision-making method is constructed.
The Kano model of customer satisfaction proposes that the relationship between an attribute’s performance and satisfaction is non-linear. The purpose of customers’ satisfaction research is to reflect the real situation. However, researchers applied Kano’s model are always lack of considering the fuzzy and uncertainty of mentality and affection when devising questionnaire [3] . Brandt [4] firstly developed a dummy regression model to identify the non-linear and asymmetric impacts of attribute performance on overall customer satisfaction. Yang [5] recommended that the results of classification should be divided into eight categories, so as to improve the accuracy of the Kano model. Although these methods facilitate the analysis of customer requirements, it ignores the fact that quality attribute performance and importance can affect the results of classification. Therefore, this study aims at integrating fuzzy Kano model with IPA model to address the shortcomings with using these two methods separately.
The rest of this paper is structured as follows. First we introduce the proposed fuzzy Kano model. Then we construct a detection method by integrating fuzzy Kano model with IPA to identify the priority of logistics services quality attributes. Following that, the results of the empirical study are presented. Conclusions are finally drawn in the last section.
2. The Proposed Fuzzy Kano Model
To deal with fuzziness of human thought, Zadeh [6] first introduced the fuzzy set theory, which was directed to the rationality of uncertainty through fuzziness or unknown situations. A major contribution of fuzzy set theory is able to represent fuzzy data. A fuzzy set is a class of elements with a continuum or discreteness of degrees of membership. Such a set is characterized by a characteristic function, which assigns to each element a degree of membership ranging between zero and one [3] .
According to the traditional Kano’s questionnaire (Table 1) and Kano’s evaluation table (Table 2), attributes are classified into five classes with distinct impacts on consumer satisfaction: attractive, one-dimensional, must- be, indifferent, and reverse attributes.
Traditional Kano’s questionnaire only set up singular answer or certain range of the answer, and customers can’t respond their multiple affections. If customers can select more than one answer to express the degree of their feelings, the answer presented will be closer to real thinking. Therefore, to meet the multiple affections of customers, a fuzzy Kano’s questionnaire based on the fuzzy logic is designed (Table 3).
![]()
Table 1. The traditional Kano’s questionnaire.
![]()
Table 3. The fuzzy Kano’s questionnaire.
Based on fuzzy Kano questionnaire, customers’ real feeling will be acquired. If we want to know ‘‘Whether or not to have a message to inform you?” to a customer belonging to which kind of quality attributes, its fuzzy idea result (Table 3) will be presented with combination of functional and dysfunctional.
A customer’s feeling is:
F = [0.2 0.7 0.1 0 0]
D = [0 0 0 0.2 0.8]
Use matrix multiplication,  will obtain a 5 × 5 Kano’s two-dimensional fuzzy relation combination S as:
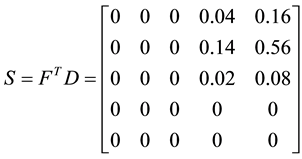
After S being obtained, two-dimensional attribute classification will be acquired based on Matzler and Hinterhuber’s [7] model as shown in Table 2.
Regarding to ‘‘Is there a message to inform me ?”, the customer has 0.64 feeling of this issue belonging to must-be quality attribute while 0.16 of one-dimensional quality attribute, 0.16 of indifferent quality attribute and 0.04 of attractive quality attribute .

In order to find a more accurate classification, the α-cut common consensus standard concept is used to get T. The threshold value of α ≥ 0.4 as an example, when total quality attribute level is greater than α, “1” will be represented; while is less than α, “0” will be represented. And T = (1, 0, 0, 0, 0) means the quality attribute can be classified to must-be.
Finally, the largest identification frequency of quality attribute fuzzy Kano’s model is the result agreed by majority. If the identification frequency is equal, the results can be determined according to the prioritization of quality attribute category. The prioritization of quality attribute category as following: first is must-be, then one-dimensional, attractive, indifferent and reverse attributes.
3. The Constructed Detection Method
3.1. Importance-Performance Analysis
Importance-performance analysis, originally introduced by Martilla and James [8] , is a technique for prioritizing attributes for improvement based on customers evaluation of the importance of each product or service attribute and provider performance in each attribute [9] . In general, data from satisfaction surveys are used to construct a two-dimensioned matrix, where importance is depicted along the x-axis and performance along the y-axis. The matrix is divided into four quadrants by different degree of importance and performance (see Figure 1).
Quadrant I means “Concentrate here”, products or service attributes are rated high in importance but low in performance. To improve performance, a company should concentrate on these attributes.
Quadrant II means “Keep up the good work”, products or service attributes are considered high in both importance and performance. The company should maintain competitive advantage.
Quadrant III means “Possible overkill”, products or service attributes in this area are evaluated low in importance and high in performance. Resources committed to these attributes that could better be employed elsewhere.
![]()
Figure 1. Importance-performance analysis (IPA).
Quadrant IV means “Low Priority”, products or service attributes both low in importance and performance. Company should ignore these attributes.
3.2. The Integrated Fuzzy Kano and IPA Model
In order to calculate the satisfaction rating of each attribute, Kano [10] proposed contribution of satisfaction coefficient (CS coefficient). CS coefficient means the ability of a product or service attribute that can enhance satisfaction.
 (1)
(1)
For the purpose of estimating the importance of attributes, questions about products or service importance in the questionnaire should be designed. For the convenience of calculation, attributes importance rating is coded (Table 4). For example, “unimportant” is coded “1”.
Hence the CS coefficient and importance coefficient were both obtained. To construct the importance-per- formance matrix, the mean of the attribute’s CS coefficient was calculated. Also, the mean of the attribute’s importance coefficient was calculated.
What’s more, when attributes locate in the same quadrant, there are different priorities of these attributes. The prioritization of quality attribute category as following: first is must-be, then one-dimensional, attractive and indifferent attributes. Therefore, the priority of service quality attributes was determined by integrating the fuzzy Kano model and IPA. And companies can enhance service quality by improving the attribute which is the top priority.
3.3. The Decision-Making Method for Improving Logistics Services Quality
Figure 2 shows the constructed decision-making method. The method can help companies ascertain the logistics service quality attributes and determine the priority of logistics service quality attributes.
First at all, looking at the whole process of logistics service from the customer perspective and getting the related information. Then the attributes of logistics quality were identified through the SERVQUAL model. By applying an approach of fuzzy Kano and IPA questionnaire to research the customers, the satisfaction and importance degree were both obtained. Finally, the priority of logistics service quality attributes was determined. Logistics companies can improve the key logistics services quality attributes and acquire a competitive advantage.
![]()
Table 4. Importance quantization table.
4. Data Analysis and Results
This section uses empirical data of the case study to show some of the problems of the logistics service in China. The main purpose is to make clear, for Chinese local logistics companies, the need for the improvement of the key logistics service quality attributes. The attributes of logistics quality were identified through the SERVQUAL model (Table 5).
The questionnaire comprised two parts. The first part aims to understand the basic personal data of customers,
![]()
Table 5. Logistics service quality attributes table.
as well as their gender, age and profession. Table 6 provides the basic personal data of customers. Of the 117 total number of customers, 58 (49.57%) were male and 59 (50.43%) were female customers. This gender composition is a reasonable representation of the customer in China. The majority of the customers were betweenthe ages of 20 and 40. Also, the majority (30.77%) of the customers were students, which we believe is the most important characteristic of the customer group who are most likely to use the logistics. The second part is the fuzzy Kano and IPA questionnaire which was designed according to the logistics service quality attributes table. By applying an approach of fuzzy Kano and IPA questionnaire to research the customers, the satisfaction and importance degree were both obtained. The survey was conducted with a random sample of customers. From April 20 through May 20, 2014, 150 copies have been issued and 117 copies of effective retrieved (78%).
Comparison of different threshold value of α, classification results of logistics service quality attributes were shown in Table 7. Through the Table 7, different threshold value of α obtained different classification results. For example, the logistics service quality attribute f3 of α = 0.1 classification result is “indifferent”. However, the logistics service quality attribute f3 of α = 0.3 classification result is “one-dimensional”. With different threshold value of α, each of the logistics service quality attributes of frequency is different. The sum of the frequency of each service attribute under different confidence level was shown in Table 8.
On the one hand, α-cut is over small, lower sample subordination and over happy threshold will be formed. On the other hand, over large α-cut is easy to cause issue of fewer samples and decrease representation of inference population. For example, when α = 0.1, the sum of the frequency of each service attribute is more than the number of effective questionnaire. There is a phenomenon of greater information crossover. When α = 0.7, the sum of the frequency of each service attribute is less than the number of effective questionnaire. There is a phenomenon of information distortion. Therefore, based on experience and references to set α = 0.4, it is able to obtain more accurate classification results. The final classification results of logistics service quality attributes are shown in Table 9.
Table 10 shows the average satisfaction and importance degree of logistics service quality attributes. The average importance of logistics service quality attributes is 3.43760683 and the average perceived performance of logistics service quality attributes is 0.48240265. By utilizing the data in Table 10, the IPA matrix was constructed (see Figure 3).
Through the analysis of Figure 3, the priority of logistics service quality attributes was determined. Table 11 shows the results of the logistics service quality detection method. According to Table 11, three attributes, f4, f7 and f1, are the most in need of improvement. These attributes are classified as must-be, which are rated high in importance but low in performance. To improve logistics service quality, the companies should concentrate on these attributes. Under the framework of IPA, f8, f10, f3 and f2 are placed in the area of “possible overkill”. According to IPA, a reduction of the resources allocated for these attributes can be considered. Finally, f9, f5 and f6 are located in “low priority” of the IPA matrix, indicating no urgent need for improvement.
According to the empirical study, not all logistics service quality attributes are viewed as equally important to
![]()
Figure 3. Importance-performance analysis.
![]()
Table 6. The basic personal data of customers.
![]()
![]()
Table 7. Classification results of logistics service quality attributes under different confidence level.
![]()
Table 8. The sum of the frequency of each service attribute under different confidence level.
![]()
Table 9. The final classification results of logistics service quality attributes.
![]()
Table 10. The average satisfaction and importance degree of logistics service quality attributes.
![]()
Table 11. The results of the logistics service quality detection method.
customers, meaning when the resources are limited, companies should improve the key logistics services quality attributes and acquire a competitive advantage. For logistics companies, three attributes, f4 “Delivered goods intactly”, f7 “Timely processing of complaints and compensation” and f1 “Goods delivered within the specified time”, are the most in need of improvement. Furthermore, these attributes are effective to fulfilling improving overall satisfaction. But there are no attributes located in Quadrant II. It can be inferred that the attribute which considered high in both importance and performance is nonexistent. Therefore, logistics companies need to be aware that there are still a number of services should be improved.
5. Conclusions
In resources limited situation, seeking relationship between customer satisfaction and logistics service performance is meaningful for the development of logistics companies. Therefore, it is crucial for logistics companies to understand which logistics service quality attributes can increase satisfaction, and their improving priorities to help make better decisions. Thus, the identification of logistics service quality attributes importance and their contributions on improving customer satisfaction have become more necessary to logistics companies success.
Considering traditional Kano model classification is subjective, the contribution of this study is, therefore, to integrate fuzzy Kano model with IPA model to address the shortcomings with using these two methods separately. What’s more, constructing a decision-making method can help logistics companies determine the priority of logistics service quality attributes. Also, through the use of empirical data of the case study, this study obtains the key logistics services quality attributes which are the most in need of improvement.
In spite of the fuzzy Kano and IPA model proposed in this study has higher effectiveness in decision making, some limitations still exist. First, the sample data of this study is less. Thus, future studies should include more samples to make conclusions with higher reliability. Second, the fuzzy Kano and IPA model is extremely dependent on the customers’ perception in making decisions. Therefore, the logistics companies’ experiences and opinions should be taken into consideration.
Acknowledgements
The authors thank the editor and the referees for carefully reading the paper. The first author (Qingliang Meng) is supported by the National Social Science Fund of China under Grant 14CGL014, Social Science Fund of MOE under Grant 11YJA630078 and China Post-Doctoral Research Fund under Grant 2013M530353.